May 18, 2026
## Global Commodity Volatility and Copper Price Dips
Global commodity markets have entered a period of heightened volatility as traditional supply-demand dynamics interact with unprecedented macroeconomic forces. In this environment, copper price dips illustrate the shifting balance between supply constraints and demand pressures. Industrial metals, particularly copper, are under the spotlight as structural electrification demand collides with cyclical economic headwinds. For instance, market analysts recently discussed the argentine copper outlook as a critical driver behind current trends.
Global supply chains are facing unprecedented challenges due to geopolitical uncertainties and macroeconomic shifts. Furthermore, industry players are increasingly focused on factors such as trade policies and exchange inventory dynamics. In addition, investors are keeping a close watch on reports like the copper and uranium investments that provide unique insights into capital allocation in the resource sector.
## Understanding Recent Copper Price Volatility Patterns
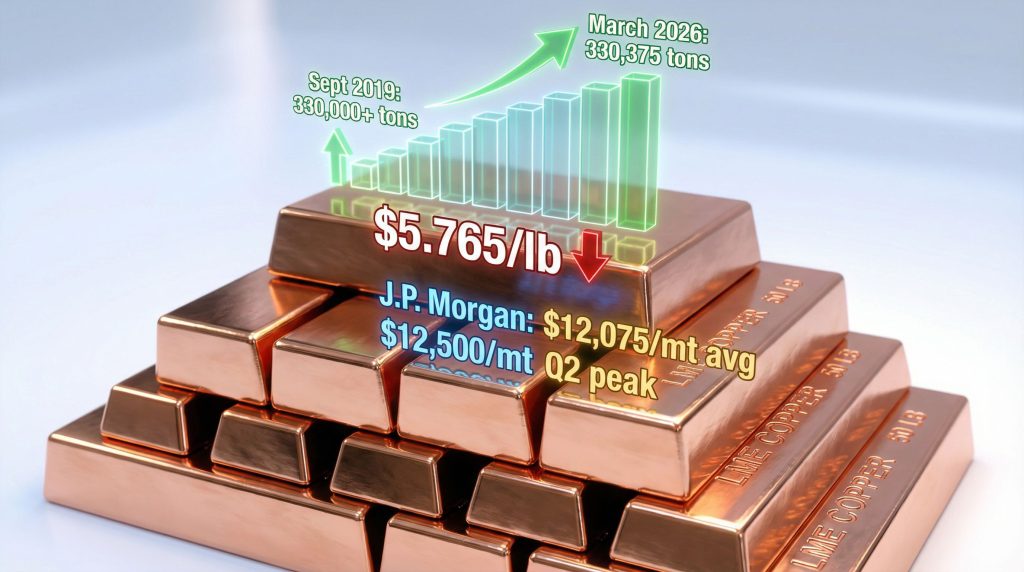
Market participants have noted that copper price dips occur amid substantial inventory accumulation across major global exchanges. The London Metal Exchange reported stockpiles reaching 330,375 tons after a one-day increase of nearly 19,000 tons. However, despite these shifts, the market continues to operate under complex conditions that call for further examination of underlying trends.
Analysts suggest that this inventory surge reflects broader shifts in physical market dynamics. Industrial buyers now demonstrate increasing price sensitivity at elevated levels. Consequently, when spot pricing hovers near $12,740 per ton, despite a retreat from January 2026 peaks above $14,500 per ton, demand elasticity drives traders to reassess their procurement strategies. Moreover, various studies, such as the codelco-adani copper deal, reinforce the idea that strategic partnerships may also influence these fluctuations.
## Regional Demand Patterns and Market Imbalances
Chinese copper markets present particularly notable shifts as spot premiums transition toward discount territory. This move suggests that inventory financing activities are substituting for genuine consumption weakness. For instance, market participants use metal holdings as collateral, thus making storage economically rational when the cost of futures spreads creates a negative basis.
Furthermore, regional arbitrage opportunities emerge when sellers struggle to clear cargoes in traditional consumption centres. Conversely, alternative storage locations offer more favourable cost structures. Such dynamics are reflected in trade monitoring reports that highlight the tariff impact on copper stocks. In addition, some external sources note a similar sentiment in a recent mining news update.
## Exchange Inventory Dynamics Signal Market Rebalancing
The rapid buildup of exchange-tracked stockpiles is interpreted as a normal market response rather than a fundamental demand collapse. Historical analysis indicates that inventory accumulation typically occurs at pricing levels that trigger buyer resistance even as production remains robust.
Market analysts highlight that stockpile accumulation forms part of normal market functioning. Moreover, sectors such as industrial production address continuous performance challenges. In addition, details from the us copper production overview reveal that production strategies are adjusted to suit these dynamics.
### Warehouse Location Analysis Reveals Storage Patterns
Below is an overview of current storage trends, which highlight the regional variance in capacity utilisation, cost structures, and strategic significance:
- European Warehouses: 65-70% capacity utilisation; higher storage costs; traditional trading hub
- Asian Facilities: 80-85% capacity utilisation; competitive rates; proximity to manufacturing
- North American Sites: 45-50% capacity utilisation; moderate costs; policy-driven demand
This geographic distribution suggests that storage operators optimise locations based on regional consumption and logistical considerations. Furthermore, these patterns emphasise the role that regional infrastructure plays in determining local price pressures.
### Financing Market Mechanics Drive Storage Decisions
Currently, three-month copper lease rates support inventory financing strategies, particularly when the spreads between futures prices and financing costs create opportunities for positive carry. Investors frequently capitalise on these arbitrage windows to maintain exposure while managing working capital efficiently. In addition, this process allows market participants to bypass short-term price volatility.
These mechanisms mean that inventory build-ups can occur even while fundamental supply-demand balances remain intact. Moreover, the strategic integration of financing approaches into physical trading operations has led to temporary disconnects between stockpile data and underlying consumption trends.
## Price Level Analysis Within Historical Context
Present-day copper pricing maintains significant premiums over long-term production incentive levels. This creates affordability challenges for price-sensitive applications while supporting healthy margins for producers. Analysts note that despite periodic dips, copper price dips serve as temporary corrections that do not alter the overall upward trajectory in the medium term.
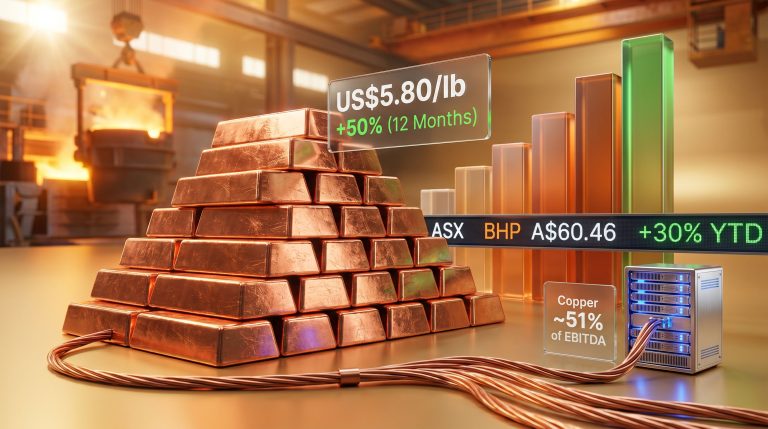
Current levels, with a 30% year-over-year increase, have been instrumental in bolstering producer economics across the cost curve. Producers are now better positioned to invest in expansion projects that require substantial capital investment. In addition, these pricing conditions reinforce the idea that production incentives remain a key driver of market sustainability.
### Production Cost Benchmarking Reveals Margin Sustainability
An assessment of industry cost structures highlights the following key metrics:
- Cash costs: $4,200-$5,800 per ton across major producers
- All-in sustaining costs: $6,500-$8,200 per ton including capital requirements
- Incentive pricing: $9,500-$10,500 per ton for new project development
- Current market price: $12,740 per ton
These figures demonstrate that current price levels support ongoing production while incentivising expansion. Consequently, efficient producers enjoy a margin cushion that creates operational flexibility during periods of market volatility.
### Historical Price Cycle Comparisons
A comparison with previous commodity cycles shows that current levels occupy an intermediate space between crisis-driven peaks and recession-induced troughs. For example, during the 2008 financial crisis, copper prices neared $8,900 per ton, whereas in 2011, supply pressures pushed prices to around $10,200 per ton.
Such inflation-adjusted analysis confirms that nominal prices today translate to historically elevated levels. The interplay of monetary policy and supply-demand tightness across industrial metals underscores the importance of viewing technical corrections as temporary rather than fundamental shifts.
## Industrial Demand Forces Reshape Consumption Patterns
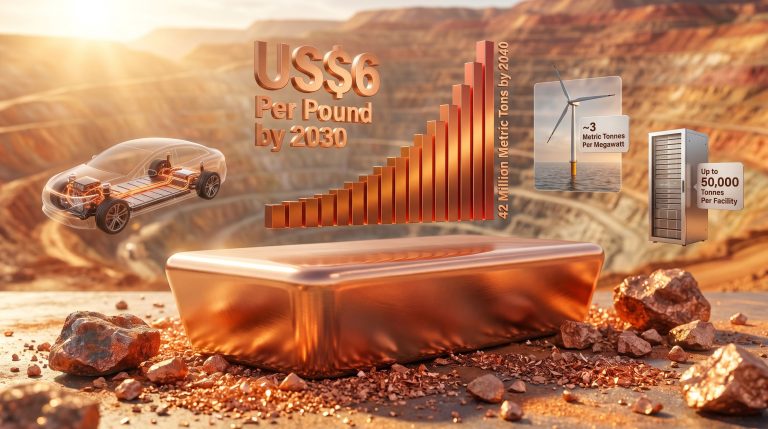
The energy transition has become a major impetus for copper demand growth. Applications such as electric vehicle production, renewable energy installations, and grid modernisation projects drive sustained consumption regardless of cyclical downturns. As a result, these sectors benefit from a long-term pricing floor that buffers against short-term fluctuations.
### Electrification Impact Quantification
The following details shed light on copper requirements by application:
- Electric Vehicles: Approximately 185 pounds per vehicle (four times that of a conventional automobile)
- Wind Turbines: 3-5 tons per megawatt installed capacity
- Solar Installations: 4-5 tons per megawatt of photovoltaic capacity
- Grid Infrastructure: 1.5-2.5 tons per mile of transmission lines
These technical requirements ensure that copper remains a critical input where substitution is challenging. In addition, project developers tend to account for copper costs as part of overall capital expenditure rather than treating them as variable inputs.
### Regional Consumption Divergence
Chinese copper demand, which accounts for roughly 55% of global refined copper consumption, exhibits high seasonality and policy sensitivity. The shifts in construction activity, manufacturing output, and infrastructure spending create predictable patterns that influence inventory dynamics.
Market insight: Demand softness in China typically stems from project delays rather than long-term consumption deterioration. Moreover, North American and European consumption remains more stable, albeit with lower growth rates. It is important to note that regional arbitrage opportunities arise when pricing differentials develop between these markets.
## Supply-Side Constraints and Medium-Term Price Support
Global copper mine production faces structural challenges driven by declining ore grades, complex metallurgy, and protracted project development timelines. These supply-side constraints provide fundamental support for prices, even as market sentiment fluctuates in the short term.
### Ore Grade Decline Impact Analysis
An analysis of global average copper grades reveals the following trends:
- 1990-2000: Average grade at 1.2%, declining at approximately -1.5% annually
- 2000-2010: Average grade at 0.9%, declining at -2.2% annually
- 2010-2020: Average grade at 0.7%, declining at -2.8% annually
- 2020-2030E: Average grade at 0.5%, declining at -3.1% annually
These figures mandate continuous capital investment to maintain production levels. Consequently, marginal operations become uneconomic during periods of price correction, further supporting the case that copper price dips are merely temporary market adjustments.
### Project Development Timeline Constraints
New copper mine initiatives typically require 15-20 years to transition from discovery to commercial production. The extended timelines arise from necessity of exploration, detailed feasibility studies, lengthy permitting processes, and extensive construction periods. Key stages of development include:
- Exploration Phase: Approximately 3-5 years
- Feasibility Studies: Around 2-3 years including metallurgical testing
- Permitting Process: Typically 4-8 years
- Construction Period: Generally 3-5 years
- Ramp-Up to Full Production: An additional 1-2 years post-commissioning
These delays mean that current supply additions often reflect investment decisions made in previous price cycles, which reinforces long-term pricing support.
## Investment Implications and Portfolio Positioning
The current configuration of the copper market, despite intermittent fluctuations, offers a range of investment approaches tailored to varying risk tolerances and time horizons. Producer equities remain a popular avenue for investors seeking leveraged exposure, while physical metal holdings are favoured for direct commodity exposure without operational risks. Moreover, specialised instruments, such as those highlighted in a recent copper price forecast, suggest promising future trends.
### Producer Investment Analysis Framework
Investors classify opportunities into several tiers:
-
Tier 1 – Established Low-Cost Producers:
• Operational flexibility during volatility
• Consistent cash generation
• Expansion optionality -
Tier 2 – Development-Stage Projects:
• Higher leverage to price movements
• Construction and execution risks
• Long-term value realisation -
Tier 3 – Exploration Companies:
• Highest risk-reward ratios
• Discovery-driven value creation
• Suitable for speculative allocations
In addition, currency exposure and geographic diversification are critical when assessing these investments. For example, North American projects may benefit from stable regulatory environments, whereas Australian assets offer favourable infrastructure conditions.
### Risk Management Considerations
Effective strategies must address both operational and political risks. In particular, cross-border investments are impacted by exchange rate fluctuations, which can either amplify or mitigate copper price effects on profitability. Another external perspective on risk was noted in a recent global copper outlook analysis, which emphasised the importance of hedging strategies during periods of volatility.
## Technical Market Analysis and Trading Patterns
Copper futures markets demonstrate distinct technical characteristics that influence short-term price movements. These patterns are critical for timing entry and exit points, particularly when managing tactical positions. For instance, current market configurations exhibit moderate contango with longer-dated contracts trading at modest premiums relative to spot prices.
### Contango vs. Backwardation Implications
Analysts observe that the current futures curve suggests moderate contango:
- Spot to 3-month: Approximately $12,740 to $12,810 (a +0.5% premium)
- 3-month to 12-month: Approximately $12,810 to $13,150 (a +2.7% premium)
- 12-month to 24-month: Approximately $13,150 to $13,400 (a +1.9% premium)
- Long-Term Equilibrium: Estimated within $11,500-$12,500 per ton
This structure implies that market participants expect gradual supply additions to ease current tightness while maintaining a constructive long-term pricing outlook.
### Options Market Sentiment Indicators
The volatility surface indicates elevated implied volatility levels—currently around 32-35% compared to historical averages—and a put-call ratio of 1.15, suggesting neutral to slightly bearish sentiment. Such metrics reinforce the view that even though technical corrections occur, they do not undermine the long-term fundamentals that support the market. Notably, these observations align with other reports, thereby underlining that copper price dips are cyclical in nature rather than symptomatic of systemic change.
## Macroeconomic Scenario Analysis for Copper Demand
Central bank policies and broader macroeconomic conditions significantly shape copper demand. For instance, rising rates might dampen construction and manufacturing, whereas declining rates typically stimulate infrastructure investments. Analysts provide the following scenario analyses:
-
Rising Rates (Restrictive):
• GDP growth impact: -0.5% to -1.5%
• Copper demand effect: Decline in construction
• Price range estimate: $10,000-$11,500/ton -
Stable Rates (Neutral):
• GDP growth impact: +1.0% to +2.5%
• Copper demand effect: Steady industrial demand
• Price range estimate: $11,500-$13,500/ton -
Declining Rates (Stimulative):
• GDP growth impact: +2.5% to +4.0%
• Copper demand effect: Accelerated infrastructure investment
• Price range estimate: $13,500-$15,500/ton
These scenarios underscore that regional economic synchronisation fosters favourable conditions for copper demand, even as periodic corrections—and hence copper price dips—occur.
## Strategic Investment Conclusions and Risk Assessment
In summary, the current market environment combines structural supply constraints, consistent industrial demand driven by electrification, and emerging trade policies. Investors should view temporary copper price dips as opportunities rather than cause for alarm. The interplay of market fundamentals and technical dynamics supports a medium- to long-term upward price trajectory.
### Portfolio Implementation Strategy
For balanced exposure, investors might consider a diversified approach that integrates:
- 30-40% in low-cost established producer equities,
- 25-35% in development-stage projects,
- 15-25% in physical copper holdings, and
- 10-15% in exploration or speculative positions.
Such a mix addresses operational, political, and currency risks while capturing upside potential from cyclical and structural market shifts.
In conclusion, while short-term volatility and copper price dips may seem concerning, the underlying fundamentals support a robust medium-term outlook. With careful portfolio allocation and risk management strategies, investors can navigate this complex market effectively while capitalising on the long-term growth prospects within the copper sector.
Looking to Capitalise on Copper Market Volatility?
Discovery Alert's proprietary Discovery IQ model delivers real-time alerts on significant copper and mineral discoveries across the ASX, empowering subscribers to identify actionable opportunities ahead of market corrections. Explore historic examples of exceptional returns from major mineral discoveries and begin your 14-day free trial today to position yourself strategically during periods of commodity volatility.