August 10, 2026
The Physical Scarcity Era: How Copper Hits Record Highs and the Phosphate Supply Squeeze Is Rewriting the Rules of Global Commodity Markets
Commodity markets have always cycled between abundance and shortage, but the nature of those cycles matters enormously. For much of the past decade, price movements in metals and agricultural inputs were heavily influenced by speculative capital flows, central bank policy shifts, and macro sentiment. What is unfolding now is categorically different. The current period is defined not by financial positioning but by genuine physical constraints, the kind that cannot be resolved by a policy announcement or a rate cut.
When copper hits record highs and a phosphate supply squeeze simultaneously tightens the inputs that underpin global food production, it signals something structural. Understanding why these two markets are breaking down at the same time, and what connects them, is essential for anyone trying to navigate the commodity landscape in 2026 and beyond.
When big ASX news breaks, our subscribers know first
What Is Actually Driving Copper to Record Highs in 2026?
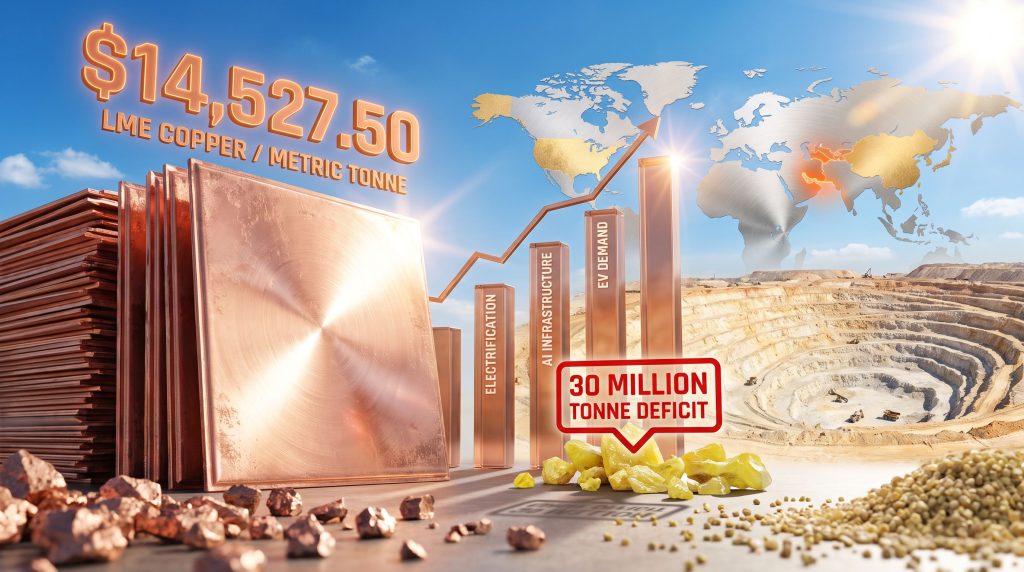
In early 2026, the London Metal Exchange copper price briefly surpassed USD $14,527.50 per metric tonne, a level that surprised even experienced commodity analysts. The International Energy Agency has placed the peak at approximately USD $14,500 per tonne, reinforcing the milestone as a genuine market event rather than a data anomaly.
The drivers behind this move are not mysterious, but their simultaneity is what makes this breakout different from previous copper record highs.
The Supply Side Is Structurally Broken
The copper mining industry has been living with a slow-building crisis for years. The key factors on the supply side include:
- The average time from copper discovery to first production spans 10 to 20 years, meaning decisions made a decade ago to under-invest in exploration are now showing up as real shortfalls
- Ore grades at major existing operations have been declining steadily, which means more rock must be processed to produce the same amount of copper, driving up per-unit extraction costs
- Unplanned production disruptions at major operations globally have repeatedly caught markets under-supplied
- The IEA has projected a potential supply deficit of approximately 30% by 2035 based on the current project development pipeline
This is not a temporary gap. It is the compounding result of years of capital allocation decisions that prioritised shareholder returns over reinvestment in new mine development. Furthermore, the copper supply crunch continues to deepen as demand accelerates across multiple sectors.
The Demand Side: Electrification, AI, and the Grid Overhaul
At the same time that supply has been constrained, demand has accelerated across multiple vectors simultaneously:
- Power grid modernisation programs across North America, Europe, and Asia require enormous copper intensity per kilometre of transmission infrastructure
- Data centre and AI infrastructure buildouts consume copper at scale, with the AI investment wave adding an entirely new demand category that did not exist in previous commodity cycles
- Electric vehicles require significantly more copper per unit than internal combustion engine vehicles, and EV adoption is accelerating across major markets
- Renewable energy installations, including wind and solar, require three to five times more copper per megawatt than conventional fossil fuel generation
| Demand Driver | Copper Intensity Implication |
|---|---|
| Grid modernisation | High per-kilometre copper content |
| Data centres and AI buildout | Structural new demand category |
| Electric vehicles | Greater copper per unit vs ICE vehicles |
| Wind and solar energy | 3x to 5x more copper per megawatt than fossil fuels |
| IEA projected deficit by 2035 | Approximately 30% shortfall on current pipeline |
Tariff Uncertainty and the Weakening US Dollar
Two additional amplifying forces have contributed to the 2026 price surge. First, uncertainty around US tariff policy has encouraged inventory accumulation by US buyers trying to front-run potential import cost increases, creating an artificial near-term demand spike. Second, a structurally weakening US dollar has made dollar-denominated commodities more attractive to international buyers, adding a currency-driven premium on top of the fundamental supply-demand imbalance. For context, CMC Markets notes that AI demand meeting a structural supply squeeze has been a defining feature of this copper cycle.
Understanding the Phosphate Supply Squeeze: Food Security at Risk
While copper grabs financial market headlines, the phosphate supply squeeze may carry more immediate humanitarian consequences. Phosphate is a non-negotiable input in modern agriculture. Without it, crop yields fall. Without adequate crop yields, food prices rise. The current disruption is not a minor logistics issue; it is a convergence of multiple simultaneous supply shocks.
What is the phosphate supply squeeze? The global phosphate supply squeeze refers to a tightening of phosphate fertiliser availability driven by sulfur input shortages, geopolitical shipping disruptions, Chinese export restrictions, and production curtailments at major producers. Because sulfuric acid derived from elemental sulfur is the critical reagent in converting phosphate rock into usable fertiliser, sulfur bottlenecks translate directly into reduced phosphate output, threatening agricultural productivity globally.
Sulfur: The Hidden Chokepoint Nobody Is Talking About
Sulfur occupies a largely invisible but absolutely critical position in global food supply chains. Most people understand that phosphate fertilisers are important for crop production, but fewer appreciate that producing usable phosphate fertiliser requires vast quantities of sulfur to process phosphate rock through a sulfuric acid conversion process. Disrupt sulfur supply and you disrupt phosphate production, regardless of how much phosphate rock is available in the ground.
Current sulfur supply chains face disruption from multiple directions:
- Strait of Hormuz shipping constraints linked to ongoing Middle East geopolitical tensions have materially reduced sulfur flows from major Gulf producers
- Kazakhstan export blockades have interrupted Central Asian sulfur flows that historically served as a significant market buffer
- Elevated spot sulfur prices have squeezed producer margins across the industry to the point where continued production becomes uneconomic
This is a genuinely underappreciated market dynamic. The sulfur-phosphate link means that geopolitical events in the Middle East and Central Asia are not just energy market stories; they are agricultural market stories with direct implications for global food security. Indeed, phosphate project developments in Australia are attracting renewed investor attention as supply constraints persist.
Mosaic's Production Curtailments: The Numbers Behind the Headlines
Mosaic Company, one of the world's largest phosphate producers, responded to these input cost pressures by curtailing output across its US and Brazilian operations. The scale of those curtailments is significant:
| Mosaic Facility | Operational Status |
|---|---|
| Louisiana Plant | Fully idled |
| Bartow Facility, Florida | Operating at approximately 40% capacity |
| Other Central Florida Plants | Running in the mid-70% range |
| Brazil Operations | Curtailed in response to input costs |
| Potential Global Phosphate Shortfall | Up to 30 million tonnes if sulfur constraints persist |
Mosaic's leadership indicated during its Q2 earnings discussions that global phosphate production could fall short by as much as 30 million tonnes if sulfur supply constraints do not normalise. Having a Louisiana facility completely idled represents an immediate and substantial reduction in North American phosphate production capacity, not a theoretical future risk.
The Geopolitical Web Behind Phosphate Scarcity
The phosphate market's vulnerability is amplified by the geographic concentration of supply:
- China's export restrictions on phosphate products have reduced global availability from one of the world's dominant producing nations
- Russian supply limitations have further constrained a historically significant source, particularly for European agricultural markets
- Shipping disruptions through the Strait of Hormuz have elevated freight costs and reduced supply reliability from Middle Eastern producers
- The combination of these simultaneous disruptions has consumed the market buffers that historically absorbed individual supply shocks
Climate Volatility: The Overlooked Amplifier
Adding another layer of complexity, climate volatility is beginning to intersect with agricultural commodity supply chains in ways that compound the damage from structural supply disruptions. Southern England recorded its driest July on record in 2025, a data point that illustrates how weather extremes are no longer isolated events but recurring variables that agricultural planners must account for.
The cruel irony is that drought conditions across key agricultural regions increase fertiliser demand precisely when supply is most constrained. Stressed crops require more intensive nutrient management. When phosphate is both expensive and scarce, farmers face a compressing margin squeeze that ultimately flows through to food prices globally.
The Gold Lag Theory: What Copper's Record Highs Signal for Precious Metals
One of the most strategically important insights emerging from this copper breakout is what it historically implies for gold. The relationship between the two metals across commodity supercycles reveals a consistent pattern: copper tends to lead the repricing of the entire commodity complex, while gold characteristically lags before staging a sharp catch-up move.
The Copper-Gold Divergence Thesis: When copper breaks to record levels on the basis of industrial demand and physical supply tightness, it effectively reprices the physical economy. Gold's lag phase reflects the time required for currency debasement pressures, sovereign debt dynamics, and rising physical production costs to reassert the monetary premium embedded in gold pricing. Historically, that lag has represented a strategic accumulation window.
The logic runs as follows: copper reprices the physical world first because its demand signals are tangible and immediate. The gold price outlook suggests gold's repricing comes later, once the monetary consequences of commodity inflation, government spending pressures, and currency debasement collide with market awareness. Investors who understand the typical sequence of this pattern have historically found value in rotating toward gold exposure during the copper breakout phase, before the catch-up move materialises.
| Indicator | Copper Signal | Gold Implication |
|---|---|---|
| Industrial demand | Structurally elevated | Lagging but historically follows |
| Supply deficit | Confirmed and widening | Production costs rising |
| Sovereign demand | Government procurement accelerating | Central bank accumulation ongoing |
| Currency debasement risk | Amplifying commodity prices broadly | Monetary premium not yet fully priced |
Sovereign Capital and the Ex-China Supply Chain Race
Governments across the Western world are increasingly concluding that market forces alone will not build the critical mineral supply chains that energy transition and national security objectives require. Western export credit agencies, including the US Export-Import Bank, are actively deploying capital into critical mineral projects spanning graphite, rare earths, and strategic metals, with the explicit objective of building viable alternatives to Chinese processing and production dominance.
This is a meaningful structural development. Sovereign-backed financing functions as a de-risking mechanism, lowering the threshold for institutional capital to follow into projects that would otherwise struggle to secure commercial debt at competitive rates.
However, a critical distinction exists between capital pledges and capital deployed. From a market perspective, the current environment remains a watch-and-wait phase. Large debt facility announcements generate significant headlines, but institutional investors are monitoring whether those pledged funds actually reach active drilling programs, produce secured offtake agreements, and translate into real production timelines.
The variables that matter for sovereign-backed programs include:
- Actual drawdown rates on announced facilities versus headline commitment sizes
- Offtake agreement execution with end-users in battery, defence, and energy sectors
- Transition speed from feasibility and study phases to construction and first production
- Geopolitical stability of host jurisdictions receiving investment
The next major ASX story will hit our subscribers first
Grassroots Exploration: The Only Real Answer to the Copper Deficit
The 10 to 20-year discovery-to-production timeline means that even today's record copper prices cannot produce new mine supply quickly. The supply response to current price signals will arrive, but it will arrive on a geological timeframe, not a financial market timeframe.
Exploration activity in proven copper-gold geological terrains is therefore a necessary precondition for closing the projected 30% supply deficit the IEA has forecast by 2035. Australia's Lachlan Fold Belt is recognised internationally as one of the premier copper-gold exploration terrains globally. Historic mining districts across Queensland, including the Mount Morgan district, represent proven high-grade copper-gold systems that are being revisited with modern geophysical techniques capable of identifying deeper or previously overlooked mineralisation.
The significance of high-grade rock chip results, such as grades exceeding 4.2% copper and 0.5 grams per tonne gold, at early-stage exploration projects within these established geological belts, illustrates the quality of targets being pursued. For context, copper mineralisation above 1% is generally considered economically interesting at current prices; grades above 4% represent genuinely exceptional near-surface enrichment that warrants serious follow-up work.
Junior exploration companies occupy the highest-risk, highest-optionality segment of the copper supply response. Proof-of-concept drilling in established mineral belts is the first step in a long chain that eventually leads to resource definition, feasibility studies, financing, and production. The sovereign and institutional capital that follows at later project stages requires early-stage grassroots success to have occurred first.
Frequently Asked Questions: Copper Record Highs and the Phosphate Supply Squeeze
Why did copper hit record highs in 2026?
Copper surpassed USD $14,500 per tonne on the LME in early 2026, driven by structural mine supply deficits, strong industrial demand from electrification programs and AI infrastructure development, US tariff-driven inventory accumulation, and a weakening US dollar amplifying commodity prices for international buyers.
What is causing the global phosphate supply squeeze?
The squeeze stems from multiple simultaneous disruptions including sulfur shortages caused by Strait of Hormuz shipping constraints and Central Asian export blockages, Chinese export restrictions on phosphate products, Russian supply limitations, and direct production curtailments by major producers responding to uneconomic input costs.
How large could the phosphate deficit become?
Industry estimates based on major producer commentary suggest the global phosphate market could face a shortfall of up to 30 million tonnes if sulfur supply constraints persist through the current disruption cycle.
What does the IEA forecast for copper supply?
The International Energy Agency has projected that the copper market faces a potential supply deficit of approximately 30% by 2035, reflecting the structural gap between accelerating electrification-driven demand and constrained new mine supply from a severely under-invested project pipeline. Investors exploring copper investment strategies should factor this long-range deficit into their positioning decisions.
Why does copper's performance matter for gold investors?
Copper historically leads commodity supercycles by repricing the physical economy first. Gold tends to lag this breakout before staging a sharp catch-up move as currency debasement, sovereign debt pressures, and rising physical production costs reassert gold's monetary premium. The lag phase has historically represented a strategic positioning window. According to The Wall Street Journal, fears of a global supply squeeze have been central to this dynamic.
Key Variables to Monitor Across Both Markets
For Copper Investors
- Mine disruption frequency at major global operations
- LME and COMEX inventory levels as real-time supply indicators
- US tariff policy evolution and its impact on inventory positioning behaviour
- Junior exploration drilling results in Tier 1 copper belts
- Sovereign procurement program pace and execution against announced commitments
For Phosphate and Agricultural Commodity Investors
- Sulfur spot prices and supply chain normalisation timelines
- Strait of Hormuz shipping status and freight cost trajectories
- Chinese phosphate export policy and any quota adjustments
- Mosaic and peer producer capacity utilisation rates as real-time output indicators
- Agricultural demand seasonality interacting with constrained supply windows
Three Structural Takeaways for Investors in 2026
The convergence of record copper prices and an acute phosphate supply squeeze in the same market environment is not coincidental. Both reflect the same underlying dynamic: a physical economy that has been under-invested relative to accelerating demand, now running headlong into the limits of what existing supply infrastructure can deliver.
- Supply deficits are structural, not cyclical. Both the copper and phosphate markets are experiencing multi-year supply-demand imbalances rooted in underinvestment and compounding geopolitical disruption, not temporary price spikes.
- Sovereign capital is accelerating but execution risk remains elevated. Government pledges to secure critical mineral supply chains are strategically meaningful but must be evaluated by actual production outcomes rather than announcement headlines.
- The physical economy is reasserting itself as the dominant investment theme. From fertiliser inputs to copper wiring, real-world material constraints are increasingly driving asset prices more powerfully than speculative positioning.
For investors constructing portfolios across the commodity complex, diversified exposure spanning copper, phosphate-adjacent opportunities, and precious metals may offer more resilient positioning than single-commodity concentration. The copper-gold lag dynamic rewards patient positioning, while grassroots exploration in proven geological terrains offers asymmetric upside for investors willing to accept the long investment horizon that the discovery-to-production cycle demands.
This article is intended for informational purposes only and does not constitute financial product advice. Commodity markets carry significant risk, and past price patterns do not guarantee future performance. Readers should seek independent financial advice before making investment decisions. Forward-looking projections referenced throughout, including IEA supply deficit forecasts and producer capacity estimates, represent current industry analysis and are subject to material change.
Want to Identify the Next Major Copper or Critical Mineral Discovery Before the Market Does?
Discovery Alert's proprietary Discovery IQ model delivers real-time alerts the moment significant ASX mineral discoveries are announced, turning complex geological and commodity data into clear, actionable opportunities — whether you're tracking the copper supply deficit, phosphate-adjacent plays, or precious metals positioning. Explore historic discoveries and the returns they generated, then begin your 14-day free trial to ensure you're positioned ahead of the broader market.