July 23, 2026
The Copper Intensity Problem Nobody Is Talking About
Most commodity analysts understand copper as a cyclical metal, one that rises with construction booms and falls when manufacturing contracts. That mental model worked reasonably well for most of the twentieth century. It is becoming increasingly unreliable in the 2020s. What has changed is not copper itself but the nature of the systems that depend on it. The emergence of AI infrastructure as a primary demand driver has introduced a fundamentally different buyer into the copper market. Understanding why the Grupo Mexico copper shortfall on AI demand forecast matters requires stepping back from the headline and examining the structural architecture beneath it.
When big ASX news breaks, our subscribers know first
Why Three Demand Shocks Arriving Simultaneously Changes Everything
Commodity markets are reasonably well-equipped to absorb a single large demand shock. Supply chains adjust, inventories buffer the transition, and price signals eventually attract new investment. What they struggle with, however, is simultaneous, overlapping shocks drawing from the same constrained resource pool.
That is precisely the condition copper faces heading into the second half of this decade. Three structurally distinct demand vectors are scaling at the same time:
- AI infrastructure buildout, driven by hyperscaler capital expenditure commitments that extend five to seven years forward
- Electric vehicle manufacturing, which requires approximately 2.5 to 4 kilograms of copper per vehicle compared to roughly 1 kilogram in a conventional internal combustion engine car
- Grid modernisation and renewable energy integration, which demands copper-intensive transformer upgrades, transmission line extensions, and substation expansions across every major economy
Sequential demand shocks allow supply pipelines time to respond. Simultaneous ones do not. The 10 to 15 year development timeline from copper discovery to first commercial production means that even a price signal sent today cannot translate into meaningful new supply before approximately 2031 at the earliest. The market is being asked to serve three growing masters from a supply base that cannot materially expand within the relevant planning horizon.
How AI Data Centres Became the Most Copper-Intensive Infrastructure Category
The copper intensity of AI-optimised data centres is not well understood outside specialist circles, and this informational gap is distorting how the broader market assesses the demand trajectory.
Conventional data centres, the server farms that have housed enterprise computing for the past two decades, consume significant copper but within predictable and relatively modest bounds. AI-specific facilities are categorically different. The shift to GPU-dense, high-power-density computing environments fundamentally alters the infrastructure requirements at every layer of the facility stack.
What Does the Copper Consumption Pathway Look Like?
Consider the copper consumption pathway within a single AI data centre campus:
- Grid connection infrastructure: high-voltage transmission lines and switchgear connecting to the national grid
- Transformer banks: step-down equipment converting transmission voltage to facility-level power, highly copper-intensive per unit
- Internal power distribution: busbars, cable trays, and distribution panels running throughout the building footprint
- Cooling systems: liquid cooling loops and heat exchange networks, which in AI facilities can account for a disproportionate share of total copper load given the thermal output of GPU clusters
- Server rack wiring and interconnects: direct copper connections between compute nodes, storage arrays, and networking equipment
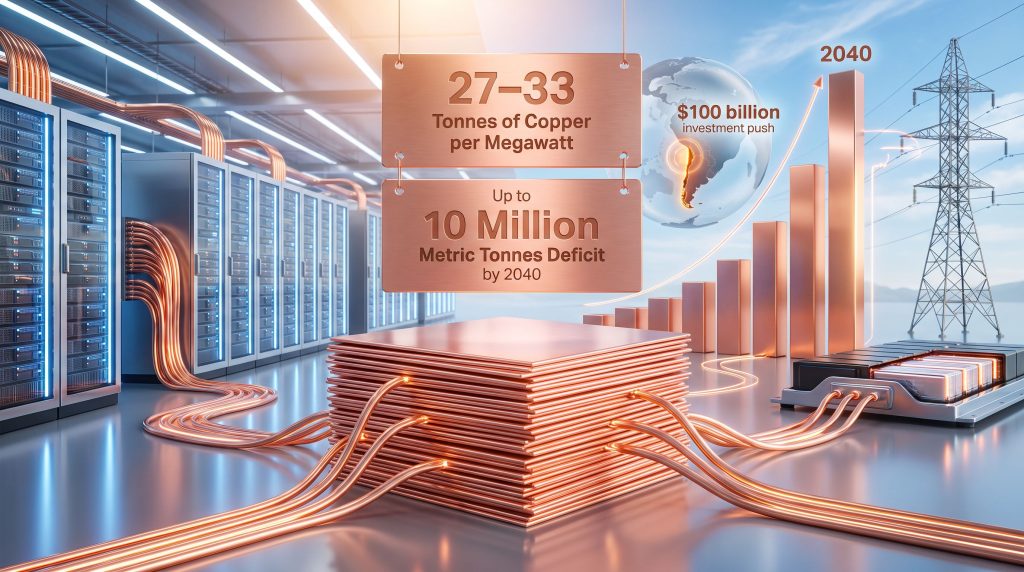
The aggregate effect of these layers is substantial. Industry research estimates that AI-optimised data centres require approximately 27 to 33 tonnes of copper per megawatt of installed capacity, a figure that meaningfully exceeds the copper intensity of conventional data centre construction. A single 100 MW AI campus could therefore require between 2,700 and 3,300 tonnes of copper for the build phase alone, roughly equivalent to the annual copper consumption of a mid-sized industrial city.
AI and data-centre copper demand is projected to average approximately 400,000 tonnes per year over the next decade, according to industry research. This represents a structurally new demand category that did not exist at meaningful scale five years ago. (Source: BloombergNEF-aligned market research)
What the Grupo Mexico Deficit Forecast Actually Signals
When the head of mining operations at one of Latin America's largest copper producers describes a supply-demand imbalance publicly, the market should interpret that commentary through two lenses simultaneously: the informational and the strategic.
On the informational side, major integrated producers have visibility into both their own output schedules and broader market inventory levels that independent analysts can only approximate. A forecast of even a mild deficit from an operator of this scale carries weight precisely because it reflects ground-level knowledge of pipeline deliveries, smelter throughput, and customer offtake agreements.
On the strategic side, producer guidance on supply-demand balance directly influences futures market positioning, downstream buyer procurement strategies, and analyst consensus models. The framing of the deficit as mild is also worth examining critically. A mild near-term imbalance, when compounded across a multi-year trajectory with no realistic supply response mechanism within the relevant window, can evolve into a severe structural shortfall.
The financial context reinforces the directional read. Grupo Mexico reported a 79% jump in second-quarter net profit for the period ending mid-2026, driven primarily by elevated copper prices. When a producer reports record profitability while simultaneously flagging supply tightness, the market signal is internally consistent: this is a seller's market, and the operator understands the conditions sustaining it. Furthermore, understanding the copper supply crunch in its broader context helps explain why producer confidence remains elevated even amid cautious public commentary.
Quantifying the Gap: Supply, Demand, and the Numbers That Matter
| Demand Driver | Estimated Annual Copper Requirement | Time Horizon |
|---|---|---|
| AI Data Centres (global buildout) | ~400,000 tonnes/year average | 2025 to 2035 |
| Electric Vehicle Manufacturing | Growing proportionally with EV adoption | Near to medium term |
| Grid Modernisation and Renewables | Multi-year capital programmes globally | 2025 to 2040 |
| Traditional Industrial Demand | Baseline consumption, relatively stable | Ongoing |
| Cumulative Projected Shortfall | Up to 10 million metric tonnes | By 2040 |
Sources: BloombergNEF-aligned market research; S&P Global commodity analysis
The inventory dimension amplifies these figures in ways that aggregate deficit numbers do not capture. Copper warehouse stocks held at major exchanges have been running at historically constrained levels. When physical inventories are thin, even a modest supply-demand imbalance can produce disproportionate price responses. Markets operating on thin inventory cushions react sharply, and the current inventory environment suggests the latter dynamic is more likely than the former.
Why Supply Cannot Self-Correct Within the Relevant Timeframe
The supply-side constraint in copper is not primarily a question of geology. Identified copper resources globally are substantial. The constraint is developmental: bringing identified resources into production requires navigating a sequence of steps that compress into no less than a decade under the most favourable conditions.
What Are the Critical Friction Points?
The critical friction points include:
- Permitting timelines in major producing jurisdictions that can extend five to eight years before a shovel enters the ground
- Community and environmental opposition in copper-rich regions of Latin America and sub-Saharan Africa, where water rights disputes have become a recurring operational constraint
- Capital allocation cycles that require sustained high copper prices to justify the multibillion-dollar commitments needed for large greenfield projects
- Refining capacity bottlenecks that create market tightness independent of mining output, since mined copper concentrate must pass through smelting and refining before it becomes usable cathode
Chile, the world's largest copper-producing nation, is pursuing a $100 billion investment programme designed to expand output and diversify its customer base. This signals both the scale of opportunity the industry perceives and the urgency of the supply response challenge. In addition, copper project partnerships between majors and junior miners are increasingly viewed as one mechanism to accelerate the pipeline of developable assets within constrained timelines.
The next major ASX story will hit our subscribers first
Three Scenarios for the Copper Market Through 2040
| Scenario | Key Assumptions | Estimated Deficit by 2040 |
|---|---|---|
| Base Case | Moderate AI growth, steady EV adoption, limited new mine supply | 5 to 7 million metric tonnes |
| Accelerated Demand | Rapid AI scaling, aggressive EV mandates, grid modernisation at pace | Up to 10 million metric tonnes |
| Supply Response | Major new mines online, recycling scales, demand efficiency improves | Deficit narrows to 2 to 3 million metric tonnes |
The supply response scenario deserves particular scrutiny. Copper recycling, often cited as the demand-side relief valve, faces a structural ceiling. Current global recycling rates recover a meaningful proportion of end-of-life copper, but the total available secondary supply is constrained by the volume of copper previously installed in existing infrastructure. The multi-million tonne structural gap visible in base and accelerated demand scenarios is unlikely to be closed by secondary supply alone within a single decade.
How Copper's Price Signal Is Decoupling From Traditional Economic Indicators
Copper has long been described as the commodity with a PhD in economics, its price movements historically correlating with global manufacturing activity, construction starts, and broader GDP trends. That correlation is becoming less reliable as a predictive framework, and consequently, analysts are revisiting long-held assumptions about how to interpret copper price signals.
AI-driven copper demand does not respond to the same macro inputs as traditional industrial demand. Hyperscaler capital expenditure commitments on data centre infrastructure are driven by competitive dynamics within the technology sector, not by housing market conditions or factory utilisation rates. When a major cloud provider commits to a five-year data centre buildout programme, that copper demand is effectively locked in regardless of short-term economic fluctuations.
This decoupling has implications for macro analysts who use copper prices as a leading indicator. A rising copper price in the current environment may signal technology sector investment intensity rather than broad economic expansion. For instance, understanding the broader copper price growth drivers at play in 2025 reveals how structurally different this cycle is from previous commodity booms driven by construction and manufacturing.
Unlike demand from construction or consumer goods, which fluctuates with economic cycles, AI infrastructure spending is driven by multi-year capital commitments from hyperscalers, creating a more durable and predictable demand floor.
Furthermore, the energy transition minerals conversation sits directly alongside this debate, as copper's centrality to both grid decarbonisation and digital infrastructure makes it uniquely exposed to two of the most powerful structural themes of the coming decade.
Frequently Asked Questions: Copper Deficit and AI Demand
What Is Causing the Copper Shortfall in 2026?
The 2026 copper deficit reflects the convergence of three simultaneous demand drivers: AI infrastructure construction, electric vehicle manufacturing scale-up, and grid modernisation programmes tied to renewable energy integration. These are occurring against a backdrop of constrained mine supply, extended development timelines, and historically low warehouse inventory levels.
How Much Copper Does an AI Data Centre Use?
Industry research estimates that AI-optimised data centres consume approximately 27 to 33 tonnes of copper per megawatt of installed capacity, significantly exceeding the copper intensity of conventional data centre construction due to higher power density, more extensive cooling infrastructure, and greater interconnect requirements.
How Large Could the Global Copper Deficit Become by 2040?
Under an accelerated demand scenario, the cumulative shortfall could reach up to 10 million metric tonnes by 2040 if supply expansion does not meaningfully accelerate. Even a base case scenario projects a deficit of 5 to 7 million metric tonnes over the same period.
Is the Copper Deficit Good or Bad for Investors?
A structural deficit environment is broadly constructive for copper producers, supporting elevated prices and strong margins as demonstrated by Grupo Mexico's 79% profit increase in Q2 2026. However, risk factors include potential demand destruction at sustained high price levels, technological substitution in specific applications, and policy intervention in copper supply chains. Those exploring copper investment strategies should conduct independent due diligence and consider that commodity price forecasts carry inherent uncertainty.
How Does AI Copper Demand Compare to EV Copper Demand?
These are additive rather than competing demand vectors, both drawing from the same constrained supply pool. AI infrastructure is emerging as the faster-growing new demand category given the capital intensity of GPU-dense facilities, while EV demand continues to scale proportionally with vehicle adoption rates. Together, they represent a compounding demand dynamic that has no historical precedent in copper markets. According to BloombergNEF, this convergence of technology-driven demand sources is reshaping long-term commodity forecasting models across the industry.
Key Takeaways
- 2026 represents a transitional inflection point, with AI infrastructure joining EVs and grid decarbonisation as a structurally significant copper demand driver
- AI data centres are disproportionately copper-intensive, consuming an estimated 27 to 33 tonnes per megawatt, a characteristic not widely understood outside specialist circles
- The 10 to 15 year mine development cycle means today's price signals cannot unlock meaningful new supply before the early 2030s at the earliest
- Thin inventory levels amplify tightness, creating conditions for price volatility rather than gradual appreciation even when the nominal deficit is described as mild
- The long-term deficit trajectory, potentially reaching 10 million metric tonnes by 2040, represents one of the most significant commodity supply-demand imbalances currently visible in global markets
- Producer profitability already reflects the tightening market, with Grupo Mexico copper shortfall on AI demand commentary arriving alongside a 79% net profit increase, providing real-time confirmation of the supply-demand dynamic
The S&P Global Commodity Insights platform remains one of the most widely referenced sources for tracking evolving copper supply-demand modelling across these scenarios.
This article contains forward-looking analysis based on third-party market research and publicly available producer guidance. Commodity market forecasts are inherently uncertain and should not be construed as financial advice. Readers should conduct independent research before making investment decisions.
Want to Capitalise on the Next Major Copper Discovery Before the Broader Market?
Discovery Alert's proprietary Discovery IQ model scans ASX announcements in real time, instantly identifying significant mineral discoveries — including copper — and delivering actionable alerts to subscribers before the broader market can react. Start your 14-day free trial at Discovery Alert today, or explore the historic returns that major ASX mineral discoveries have generated to understand what early positioning can mean for a portfolio.