June 4, 2026
The global metals market operates through complex interconnections where supply chain vulnerabilities often manifest as sudden price dislocations across seemingly unrelated geographic regions. When industrial demand contracts simultaneously across major manufacturing economies, traditional commodity pricing models suggest metal prices should decline accordingly. However, New York copper prices in late 2025 demonstrate how geopolitical uncertainty and trade policy speculation can completely override fundamental supply-demand dynamics, creating market conditions where scarcity and abundance coexist within the same copper supply crunch system.
Understanding the Copper Supply-Demand Imbalance
Market analysts define a copper supply crunch through specific threshold indicators that measure both absolute scarcity and relative distribution inefficiencies. The most critical metric involves exchange inventory levels falling below operational minimums, combined with processing fee structures that indicate raw material scarcity throughout the production chain.
Key Threshold Indicators:
- LME inventory depletion: Stock levels below 100,000 metric tons trigger automatic supply alerts
- Processing fee inversion: Treatment charges moving into negative territory indicate concentrate shortages
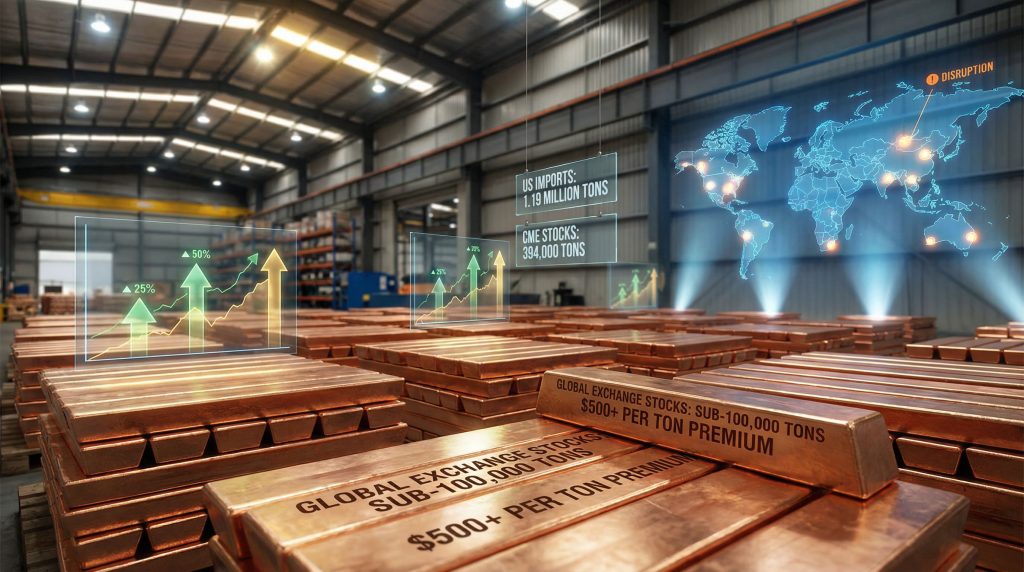
- Physical premium escalation: Delivery premiums exceeding $300-400 per ton signal distribution bottlenecks
- Forward curve distortion: Backwardation patterns indicating near-term scarcity expectations
Current market conditions demonstrate these stress indicators across multiple metrics simultaneously. LME copper stocks dropped below the critical 100,000-ton threshold for the first time since July 2025, triggered by a massive inventory withdrawal of 54,350 tons representing approximately one-third of registered stock. This withdrawal pattern suggests coordinated physical demand rather than speculative positioning.
The copper supply crunch manifests differently across geographic regions, creating what market participants describe as parallel commodity universes. While total global exchange inventory actually increased above 700,000 tons in November 2025, the highest level since early 2020, this aggregate figure masks severe regional imbalances.
Processing economics provide additional insight into supply chain stress. Smelter treatment charges, which represent core profitability metrics for copper refiners, have traded at negative levels for consecutive months through 2025. This unprecedented condition forces smelters to pay miners for the privilege of processing concentrate, effectively inverting normal market relationships.
Critical Supply Metrics (December 2025):
| Metric | Current Level | Historical Range | Status |
|---|---|---|---|
| LME Stocks | <100,000 tons | 150,000-400,000 tons | Critical |
| Global Exchange Total | 700,000+ tons | 300,000-600,000 tons | Elevated |
| Spot Treatment Charges | Negative | $50-150/ton | Inverted |
| US Physical Premium | $500/ton | $50-200/ton | Extreme |
The supply-demand imbalance reflects structural changes in global copper flow patterns rather than absolute shortage conditions. Furthermore, manufacturing activity contracted across China, Japan, Europe, and the United States during September 2025, with the US experiencing its ninth consecutive month of manufacturing contraction. Despite weakening industrial demand, copper prices continued reaching record highs, indicating non-fundamental price drivers.
When big ASX news breaks, our subscribers know first
Why Are Global Copper Markets Fracturing?
Geographic market segmentation has created distinct copper pricing zones operating under different supply-demand dynamics, effectively splitting what was historically a unified global commodity market. In addition, the United States has positioned itself as what industry analysts call the market of first resort for copper, driven primarily by tariff uncertainty rather than underlying consumption patterns.
US Market Transformation:
The American copper market experienced dramatic structural changes throughout 2025, fundamentally altering global metal flows. US refined copper imports more than doubled year-over-year to 1.19 million tons during January-August 2025, representing the most significant import surge in decades. This import acceleration occurred despite contracting manufacturing activity, indicating strategic stockpiling behaviour.
CME copper inventory levels provide the clearest evidence of this transformation. Stocks increased from 85,000 tons at the beginning of 2025 to 394,000 tons by December, representing a 363% increase. More significantly, CME inventory now accounts for 55% of total global exchange inventory, a concentration level not seen historically.
Regional Premium Structure (2026 Contracts):
| Region | Premium Level | Year-over-Year Change | Market Driver |
|---|---|---|---|
| United States | $500+ per ton | +150% estimate | Tariff uncertainty |
| Europe | $345 per ton | +39% (Codelco) | Supply redirection |
| China | $350 per ton | +40% estimate | Secondary priority |
| Global Average | $375 per ton | +60% estimate | Market fragmentation |
The geographic arbitrage mechanism sustaining these price differentials operates through tariff policy uncertainty. A decision on extending copper product tariffs to refined metal was deferred until mid-2026, creating a prolonged period of policy ambiguity. Consequently, this uncertainty incentivises copper accumulation within US borders as insurance against potential import restrictions.
Chinese market participation adds complexity to the fragmentation pattern. Despite being the world's largest copper consumer, China finds itself in an unfamiliar position as secondary priority in the global delivery queue. Chinese bonded warehouse zones have participated in the arbitrage opportunity, re-exporting 128,000 tons to the United States since February 2025 according to customs data.
Chinese Copper Flow Patterns:
- Re-export activity: 128,000 tons from bonded zones to US markets
- LME delivery increase: Chinese-brand copper representing 82% of LME stocks by October 2025
- Market share shift: Up from 51% Chinese copper in LME warehouses at January start
- Arbitrage positioning: Chinese producers capturing CME-LME premium spreads
The forward curve structures on CME versus LME exchanges illustrate this market fracture quantitatively. CME copper trades in comfortable contango, with forward prices higher than spot prices, indicating perceived abundance in the US market. Simultaneously, LME copper exhibits widening backwardation, where near-term prices exceed forward contracts, signalling scarcity expectations for non-US markets.
This parallel pricing structure creates a sustainable arbitrage opportunity as long as the CME premium exceeds shipping costs. At approximately $500 per ton on a three-month forward basis, the premium comfortably covers international shipping expenses, maintaining economic incentives for continued metal flows toward US inventory.
What's Driving the Smelting Crisis?
The global copper smelting industry faces an unprecedented profitability crisis stemming from fundamental capacity-supply misalignment rather than cyclical market fluctuations. Chinese smelter expansion has outpaced global mine production capacity, creating unsustainable processing economics that threaten industry structure.
Capacity Expansion Mismatch
China's rapid smelting capacity additions over recent years created processing capability that exceeds available concentrate supply from global mining operations. This overexpansion compounds the impact of mining disruptions, as reduced concentrate availability spreads across an enlarged processing base, intensifying competition for raw materials.
The smelting crisis manifests through processing fee inversion, where treatment charges have moved into negative territory for sustained periods. However, this economic inversion forces smelters to pay miners for concentrate access rather than receiving payment for processing services, eliminating core revenue streams and threatening operational viability.
Processing Fee Crisis Indicators:
- Spot market conditions: Negative treatment charges persisting for months
- Annual contract pressure: 2026 negotiations facing potentially negative fee structures
- Western facility closures: Multiple smelters shuttering operations due to unsustainable economics
- Chinese industry response: Coordinated production reduction pledges to stabilise market conditions
The China Smelters Purchase Team, comprising the country's ten largest smelting producers, announced coordinated production reductions of 10% to address raw material market dysfunction. This collective response includes monitoring member spot market activities to prevent what industry participants termed malignant competition between smelters for concentrate access.
Nevertheless, historical precedent suggests scepticism regarding implementation effectiveness. Collective cutback announcements represent standard operating procedure for Chinese metal smelters during challenging market conditions, but actual impact has frequently fallen short of promised reductions.
Smelting Industry Restructuring Risks
The current annual benchmark pricing model faces splintering into multiple short-term and binary deals under market pressure, according to industry analysis.
This pricing system fragmentation introduces additional uncertainty into copper market dynamics, potentially replacing standardised long-term contracts with complex bilateral arrangements. Such structural changes would reduce pricing transparency and increase transaction costs across the copper supply chain.
Global Smelter Response Patterns:
| Region | Response Strategy | Timeline | Effectiveness Risk |
|---|---|---|---|
| China | 10% production cuts | 2025-2026 | Historical underdelivery |
| Europe | Facility closures | Ongoing | Permanent capacity loss |
| North America | Operational reviews | 2025 | Selective optimisation |
| Other | Market monitoring | Ongoing | Limited coordination |
The smelting crisis also reflects broader supply chain vulnerabilities. Mining disruptions at major operations, including issues at Indonesia's Grasberg facility, compound concentrate scarcity by reducing available raw materials for an oversized processing sector. This creates amplified impact from individual mine disruptions across the global smelting network.
Western smelter closures represent permanent capacity reduction rather than temporary operational adjustments, indicating structural rather than cyclical industry challenges. These closures concentrate processing capability within Chinese facilities, increasing geographic concentration risk within the copper supply chain.
How Are Mining Disruptions Amplifying Supply Constraints?
Mining sector disruptions during 2025 have created cascading effects throughout the copper supply chain, amplifying concentrate scarcity and intensifying competition among oversized smelting capacity. The year's disruption pattern affects some of the world's largest copper mining operations, creating disproportionate impact on global supply availability.
Major Disruption Impacts
Indonesia's Grasberg mine, among the world's largest copper operations, experienced operational disruptions that reduced concentrate supply to global smelters. As part of what industry participants describe as 2025's extensive disruption catalogue affecting major mining operations worldwide, these interruptions compound existing processing capacity imbalances.
The disruption impact extends beyond immediate production losses due to the copper mining industry's concentrated structure. For instance, a relatively small number of large-scale operations provide significant portions of global concentrate supply, meaning individual facility disruptions create outsized market effects.
Ore Grade Deterioration Trends
Historical copper ore grade decline represents a long-term structural challenge affecting mining productivity. Average copper ore grades have decreased from historical ranges of 1-2% copper content to current levels below 0.7%, requiring substantially increased ore processing volumes to maintain equivalent copper output.
This grade decline creates multiple operational challenges:
- Increased mining volumes: Lower grades require processing 2-3 times more ore for equivalent copper recovery
- Energy intensity escalation: Additional processing demands significantly higher energy consumption per ton of copper produced
- Environmental impact multiplication: Greater waste rock generation and processing chemical requirements
- Capital requirement increases: Larger-scale operations necessary to maintain production levels
Mining Industry Productivity Metrics:
| Factor | Historical Range | Current Average | Trend Impact |
|---|---|---|---|
| Ore Grade | 1.0-2.0% copper | <0.7% copper | Declining productivity |
| Energy per Ton | 15-20 MWh | 25-30 MWh | Rising operational costs |
| Waste Ratio | 2:1 | 4:1 | Environmental pressure |
| Capital Intensity | $3-5B per mine | $8-12B per mine | Development barriers |
Permitting and Development Delays
New mine development faces extended approval timelines due to increased regulatory scrutiny and community consultation requirements. Environmental impact assessments now require comprehensive analysis of water usage, emissions, biodiversity effects, and long-term land rehabilitation plans.
These extended development cycles create supply pipeline constraints, as new capacity additions lag behind depletion at existing operations. The typical timeline from discovery to production now extends 15-20 years for major copper developments, compared to historical timelines of 10-12 years.
Geopolitical Supply Chain Risks
Resource nationalism trends in copper-producing regions create additional uncertainty for global supply chains. Governments in major producing countries increasingly view copper resources as strategic assets, implementing policies that prioritise domestic value addition and limit raw material exports.
Trade route uncertainties add another layer of supply chain vulnerability. Transportation bottlenecks, port congestion, and shipping capacity constraints create additional friction in global copper distribution, amplifying the impact of regional supply disruptions.
The combination of mining disruptions, declining ore grades, and extended development timelines creates a structural supply constraint that compounds cyclical market imbalances. This convergence of factors contributes to sustained pressure on copper availability, independent of immediate demand conditions.
What Are the Long-Term Supply Trajectory Scenarios?
Long-term copper supply projections involve complex interactions between technological advancement, regulatory evolution, and demand transformation driven by global energy transition initiatives. Multiple scenario pathways exist depending on policy responses, investment flows, and technological breakthrough timelines, as outlined in the global copper production forecast.
Scenario 1: Gradual Market Rebalancing (2026-2028)
This pathway assumes successful resolution of current supply chain disruptions through coordinated industry response and policy stabilisation. New mine development projects advance through permitting processes, while recycling infrastructure expansion provides additional supply sources.
Key assumptions include:
- Capital mobilisation: Estimated $500+ billion in mining sector investment over the projection period
- Technology adoption: AI-driven optimisation and improved extraction methods reducing operational costs
- Recycling scale-up: Urban mining and electronic waste processing contributing 25-30% of supply by 2028
- Regulatory streamlining: Reduced permitting timelines for strategically important projects
Scenario 2: Structural Deficit Persistence (2025-2030)
This scenario projects sustained copper shortage conditions driven by accelerating energy transition demand outpacing supply additions. Electric vehicle adoption, renewable energy infrastructure, and industrial electrification create unprecedented copper consumption growth.
Critical factors include:
- Demand acceleration: Energy transition potentially driving 100% copper demand growth by 2035
- Supply constraints: Environmental regulations and community opposition limiting new mine development
- Price sustainability: Copper prices maintaining levels above $12,000 per ton throughout the period
- Substitution research: Accelerated development of alternative materials for specific applications
Scenario 3: Market Fragmentation Consolidation (2025-2027)
This pathway involves permanent geographic market segmentation, with regional copper trading blocs operating under different pricing mechanisms and supply chain arrangements.
Structural elements include:
- Regional pricing zones: Persistent premium differentials based on trade policy and strategic stockpiling
- Government intervention: National copper reserves becoming standard policy across major economies
- Supply chain nationalism: Bilateral agreements replacing multilateral commodity trading arrangements
- Technology transfer restrictions: Limitations on mining technology sharing affecting productivity improvements
Scenario Probability Assessment
Current market indicators suggest elements from multiple scenarios may materialise simultaneously, creating hybrid outcomes rather than discrete pathway selection.
Long-term Supply Variables:
| Factor | Impact Timeline | Uncertainty Level | Market Effect |
|---|---|---|---|
| New Mine Development | 2027-2030 | High | Major supply addition |
| Recycling Expansion | 2025-2027 | Medium | Moderate supply supplement |
| Demand Growth Rate | 2025-2035 | High | Fundamental driver |
| Trade Policy Evolution | 2025-2026 | Very High | Market structure |
Investment Implications by Timeline
Near-term positioning (2025-2027) favours exposure to existing production capacity and inventory management capabilities. Companies with established mining operations, processing facilities, and strategic stockpiles benefit from sustained price premiums and supply chain bottlenecks.
Medium-term opportunities (2027-2030) centre on development-stage projects with advanced permitting status and financing arrangements. Recycling infrastructure, mining technology providers, and alternative material developers represent growing market segments.
Long-term scenarios (2030+) depend heavily on breakthrough technologies, policy coordination, and demand evolution patterns that remain highly uncertain given current information availability.
Which Industries Face the Greatest Copper Exposure?
Industrial copper dependency varies significantly across economic sectors, with some industries facing critical supply chain vulnerabilities while others maintain viable substitution options or alternative material pathways. The energy transition has fundamentally altered copper consumption patterns, creating new high-intensity demand sources.
Electric Vehicle Manufacturing
The automotive industry's electrification transformation represents one of the most copper-intensive industrial transitions in modern history. Electric vehicles require 3-4 times more copper than traditional internal combustion vehicles, with high-performance electric models containing up to 180 pounds of copper per vehicle.
EV Copper Requirements:
- Battery electric vehicles: 150-180 pounds copper per vehicle
- Hybrid vehicles: 85-100 pounds copper per vehicle
- Traditional vehicles: 45-55 pounds copper per vehicle
- Charging infrastructure: Additional 15-25 pounds per charging station
Substitution options remain extremely limited for EV applications due to copper's superior electrical conductivity and thermal management properties. Aluminium can partially replace copper in some applications but requires design modifications and accepts performance compromises.
Renewable Energy Infrastructure
Wind and solar power generation facilities represent copper-intensive infrastructure with limited substitution flexibility. Offshore wind installations require particularly high copper quantities due to transmission cable requirements and transformer specifications.
Renewable Energy Copper Intensity:
| Technology | Copper per MW | Substitution Potential | Supply Risk Level |
|---|---|---|---|
| Offshore Wind | 8-15 tons | Limited | Very High |
| Onshore Wind | 3-5 tons | Moderate | High |
| Solar Photovoltaic | 4-6 tons | Limited | High |
| Energy Storage | 2-4 tons | Very Limited | Very High |
Construction and Infrastructure
Building construction represents the largest single copper consumption category globally, but maintains multiple substitution options for most applications. Plumbing, electrical wiring, and HVAC systems can utilise alternative materials including aluminium, plastic composites, and steel alloys.
However, specialised construction applications including hospitals, data centres, and industrial facilities maintain copper requirements due to reliability and safety considerations. These applications prioritise performance over cost considerations, creating price-inelastic demand segments.
Electronics and Technology Manufacturing
Consumer electronics manufacturing faces severe copper supply constraints with limited substitution options for critical applications. Semiconductor manufacturing, printed circuit boards, and advanced computing systems require copper's unique combination of electrical and thermal properties.
Technology Sector Vulnerabilities:
- Semiconductor fab facilities: Essential copper requirements with no substitutes
- Data centre infrastructure: Copper-intensive cooling and power distribution systems
- Telecommunications equipment: High-frequency applications requiring copper conductivity
- Consumer devices: Miniaturisation demands optimised conductivity per volume
Industrial Equipment and Manufacturing
Heavy industry faces moderate copper exposure through electric motors, transformers, and power distribution equipment. Many industrial applications can accommodate aluminium substitution with appropriate design modifications, though efficiency penalties often apply.
The industrial sector's copper vulnerability depends on specific application requirements and performance tolerances. Critical applications including aerospace, medical devices, and precision manufacturing maintain copper specifications regardless of price considerations.
Investment Sector Impact Analysis
Companies with high copper exposure face varying strategic responses based on their substitution flexibility and market positioning. Industries with limited alternatives must implement supply chain security measures including forward contracting, strategic inventory, and vertical integration.
Investors should evaluate copper exposure across portfolio holdings, particularly in technology, automotive, and renewable energy sectors where copper supply constraints could affect operational costs and project economics significantly.
The next major ASX story will hit our subscribers first
How Should Investors Position for Copper Market Dynamics?
Investment positioning for copper market dynamics requires understanding both direct commodity exposure and indirect sector vulnerabilities created by supply chain constraints. The current market structure offers multiple pathway approaches depending on risk tolerance and timeline considerations, as detailed in our copper investment outlook.
Direct Copper Investment Strategies
Major mining companies with established operations and proven reserve bases represent the most straightforward copper exposure mechanism. These companies benefit directly from sustained price premiums while maintaining operational flexibility to optimise production based on market conditions.
Primary Producer Investment Criteria:
- Reserve quality and location: Long-life assets in politically stable jurisdictions
- Production cost positioning: Operations in lowest-quartile cost structure
- Expansion capability: Existing infrastructure enabling capacity increases
- Balance sheet strength: Financial flexibility for capital deployment and market volatility
Australian Securities Exchange Mining Opportunities
The ASX hosts numerous copper-focused mining companies with varying development stages and risk profiles. Established producers offer dividend yield potential and operational cash flow, while development-stage companies provide leverage to copper price appreciation.
ASX Copper Investment Categories:
| Company Type | Risk Level | Return Potential | Timeline |
|---|---|---|---|
| Major Producers | Low-Medium | 15-25% | 1-3 years |
| Mid-tier Miners | Medium | 25-50% | 2-4 years |
| Development Companies | High | 50-200% | 3-7 years |
| Exploration Plays | Very High | 100-500% | 5-10 years |
Processing and Smelting Investment Considerations
Copper smelting companies face complex investment dynamics due to negative processing fees and overcapacity conditions. However, companies with long-term concentrate supply contracts or integrated mining operations maintain competitive advantages during supply constraint periods.
Investment in smelting capacity requires careful evaluation of concentrate access, energy costs, and regulatory compliance capabilities. Companies with renewable energy integration and advanced environmental controls position advantageously for long-term operations.
Technology and Equipment Providers
Mining technology companies benefit from increased capital deployment in copper extraction and processing optimisation. Automation, ore sorting technology, and environmental remediation equipment represent growing market segments.
Technology Investment Themes:
- Autonomous mining equipment: Reducing operational costs and safety risks
- Ore processing optimisation: AI-driven systems improving recovery rates
- Environmental technology: Emissions reduction and waste processing solutions
- Recycling innovation: Urban mining and electronic waste processing equipment
Recycling and Alternative Materials
Companies developing copper recycling capabilities or alternative conductor materials represent diversified exposure to copper market dynamics. These investments provide both growth potential from market expansion and hedge characteristics against extreme copper price scenarios.
Urban mining companies processing electronic waste and industrial scrap materials capture value from secondary copper sources while addressing environmental concerns. This sector benefits from both commodity price appreciation and increasing regulatory requirements for recycling.
Geographic and Currency Considerations
Copper investments involve significant geographic and currency exposure, particularly for international mining operations. Australian dollar, Chilean peso, and Peruvian sol fluctuations affect mining company returns independent of copper price movements.
Currency hedging strategies or domestic currency-matched investments can reduce foreign exchange volatility while maintaining copper price exposure. Furthermore, Australian investors may prefer ASX-listed companies with domestic currency financial reporting.
Portfolio Allocation and Risk Management
Copper investment positioning should consider correlation with broader portfolio holdings and macroeconomic sensitivity factors.
Recommended allocation approaches include:
- Conservative positioning: 5-10% exposure through diversified mining company holdings
- Moderate positioning: 10-20% allocation including direct and indirect copper investments
- Aggressive positioning: 20%+ concentration with individual company selection focus
Risk management requires monitoring supply chain developments, policy changes, and alternative technology advancement that could affect long-term copper demand trajectories.
What Policy Responses Could Reshape Markets?
Government intervention in copper markets operates through multiple policy mechanisms that could fundamentally alter global supply chain structures and pricing dynamics. Current policy uncertainty creates both risks and opportunities for market participants depending on eventual regulatory outcomes, as highlighted in our analysis of Argentinian copper insights.
Strategic Reserve Accumulation
National copper stockpiling programmes represent an emerging policy trend with potential to reshape global market dynamics. Countries recognising copper as critical infrastructure material for energy transition and national security implement strategic reserve programmes similar to petroleum stockpiling initiatives.
The United States' current copper accumulation pattern, while primarily driven by tariff uncertainty, demonstrates how policy-motivated stockpiling affects global supply distribution. If formalised into strategic reserve policy, such programmes could permanently alter demand patterns and inventory management across the copper supply chain.
Strategic Reserve Policy Implications:
- Inventory redistribution: Government stockpiling removing copper from commercial markets
- Price floor establishment: Strategic buying programmes providing price support during market weakness
- Supply security objectives: Reducing dependence on concentrated production sources
- International coordination: Potential for allied nations to coordinate reserve programmes
Trade Policy and Tariff Structures
Copper product tariffs and trade restrictions create artificial market segmentation that could become permanent fixtures of global commodity trading. Current US tariff uncertainty affecting refined copper imports illustrates how trade policy speculation influences physical metal flows and pricing structures.
Trade Policy Scenarios:
| Policy Option | Market Impact | Probability | Timeline |
|---|---|---|---|
| Tariff Extension | Permanent US premium | Moderate | Mid-2026 |
| Policy Reversal | Market reunification | Low | Mid-2026 |
| Bilateral Arrangements | Regional trading blocs | High | 2026-2028 |
| Multilateral Coordination | Supply chain stability | Low | 2027+ |
Extended tariff implementation could create permanent geographic arbitrage opportunities and encourage domestic copper production development. Alternative policy approaches might include bilateral trade agreements with specific producing countries or multilateral frameworks addressing critical mineral security.
Environmental Regulation and Carbon Pricing
Climate policy implementation affects copper mining economics through carbon pricing, emissions standards, and environmental impact requirements. Mining operations with high carbon intensity face increasing regulatory costs that could affect global supply curves.
Environmental Policy Impacts:
- Carbon taxation: Increased operational costs for energy-intensive mining operations
- Emissions standards: Equipment and process upgrades required for compliance
- Land use restrictions: Limited access to mineral resources in environmentally sensitive areas
- Rehabilitation requirements: Enhanced mine closure and land restoration obligations
Renewable energy-powered mining operations gain competitive advantages under carbon pricing regimes, potentially altering the geographic distribution of economically viable copper production.
International Cooperation Frameworks
Multilateral agreements addressing critical mineral security could replace market-driven allocation mechanisms with coordinated supply chain management. Such frameworks might include technology sharing arrangements, joint strategic reserve programmes, and coordinated development financing.
The potential for Western nations to coordinate copper supply chain security through institutional frameworks similar to International Energy Agency oil coordination represents a significant policy development possibility.
Resource Nationalism and Export Controls
Copper-producing countries increasingly implement policies prioritising domestic value addition and limiting raw material exports. These resource nationalism trends could reshape global copper processing geographic distribution and vertical integration strategies.
Resource Nationalism Policy Tools:
- Export restrictions: Limitations on concentrate and refined copper exports
- Value-added requirements: Mandating domestic processing before export authorisation
- Foreign investment controls: Restrictions on international mining company operations
- Strategic sector designation: Government oversight of copper resource development
Regulatory Harmonisation and Standards
International standardisation of copper recycling protocols, environmental standards, and quality specifications could reduce transaction costs and improve market efficiency. However, regulatory fragmentation could alternatively increase compliance costs and create trade barriers.
Global coordination on recycling standards, environmental impact measurement, and supply chain transparency requirements affects industry operational structures and competitive positioning across different regulatory jurisdictions.
Policy responses to current copper supply crunch dynamics will significantly influence long-term industry structure, pricing mechanisms, and investment opportunity distribution. Investors should monitor policy development across major consuming and producing regions for strategic positioning guidance.
FAQ: Copper Supply Crunch Essentials
Is the copper shortage affecting all regions equally?
No, copper supply constraints manifest differently across geographic regions due to trade policy uncertainty and strategic stockpiling behaviour. The United States maintains abundant inventory levels with CME stocks representing 55% of global exchange inventory, while Europe and Asia experience tightening supply conditions. Regional premium differentials of $345-500 per ton reflect these geographic imbalances rather than uniform global scarcity.
How long will elevated copper prices persist?
Current copper price levels around $12,000+ per ton face support from structural supply constraints and energy transition demand growth. Market analysis suggests price pressure continuation through 2026-2028, with potential extension into the 2030s absent major new supply additions. However, price sustainability depends on demand trajectory maintenance and resolution of current smelting capacity imbalances.
What alternatives exist to copper in critical applications?
Limited substitution options exist for electrical and thermal conductivity applications central to energy transition infrastructure. Aluminium provides partial replacement in some power transmission applications with efficiency penalties of 15-25%. Electronics manufacturing and electric vehicle production maintain copper requirements due to performance specifications. Alternative material development remains early-stage for most critical applications.
Which mining companies are best positioned for the supply crunch?
Large-scale producers with established operations in politically stable jurisdictions hold optimal positioning for sustained copper price premiums. Companies with proven reserve bases, lowest-quartile production costs, and expansion capability benefit most from current market dynamics. Australian Securities Exchange mining companies with integrated operations and strong balance sheets provide attractive investment exposure to copper market conditions.
Do current copper prices reflect fundamental supply-demand balance?
Current copper pricing incorporates significant premium elements driven by tariff uncertainty and geographic market fragmentation rather than pure supply-demand fundamentals. Manufacturing activity contraction across major economies contradicts traditional demand-driven price increases. Market structure analysis indicates approximately $2,000-3,000 per ton price premium attributable to policy uncertainty and strategic positioning rather than consumption growth.
What role does China play in global copper market dynamics?
China operates as both the world's largest copper consumer and a significant smelting overcapacity source. Chinese smelters face negative processing fees due to concentrate scarcity, while Chinese copper re-exports to the United States total 128,000 tons since February 2025. China's position as secondary priority in global copper delivery queues represents an unprecedented shift in commodity market hierarchy.
How do recycling and secondary supply sources affect the market?
Copper recycling currently provides approximately 20-25% of global supply, with potential expansion to 30-35% by 2030 through urban mining and electronic waste processing improvements. However, recycling growth rates remain insufficient to offset energy transition demand acceleration. Secondary supply sources provide market stabilisation but cannot eliminate primary mining requirements for demand growth scenarios.
What indicators should investors monitor for market direction changes?
Key monitoring indicators include LME inventory levels relative to 100,000-ton thresholds, CME-LME premium sustainability above shipping costs, Chinese smelter production cut implementation effectiveness, and US tariff policy decisions scheduled for mid-2026. Furthermore, forward curve structures showing contango versus backwardation patterns provide early signals of supply-demand rebalancing across geographic regions.
Navigating the Copper Market Transformation
The global copper supply crunch represents a fundamental shift from traditional cyclical commodity patterns toward structural market fragmentation driven by policy uncertainty and energy transition demand acceleration. Geographic price differentials, processing capacity imbalances, and supply chain nationalism create complex investment landscapes requiring sophisticated analysis beyond conventional supply-demand modelling, as explored in our Chile copper market outlook.
Success in this environment demands understanding of regional policy developments, technological advancement timelines, and alternative material competition dynamics. While short-term volatility remains elevated due to tariff uncertainty and inventory redistribution patterns, underlying structural factors suggest sustained copper market tightness through the remainder of this decade.
Market participants must evaluate both direct commodity exposure and indirect sector vulnerabilities when positioning for continued copper supply constraints. The intersection of energy transition acceleration, mining industry challenges, and geopolitical supply chain security concerns creates investment opportunities across multiple industry segments whilst requiring careful risk management approaches.
Investment Disclaimer: This analysis contains forward-looking projections and market speculation that involve inherent uncertainties. Copper market investments carry significant volatility risks, and readers should conduct independent research and consider professional financial advice before making investment decisions. Past performance does not guarantee future results, and commodity investments may result in substantial losses.
Ready to Capitalise on the Next Major Copper Discovery?
Discovery Alert instantly identifies significant ASX copper discoveries using its proprietary Discovery IQ model, transforming complex market dynamics into actionable investment insights. With copper supply constraints creating unprecedented opportunities and regional market fragmentation driving price premiums above $500 per ton, Discovery Alert's proprietary system ensures subscribers receive real-time alerts on breakthrough announcements before broader market recognition. Start your 30-day free trial today to position yourself ahead of the copper market transformation.