
June 23, 2026
The Mine Pipeline Problem Nobody Is Talking About Loudly Enough
Every commodity market tells two stories simultaneously: the demand story, which is relatively easy to model using industrial output, population growth, and technology adoption curves, and the supply story, which is far more treacherous. In copper, the supply story has quietly become the more important of the two. Not because demand is unimpressive — it is accelerating from multiple independent vectors — but because the pipeline of future mines capable of satisfying that demand is alarmingly thin. Understanding this distinction is the starting point for understanding why the copper supply deficit and development-stage projects are now so closely linked in the minds of institutional capital allocators.
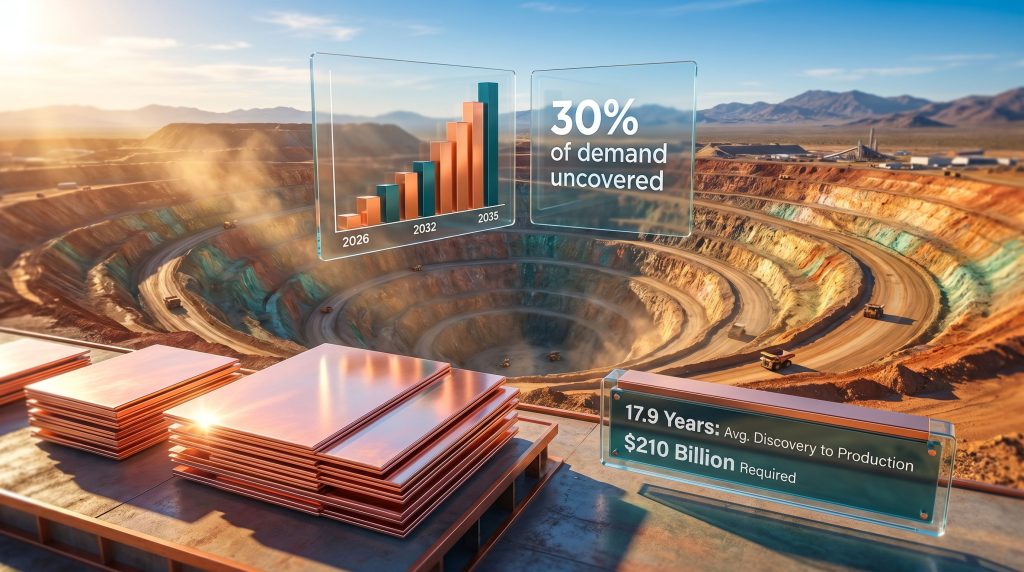
The binding constraint in today's copper market is not the price signal. Copper has traded near record levels. The binding constraint is time. A copper mine takes, on average, 17.9 years to move from discovery to first production globally, and approaches 29 years in jurisdictions like the United States where permitting complexity is greatest. No price signal, however elevated, can compress that timeline sufficiently to close a structural gap that has been accumulating for more than a decade.
When big ASX news breaks, our subscribers know first
How Dramatically Institutional Forecasts Have Shifted
Perhaps the most striking feature of the current copper market is not the deficit itself but the speed with which the consensus has reversed. In a relatively short period, institutional forecasts that modelled a manageable surplus have been revised to reflect a confirmed and growing multi-year shortfall. The copper supply crunch has consequently become a central concern for analysts and producers alike.
Major Institutional Deficit Forecasts for 2026
| Institution | Estimated Deficit | Primary Driver Cited |
|---|---|---|
| International Copper Study Group | ~150,000 tonnes | Revised from a 209,000-tonne surplus |
| J.P. Morgan | ~330,000 tonnes | AI data centre copper demand |
| Morgan Stanley | ~600,000 tonnes | Largest refined deficit in 20+ years |
| Goldman Sachs | ~640,000 tonnes (ex-US) | Major mine disruption impact |
| Jefferies | ~491,000 t/yr average through 2030 | Multi-year disruption modelling |
The International Copper Study Group, which had previously projected two consecutive years of surplus, now expects a refined-market deficit. Goldman Sachs revised its 2026 ex-US deficit estimate to approximately 640,000 tonnes, roughly ten times its prior forecast. These are not marginal adjustments. They represent a wholesale reappraisal of supply-demand dynamics driven primarily by events on the supply side rather than any sudden surge in consumption.
The Disruption Cascade That Forced the Revision
Three major supply events converged to transform the outlook. A mudslide at Freeport-McMoRan's Grasberg operation in Indonesia in September 2025 triggered force majeure at what is the world's second-largest copper mine. The full restart timeline shifted from 2027 to 2028, and Benchmark Mineral Intelligence estimates that approximately 600,000 tonnes of contained copper will be lost between that disruption and the end of 2026 alone.
Simultaneously, operational setbacks at Codelco's El Teniente mine in Chile and sulphuric acid supply constraints at the Kamoa-Kakula complex in the Democratic Republic of Congo compounded the shortfall. China's restriction on sulphuric acid exports, which is used in the solvent extraction and electrowinning process for oxide copper ore, carries the potential to constrain roughly 15% of global copper production capacity. When several of the world's most significant copper operations experience difficulties at the same time, the cumulative effect on refined supply is not additive — it is multiplicative.
Why the Top-Heavy Supply Structure Amplifies Every Disruption
The copper industry's supply concentration is rarely discussed as a systemic risk in the same way that financial concentration is scrutinised in banking, but the principle is similar. The largest copper mines account for approximately 36% of global copper output. When a single mega-mine suffers an unplanned outage, furthermore, the reverberations are felt across the entire global supply balance.
This concentration dynamic has important implications for how investors should think about the value of new copper supply. As Merlin Marr-Johnson, Chief Executive Officer of Fitzroy Minerals, has noted publicly, the copper industry is largely engaged in the challenge of maintaining existing output rather than growing it. Production growth has become harder to deliver as mature copper districts simultaneously face declining ore grades, longer permitting timelines, and rising capital intensity at depth. The consequence is that even modest new production sources carry significant strategic value.
Many of the world's largest copper operations are aging infrastructure assets. Deeper ore bodies require higher capital intensity not just to expand but simply to sustain current production rates. The pipeline of replacement-scale discoveries that have reached advanced development is historically thin. Of the 239 major copper discoveries analysed in published research, 148 remain undeveloped, with 121 still in feasibility stages and only 15 having reached construction. These numbers illustrate the fundamental problem: discovery is not the bottleneck, development is.
The Demand Side Is Adding Pressure From Multiple Directions
While supply struggles, demand continues to compound. The copper price growth drivers span several independent vectors, each adding persistent baseline consumption growth:
-
Artificial intelligence infrastructure: J.P. Morgan estimates that data centres alone will consume approximately 110,000 additional tonnes of copper in 2026. Hyperscale AI facilities can require up to 50,000 tonnes each for power-dense configurations due to the extensive cabling, cooling systems, and transformer requirements involved.
-
Grid expansion: China's State Grid investment is projected to increase by approximately 40% through 2030, reflecting the scale of transmission infrastructure buildout required to connect renewable generation capacity to industrial and residential consumers.
-
Electrification: Electric vehicle adoption, renewable energy installation, and transmission network upgrades are adding structural copper demand that is largely independent of economic cycles.
S&P Global projects that meeting copper demand through 2040 will require more than 10 million metric tonnes of additional primary supply. Without significant new investment, supply could fall 1 million metric tonnes short of current production levels, let alone the higher output levels that future requirements demand.
The IEA's assessment is the most sobering. Existing and currently planned copper projects are estimated to satisfy only approximately 70% of projected 2035 demand. That 30% gap has no identified supply source in today's mine pipeline, even assuming every currently envisioned project proceeds on time and on budget — neither of which is historically guaranteed.
Quantifying the Deficit Across Multiple Time Horizons
The copper supply deficit and development-stage projects are inseparably linked precisely because the shortfall is not a single-year phenomenon. It is a compounding structural problem that intensifies as the decade progresses.
Deficit Trajectory Across Time Horizons
| Time Horizon | Estimated Supply Gap | Key Assumption |
|---|---|---|
| 2026 | 150,000 to 640,000 tonnes | Disruption-driven, demand accelerating |
| 2027 onwards | Deepening deficit | S&P Global concentrate modelling |
| 2032 | ~2.2 million tonne concentrate deficit | S&P Global pipeline analysis |
| 2035 | ~30% of demand uncovered | IEA project pipeline assessment |
| 2040 | ~10 million tonne cumulative gap | 25% of projected total demand |
Closing this gap requires an estimated $210 billion or more in new mine investment through 2035, approximately three times the capital deployed across the prior six years. That scale of investment requires not just capital availability but a sufficiently deep pipeline of advanced projects capable of absorbing it.
Why Price Alone Cannot Solve a Structural Shortage
There is a persistent misconception in commodity market commentary that higher prices will automatically attract sufficient new supply. In copper, however, the mechanics of mine development prevent this from occurring within the timeframe that demand growth requires.
Global copper ore grades have declined approximately 40% since 1991, according to S&P Global. This grade deterioration means that mining companies must process progressively more rock to extract the same quantity of copper, which simultaneously increases energy consumption, water usage, tailings volumes, and capital requirements per unit of output. Higher prices improve project economics on paper, but they cannot reverse the geological reality of declining grades or accelerate the regulatory and construction timelines that govern project delivery.
The industry's challenge, as practitioners in mature copper districts have articulated, is not simply adding new supply but maintaining existing output as grades decline and infrastructure ages. This dynamic fundamentally changes how development-stage assets should be valued. A project that can credibly add new copper tonnes to the market is not competing against an abundant pipeline of alternatives. In many cases, it is one of a small number of such projects globally.
The next major ASX story will hit our subscribers first
How Deposit Rarity Changes Valuation Logic
In a market structurally short of new supply, the scarcity of large, advanced copper deposits is itself a valuation driver. When comparable assets are rare, competitive dynamics shift materially in favour of project owners. Jonathon Deluce, Chief Executive Officer of Abitibi Metals, has described the rarity of large-scale copper deposits in established jurisdictions as a key differentiator in how the market values individual assets.
Projects with district-scale resource potential that sit in politically stable mining jurisdictions with existing infrastructure access occupy a fundamentally different competitive position than projects located in remote or technically complex settings. The relationship between majors and juniors in copper consequently reflects this scarcity dynamic, with major producers actively seeking development-stage assets to replenish declining reserves.
Investors assess development-stage copper project quality through several key metrics:
-
NPV8 and IRR: Net present value at an 8% discount rate and internal rate of return measure economic value and expected returns at defined copper price assumptions.
-
All-In Sustaining Cost (AISC): Determines whether a project remains economically viable across commodity price cycles. Projects with AISC well below spot copper prices carry a wider margin of safety.
-
Capital requirement: Projects with manageable and staged upfront capital requirements are more likely to attract financing in a competitive funding environment.
-
Resource classification: Measured and indicated resources command higher valuations than inferred resources because they reduce geological uncertainty and provide greater confidence in the underlying deposit model.
Project Quality Signals: Lower vs. Higher Valuation Indicators
| Project Attribute | Lower Valuation Signal | Higher Valuation Signal |
|---|---|---|
| Resource classification | Predominantly inferred | Measured and indicated dominant |
| Economic study status | Scoping study only | Prefeasibility or feasibility complete |
| Capital requirement | Requires $800M+ greenfield build | Staged or brownfield pathway available |
| Permitting status | Early community engagement | Advanced or conditionally approved |
| Infrastructure access | Remote, no existing access | Existing road, power, water connections |
Hayden Locke, Chief Executive Officer of Marimaca Copper, has stated publicly that large, advanced copper projects in infrastructure-accessible locations in established mining districts attract attention from virtually every major mining company, reflecting how intense the competition for new copper supply has become among producers seeking to replace declining reserves. The Marimaca Oxide Deposit carries a post-tax NPV8 of approximately US$709 million at US$4.30 per pound copper and roughly US$1.1 billion at spot prices, with an IRR of 31% to 39% and first-five-year AISC near US$1.97 per pound. Initial capital costs of approximately US$587 million and a reported cash position of roughly US$147 million with no debt provide a measurable picture of its financing pathway.
Brownfield Restarts: The Capital-Efficient Route to New Production
Among the various pathways to new copper supply, brownfield restarts occupy a strategically distinct position. They offer faster timelines and lower capital requirements than greenfield development because the fundamental infrastructure already exists and simply requires rehabilitation rather than construction from scratch.
Greenfield vs. Brownfield Copper Development: Key Comparisons
| Development Type | Typical Capital Requirement | Timeline to Production | Infrastructure Status |
|---|---|---|---|
| Greenfield copper mine | $800M to $900M+ at comparable scale | 10 to 17+ years from discovery | Must be built from scratch |
| Brownfield restart | ~25% of comparable greenfield cost | Significantly shorter | Existing mill, roads, tailings, power |
Selkirk Copper's planned restart of the Minto mine in Canada's Yukon territory illustrates this dynamic concretely. M. Colin Joudrie, President and Chief Executive Officer of Selkirk Copper, has articulated that by reusing more than US$330 million of existing infrastructure, including a 4,100-tonne-per-day mill, the project targets a capital requirement of approximately 25% of what a comparable greenfield development would cost, which in a new-build context would likely reach US$800 million to US$900 million. The mine's historic concentrate grades of 36% to 40% copper are particularly valuable in the current environment, where global concentrate averages roughly 26% to 28% and treatment and refining charges have approached zero, meaning smelters are competing for high-grade feed rather than charging premiums for processing.
Staged Development and the Capital Efficiency Advantage
When financing conditions are selective and capital markets reward disciplined capital deployment, the design architecture of a copper project matters as much as its grade. Projects that can generate early cash flow from lower-capital oxide operations while simultaneously advancing larger sulphide resources present a fundamentally different risk profile to investors and lenders.
Cobra Resources has identified that shallow oxide mineralisation at its Manna Hill project could support an initial lower-capital heap leach development pathway before transitioning to conventional flotation processing for deeper sulphide material. As Rupert Verco, Managing Director of Cobra Resources, has explained publicly, this staged approach creates the potential for a low-cost startup treating heap leach material for copper and potentially gold in higher-grade zones, followed by a standard flotation circuit targeting the broader primary sulphide mineralisation. Completing a definitive feasibility study for such a project can substantially reduce financing risk by providing lenders and investors with the technical certainty they require.
Fitzroy Minerals has taken a similar approach to processing capital, planning to route oxide ore through a partner's existing solvent extraction and electrowinning plant rather than constructing a dedicated facility. This arrangement can reduce initial capital requirements by tens to hundreds of millions of dollars depending on project scale — a significant advantage when global greenfield copper projects are facing increasing capital intensity and longer permitting timelines.
A staged development approach that can generate initial cash flow from a lower-capital oxide operation while advancing a larger sulphide resource simultaneously has a fundamentally different risk profile than a project requiring full capital commitment before any revenue is generated.
By-product revenue credits represent another under-appreciated source of capital efficiency. Secondary metals including gold, molybdenum, and silver can materially reduce the net cost of copper production. Unrecognised by-product potential, such as independently occurring molybdenum at an early-stage copper project, can represent genuinely unpriced value in preliminary project assessments, particularly when the by-product has not yet been formally incorporated into economic models.
The Risks That Could Narrow the Deficit Faster Than Expected
The structural case for a sustained copper supply deficit and development-stage projects commanding premium valuations is well-supported by data. However, investors should maintain a clear-eyed assessment of the scenarios under which the shortfall could narrow.
Risk Framework: What Could Close the Gap
| Risk Category | Specific Risk | Potential Impact |
|---|---|---|
| Demand | Sustained Chinese demand weakness | Narrows deficit materially |
| Supply | Early Grasberg or other restarts | Reduces 2026 to 2027 shortfall |
| Investor positioning | LME long position unwind | Price correction, not structural change |
| Project level | Permitting or financing delay | Delays new supply, widens long-term gap |
| Macro | Global recession or slowdown | Reduces near-term demand growth |
Chinese refined copper demand fell approximately 8% year-over-year in Q4 2025, and short positioning on the Shanghai Futures Exchange reached its widest level since 2021 in late 2025. These signals indicate that not all market participants share the bullish consensus, and a sustained softening in Chinese industrial activity could reduce the severity of the projected shortfall meaningfully.
London Metal Exchange net long positions were near the 80th percentile in recent periods, indicating elevated investor positioning that could unwind if macroeconomic conditions deteriorate or if disrupted mines restart faster than current timelines suggest. StoneX models a 2026 average copper price of approximately US$11,490 per tonne, a level that could incentivise previously uneconomic supply sources to return to the market.
For pre-production companies specifically, the risk set extends beyond commodity prices. Permitting approvals and licence amendments remain subject to regulatory timelines entirely outside management control. Financing has not been secured for many development-stage projects, creating dilution risk. Assay delays, logistics constraints, and unfinished technical studies can defer milestone delivery. These companies generate no operating cash flow, and their valuations are entirely dependent on future milestones being achieved on schedule.
Mapping Investment Exposure Across the Copper Development Spectrum
Different stages of copper project development carry distinct risk-return characteristics. Understanding where value is created — and where it can be eroded — is essential for positioning copper exposure appropriately in a supply-constrained market.
Copper Exposure by Development Stage
| Stage | Key Advantage | Primary Risk |
|---|---|---|
| Major producers (BHP, Rio Tinto, South32) | Immediate cash flow, diversified exposure | Limited leverage to supply scarcity premium |
| Development-stage projects | High leverage to copper price and scarcity | Dependent on feasibility, permitting, financing |
| Brownfield restarts | Faster timeline, lower capital, asset backing | Rehabilitation complexity, regulatory pathways |
| Exploration-stage companies | Maximum leverage to discovery value | Highest geological and financing risk |
The hierarchy of risk and return in this spectrum is not static. As the copper supply deficit and development-stage projects become ever more central to institutional allocation strategies, the premium commanded by assets with completed feasibility studies, defined permitting pathways, and manageable capital requirements is likely to widen relative to earlier-stage assets. Resource classification upgrades — moving from inferred to indicated and then to measured — represent specific catalysts that can drive valuation re-ratings for exploration and development companies positioned in the right districts.
Disclaimer: This article is for informational purposes only and does not constitute financial advice. Investment in mining equities, particularly pre-production and exploration-stage companies, carries significant risk including the potential loss of capital. Forecasts and deficit projections from third-party institutions represent analytical estimates, not guarantees of future market conditions. Readers should conduct their own due diligence and consult a qualified financial adviser before making investment decisions.
Want to Capitalise on the Next Major Copper Discovery Before the Broader Market?
Discovery Alert's proprietary Discovery IQ model delivers real-time alerts on significant ASX mineral discoveries, transforming complex mineral data into actionable insights for investors at every experience level — explore the historic returns major discoveries have generated or visit Discovery Alert to begin your 14-day free trial and position yourself ahead of the market.