August 13, 2026
Why the Copper Processing Economy Has Been Turned Upside Down
Few market mechanisms reveal the internal stress of a commodity supply chain as clearly as treatment charges. In copper markets, these fees function as a real-time pressure gauge on the balance between mine output and processing capacity. When they collapse into deeply negative territory and stay there for nearly two years, the signal transcends ordinary market noise and points toward a structural reconfiguration of where value accumulates across the entire copper value chain.
That reconfiguration is now fully underway. Copper treatment charges and Chinese demand are at the centre of one of the most consequential shifts in copper market economics in recent memory, and understanding the mechanics behind this inversion is essential for anyone tracking the metal's trajectory through the remainder of 2026 and beyond.
When big ASX news breaks, our subscribers know first
How the Copper Supply Chain Creates and Distributes Value
The Three-Stage Processing Architecture
Before examining why treatment charges matter, it helps to understand the physical journey copper makes from ore body to finished industrial metal. The supply chain operates across three distinct but interdependent stages:
-
Stage 1 – Mining: Ore is extracted and milled into copper concentrate, typically containing between 25% and 35% copper content. This is the stage where geological endowment and operational efficiency determine the volume of material available to downstream processors.
-
Stage 2 – Smelting: Concentrate enters a pyrometallurgical process that burns off sulphur and other impurities to produce blister copper, reaching approximately 99% purity. This is the stage where treatment charges are applied.
-
Stage 3 – Refining: Blister copper undergoes electrolytic refining to produce cathode copper at 99.99% purity, the standard form used in wire rod, electrical components, and industrial manufacturing.
What Treatment Charges Actually Represent
Treatment charges (TCs) and refining charges (RCs) are the financial bridge between Stage 1 and Stages 2 and 3. In a conventional market, miners pay smelters a fee for processing concentrate into usable metal. The level of that fee reflects the relative bargaining power of each party, which in turn reflects concentrate availability relative to processing capacity.
| Term | Definition | Unit | Who Pays |
|---|---|---|---|
| Treatment Charge (TC) | Fee for smelting concentrate into blister copper | USD per dry metric tonne | Miner pays smelter |
| Refining Charge (RC) | Fee for electrolytic refining into cathode | Cents per pound | Miner pays smelter |
| Negative TC/RC | Smelter pays miner for feed access | USD/DMT (negative) | Smelter pays miner |
| Yangshan Premium | Import premium above LME for copper entering China | USD per tonne | Chinese importers pay |
When TC/RCs turn negative, the entire economic logic of the processing relationship inverts. Instead of miners paying for a service, smelters are effectively bidding against one another for scarce raw material. The fee direction reversal is not a technicality; it is a fundamental market distress signal.
The Record-Breaking Collapse in Treatment Charges
Nineteen Months and Counting
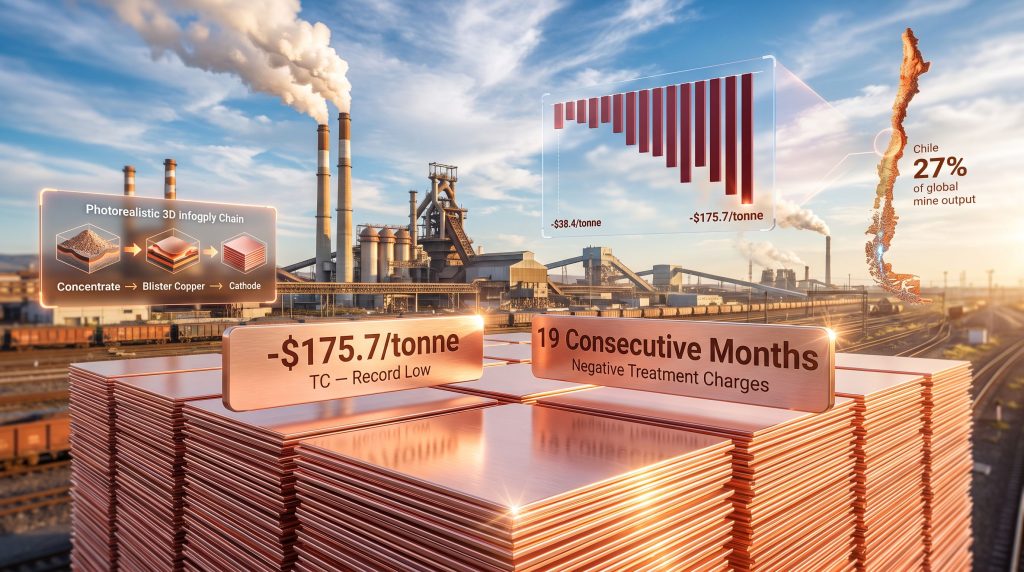
Copper treatment charges have now remained negative for 19 consecutive months, a duration that removes any possibility of characterising this as a short-term price anomaly. Imported concentrate treatment charges fell to a record low of -$175.7 per tonne, compared with -$38.4 per tonne just twelve months earlier. The China CIF clean concentrate TC reached -$132 per metric tonne in July 2026, while the refining charge component simultaneously fell to -13.2 cents per pound.
| Metric | Prior Year Level | Current Level | Implied Change |
|---|---|---|---|
| Imported concentrate TC | -$38.4/tonne | -$175.7/tonne | Record low |
| China CIF clean concentrate TC | Marginally negative | -$132/mt (July 2026) | Record low |
| RC component | Near zero | -13.2 cents/lb | Record low |
| Duration of negative TCs | Shorter-cycle | 19 consecutive months | Structural signal |
Furthermore, Chinese smelters have reportedly agreed to record-low TC/RCs, underscoring just how acute the concentrate scarcity has become and how far the processing economics have shifted against smelters in this cycle.
Why Smelters Keep Running Despite Negative Margins
A rational observer might expect smelters facing -$175.7/tonne processing losses to simply shut down. However, several structural factors explain why they do not:
-
Long-term contractual commitments mean a portion of concentrate is purchased under multi-year offtake agreements priced at benchmark levels established in prior periods.
-
Throughput mandates and capacity utilisation pressures within China's industrial planning framework create institutional incentives to maintain operations regardless of short-term spot economics.
-
Byproduct revenue streams from gold, silver, and sulphuric acid recovered during smelting provide partial offsets to processing losses, allowing marginal operations to continue.
The net result is that smelting capacity remains online, concentrate demand stays elevated, and the structural imbalance between mine supply and processing capacity persists.
What Is Driving the Concentrate Shortage
China's Smelting Expansion Outran Mine Supply Growth
The root cause of negative copper treatment charges and Chinese demand dynamics is a capacity mismatch that developed over several years. China aggressively expanded smelting infrastructure to meet its long-term copper consumption requirements, building processing capacity that assumed continued growth in global mine supply. That supply growth did not materialise at the expected pace, leaving a structural gap between what Chinese smelters can process and what miners can deliver. In addition, the copper supply crunch has intensified as project pipelines globally have failed to keep pace with demand.
Major Chilean Operations Under Pressure
Chile, which accounts for approximately 27% of global copper mine output according to USGS data, has experienced compounding supply disruptions from its two largest operators. Consequently, Chile's copper supply gap has become an increasingly critical variable in global concentrate availability.
Antofagasta revised its 2026 copper production guidance downward to 625,000-655,000 metric tonnes, from a prior range of 650,000-700,000 tonnes, following extreme rainfall events and power outages at its Los Pelambres operation. While production resumed within days of the disruption, ongoing repairs to pipeline platforms and water management infrastructure continue to constrain throughput for the full year. The reduction of 25,000-45,000 metric tonnes from an already tight concentrate market carries meaningful market weight.
Codelco, the world's largest copper producer by volume, abandoned its previously stated 1.34 million metric tonne annual production target after delivering 1.307 million tonnes in the prior year. The latest Codelco production update reinforces how sequential guidance reductions from both the dominant state-owned and private operators in Chile represent a cumulative mine supply headwind with multi-year implications. For broader context on the Chile copper outlook, structural output constraints appear set to persist well beyond 2026.
The VAT Scrap Constraint: An Underappreciated Supply Variable
One dynamic that receives insufficient attention in mainstream copper commentary is the tightening of tax-invoice compliance rules governing value-added tax on recycled copper in China. Stricter enforcement by Chinese tax authorities has reduced the volume of VAT-compliant scrap available to smelters, limiting their ability to substitute secondary feedstock for primary concentrate.
This regulatory tightening matters because copper scrap has historically served as a flexible safety valve for smelters facing concentrate shortages. With that valve partially closed, the feedstock scarcity embedded in negative treatment charges is amplified beyond what primary mine supply data alone would suggest.
How Negative Treatment Charges Redistribute Margin Upstream
Quantifying the Value Transfer to Mine Owners
The economic consequence of deeply negative TC/RCs is a direct and substantial transfer of value from processing operations to concentrate producers. To illustrate the scale of this redistribution:
Scenario A – Conventional Market (TC = +$80/tonne):
- The miner receives the copper price minus an $80/tonne processing fee
- The smelter earns an $80/tonne processing margin plus byproduct credits
Scenario B – Current Market (TC = -$175.7/tonne):
- The miner receives the copper price plus a $175.7/tonne feed premium
- The smelter absorbs a $175.7/tonne feed cost before byproduct credits
The per-tonne swing from +$80 to -$175.7 represents a value transfer of approximately $255.7 per tonne from smelters to concentrate producers. This is not a rounding error in processing economics; it is a wholesale redistribution of margin within the supply chain. Indeed, zero-dollar treatment charges signal a multi-year mine supply shortfall that is materially lifting the value of high-quality copper projects globally.
Producer Financial Outcomes Reflect the Structural Advantage
Antofagasta's first-half 2026 results illustrate how this margin transfer manifests in producer financials, compounded by a 36% increase in copper prices and a 46% increase in gold prices over the period. Understanding the underlying copper price drivers helps explain why producer balance sheets have strengthened so materially.
| Financial Metric | H1 2025 | H1 2026 | Change |
|---|---|---|---|
| Pretax profit | ~$1.16B | ~$2.0B | +72% |
| Operating cash flow | ~$1.81B | ~$2.77B | +53% |
| Interim dividend (cents/share) | 16.6¢ | 30.1¢ | +81% |
| Core earnings (EBITDA) | ~$2.24B | ~$2.84B | +27% |
Critically, these results were achieved despite a reduction in production guidance. The combination of higher realised prices, favourable TC/RC positioning, and gold byproduct exposure allowed cash flow to expand even as volume contracted.
Chinese Copper Demand: Structural Versus Cyclical Signals
Why Demand Remains Expansionary Despite Price Sensitivity
Copper futures falling below $6.55/lb triggered concern about demand deterioration, but distinguishing between cyclical price sensitivity and structural demand retreat is essential for accurate market interpretation. S&P Global projects Chinese copper demand growth of approximately 452,500 metric tonnes in 2026, a forecast that reflects demand drivers operating largely independently of short-term price fluctuations.
The structural pillars of Chinese copper consumption include:
-
Electric vehicle production: EVs require approximately 80 kilograms of copper per vehicle, compared to roughly 25 kilograms for internal combustion equivalents. As China's EV output continues scaling, this differential creates a durable consumption increment.
-
Power grid expansion: Multi-year transmission infrastructure programmes require sustained copper inputs at both generation and distribution stages.
-
Renewable energy installation: Solar and wind projects are copper-intensive across generation equipment, cabling, and transformer infrastructure.
-
Wire rod manufacturing: Downstream fabrication of wire rod remains the primary channel through which refined copper enters industrial use.
The Yangshan Premium as a Real-Time Demand Barometer
The Yangshan copper premium — the additional cost Chinese importers pay above LME prices for physical copper delivered into bonded warehouses — provides a real-time read on import appetite that often leads changes in official demand data by several weeks.
| Yangshan Premium Level | Market Interpretation |
|---|---|
| Above $115/tonne | Strong import demand; buyers accepting significant above-LME premiums |
| $96-$115/tonne | Moderating demand; price sensitivity beginning to suppress marginal buying |
| Below $96/tonne | Weakening import appetite; elevated prices restricting buying activity |
| Near zero or negative | Severe demand contraction or meaningful domestic oversupply |
The current reading of $96/tonne, retreated from a recent high of $115/tonne, places the market at the lower boundary of a neutral demand zone. This confirms price-sensitive buying has softened but does not yet signal a structural collapse in import appetite. However, the dynamics surrounding copper treatment charges and Chinese demand will continue to dictate how this premium evolves through the remainder of the year.
The next major ASX story will hit our subscribers first
The Three-Scenario Framework for Copper Through Year-End
Bull Case: Supply Constraints Deepen and Demand Recovers
If treatment charges remain below -$100/tonne, Chinese refined copper output records a third consecutive annual decline, and the Yangshan premium recovers from $96/tonne back toward $115/tonne within one quarter, the conditions for sustained copper price strength above $6.55/lb are intact. Mine owners would retain their structural margin advantage, and physical tightness would continue to underpin pricing.
Base Case: Elevated Prices With Constrained Upside
TC/RCs stabilise between -$100 and -$150/tonne, refined output declines moderate without reversing, and the Yangshan premium holds near $96-$105/tonne. Copper trades in a range broadly consistent with recent levels, with mine owners retaining their processing margin advantage over smelters.
Bear Case: Demand Weakness Overcomes Supply Tightness
If the Yangshan premium falls decisively below $96/tonne, a projected 96,000 metric tonne refined copper surplus materialises in physical markets, and treatment charges begin recovering toward -$38.4/tonne, the concentrate availability signal would improve and smelter margins would begin recovering at the expense of mine-owner pricing power.
Key Indicators for Tracking the TC/RC Cycle
Rather than monitoring spot copper prices alone, sophisticated market participants track three leading indicators that collectively provide earlier and more granular signals:
-
Imported concentrate treatment charges: The most direct measure of feedstock scarcity. A sustained recovery above -$100/tonne for a full calendar month would signal improving concentrate availability and a shift in margin back toward smelters.
-
China monthly refined copper output: August 2026 output is forecast at 1.05 million tonnes, down 2.83% year-on-year, following a July decline of 3.18% year-on-year against a prior forecast of 1.07 million tonnes. A return to positive year-on-year growth would indicate feedstock constraints easing.
-
Yangshan copper premium: Movement back toward $115/tonne would confirm recovering import demand; sustained weakness below $96/tonne would reinforce the bear case.
The interplay between these three indicators tells a more complete story than any single data point. Treatment charges reveal supply-side stress, refined output measures processing system response, and the Yangshan premium captures real-time demand. Together, they form a triangulated signal system for copper treatment charges and Chinese demand conditions — and for the broader trajectory of the global copper market.
Disclaimer: This article is intended for informational purposes only and does not constitute financial advice. Copper market forecasts, scenario analyses, and financial projections referenced herein involve inherent uncertainty. Past performance of commodity prices and producer financials is not indicative of future results. Investors should conduct their own independent research and seek qualified financial advice before making investment decisions.
Want to Stay Ahead of the Next Major Copper Discovery?
Discovery Alert's proprietary Discovery IQ model scans ASX announcements in real time, instantly identifying significant mineral discoveries — including copper — and turning complex data into actionable investment insights before the broader market reacts. Start your 14-day free trial today and see why historic discoveries have delivered extraordinary returns for investors who moved early.