
June 10, 2026
Refinery Throughput and the Hidden Engine Driving Crude Drawdowns
Every summer, a quiet but powerful force reshapes the U.S. oil market from the inside out. Long before headlines capture the story, refinery operators begin throttling up throughput in anticipation of peak seasonal demand. Crude flows in at accelerating rates, gasoline and distillate production climbs, and commercial stockpiles quietly erode week after week. What looks like a supply story is often, at its core, a demand-driven consumption event playing out in slow motion across the nation's refining infrastructure.
That seasonal mechanism is now fully engaged, and the inventory data emerging from the week ending June 5, 2026 captures it in sharp relief. U.S. oil inventories continue their slide as refiners boost runs, and the numbers embedded in the latest EIA Weekly Petroleum Status Report tell a story that extends well beyond a single data point.
When big ASX news breaks, our subscribers know first
Understanding the EIA Weekly Petroleum Report: A Framework for Market Analysis
What the EIA's Weekly Data Actually Measures
The U.S. Energy Information Administration releases its Weekly Petroleum Status Report every Wednesday, drawing on survey data collected from refiners, importers, and storage operators across the country. The report measures commercial crude inventories held in tanks and pipelines, separate from the Strategic Petroleum Reserve, which is a government-controlled emergency stockpile and an entirely different variable in the supply equation.
The figure most traders and analysts focus on is the week-on-week change in commercial crude stocks. However, the more instructive benchmark is how those stocks compare to the five-year seasonal average for any given time of year. That comparison filters out the noise of weekly fluctuation and reveals whether the market is genuinely tighter than historical norms. A deficit relative to the five-year average is the signal that matters most to medium-term price formation.
How Commercial Crude Stockpiles Differ from Strategic Petroleum Reserves
Commercial stockpiles represent crude held by private market participants for operational use, primarily refineries drawing on nearby tank farms and pipeline hubs like Cushing, Oklahoma. The Strategic Petroleum Reserve, by contrast, holds crude in underground salt caverns and is subject to government release decisions rather than market dynamics. Conflating the two produces a distorted picture of actual supply availability. As of the latest reporting period, the analysis here focuses exclusively on commercial inventories.
Why the Five-Year Seasonal Average Is the Benchmark That Matters
The five-year average provides a seasonally adjusted baseline, accounting for the fact that inventories naturally rise and fall throughout the year. Refineries typically draw down crude stocks during the summer processing season and rebuild them heading into winter. When current stockpiles sit measurably below that rolling benchmark, it signals that supply is tighter than the historical norm for that calendar period — a condition that has historically supported firmer crude prices when sustained over multiple consecutive weeks.
What Do the Latest U.S. Crude Inventory Numbers Reveal?
Key Metrics at a Glance: Week Ending June 5, 2026
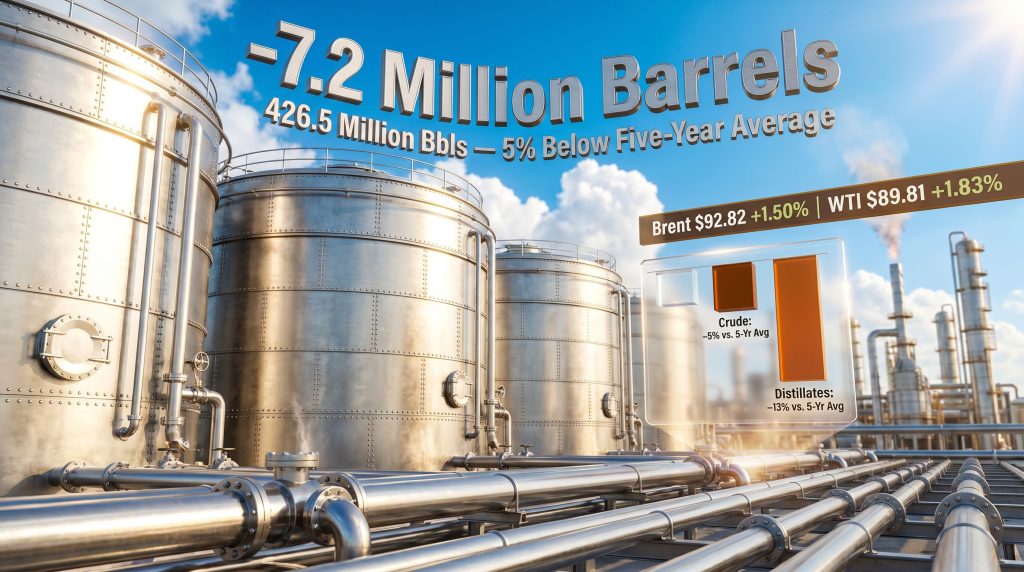
The latest EIA data release presents a picture of broad-based tightening across the petroleum complex. The headline crude drawdown of 7.2 million barrels was substantial, but the full significance emerges when placed alongside the product-level data. Furthermore, crude oil price trends suggest that sustained drawdowns of this magnitude have historically preceded notable benchmark movements.
| Metric | Reported Figure | Context |
|---|---|---|
| EIA Crude Inventory Change | -7.2 million barrels | Largest single-week draw in recent cycle |
| API Crude Estimate (Prior Day) | -9.119 million barrels | Directionally confirmed by EIA |
| Commercial Crude Stockpiles | 426.5 million barrels | 5% below five-year seasonal average |
| Crude Processing Rate | ~15.7 million bpd | Summer-season demand ramp |
| Distillate Inventories | -200,000 barrels (week) | 13% below five-year average |
| Gasoline Inventories | +200,000 barrels (week) | Modest build after prior +3.4M gain |
| Gasoline Production Rate | 9.7 million bpd | Elevated for seasonal demand |
| Distillate Production Rate | 5.2 million bpd | Holding under margin pressure |
| Total Products Supplied (4-wk avg.) | 20.6 million bpd | Up 3.5% year-over-year |
| Gasoline Demand (4-wk avg.) | 8.8 million bpd | Consistent with driving season |
| Distillate Demand (4-wk avg.) | 3.7 million bpd | Up 7.2% year-over-year |
Key Insight: The simultaneous contraction of crude stockpiles alongside rising refinery throughput is a textbook configuration for supply tightening. When sustained across multiple reporting weeks, this pattern has historically preceded upward pressure on crude benchmarks, particularly when the five-year average deficit widens rather than narrows.
How Do Refinery Run Rates Drive Crude Inventory Drawdowns?
The Mechanics of Refinery Throughput and Crude Consumption
Refineries are the primary consumers of commercial crude oil in the United States. When utilisation rates rise, crude intake rises proportionally. The relationship is direct and measurable: a refinery complex running at 92% utilisation versus 86% utilisation processes meaningfully more crude per day, and across a national system handling roughly 15 to 16 million barrels per day, each percentage point of incremental utilisation translates to hundreds of thousands of additional barrels consumed daily.
This arithmetic compounds over successive weeks. A sustained shift upward in national utilisation rates does not produce a one-time inventory reduction. It generates persistent weekly drawdowns that gradually erode the buffer between current stockpiles and historical seasonal norms.
Summer Season Refinery Ramp-Up: Why Q2 and Q3 Are Critical Windows
The second and third quarters represent the core of the U.S. refining season. Refiners typically conduct maintenance turnarounds in early spring, then ramp throughput heading into Memorial Day and sustain elevated runs through Labour Day. This window aligns with peak gasoline demand from the summer driving season and elevated distillate consumption tied to agricultural operations and freight activity.
A lesser-known aspect of this cycle is the crack spread dynamic that governs refiner incentives. The crack spread, which represents the margin between crude input costs and refined product output prices, tends to widen in late spring as product demand accelerates faster than crude prices. Wider spreads incentivise refiners to maximise throughput, which in turn accelerates crude drawdowns. Consequently, the inventory signal and the refining economics are mutually reinforcing during this seasonal window.
What Elevated Utilisation Rates Signal About Refining Margin Incentives
When refiners push utilisation toward the upper end of their operational range, it is rarely accidental. These decisions reflect real-time margin calculations. Refiners monitor the spread between the cost of crude input and the value of gasoline and distillate output on a daily basis, and throughput decisions respond accordingly. An environment where distillate demand is growing at 7.2% year-over-year while distillate stocks sit 13% below the five-year average creates exactly the margin environment that incentivises maximum production, which in turn sustains crude drawdown pressure.
Is the Crude Inventory Decline a Demand Signal or a Supply Constraint?
Separating Demand Pull from Supply-Side Tightening
One of the more nuanced questions in petroleum market analysis is whether a given inventory decline reflects genuine demand growth or a supply-side gap. In the current reporting cycle, the evidence leans heavily toward the demand-pull explanation. Total petroleum products supplied, the EIA's primary proxy for domestic consumption, averaged 20.6 million barrels per day over the most recent four-week period, representing a 3.5% increase over the equivalent period in the prior year.
Year-over-year demand growth of that magnitude is not seasonal noise. It reflects underlying expansion in consumption across the petroleum complex. In addition, OPEC demand forecasts have similarly pointed toward firmer-than-expected consumption figures in key markets, adding further context to the domestic picture:
- Total products supplied averaged 20.6 million bpd, up 3.5% year-over-year
- Distillate demand reached a four-week average of 3.7 million bpd, up 7.2% year-over-year
- Gasoline consumption held at 8.8 million bpd, consistent with peak driving season patterns
- Crude processing rates of approximately 15.7 million bpd confirm refiners are absorbing supply at an accelerated pace
The distillate figure deserves particular attention. Diesel and heating oil consumption are closely tied to freight volumes, agricultural activity, and industrial output. A 7.2% year-over-year increase in this category suggests that economic activity in goods-producing and transport sectors is running above prior-year levels, adding a macroeconomic dimension to what might otherwise appear to be a purely seasonal inventory story.
Dual Confirmation: When API and EIA Data Converge
The American Petroleum Institute releases private, survey-based crude inventory estimates each Tuesday, one day before the EIA's official government report. These two datasets draw on different survey methodologies and sample populations, meaning that when they both point in the same direction with similar magnitudes, the probability that either reading represents an outlier declines substantially.
Analytical Framework: The API's estimate of a 9.1 million barrel draw followed by the EIA's confirmed 7.2 million barrel reduction represents dual-source convergence. Both readings are directionally aligned and numerically comparable. For market participants assessing the reliability of any single inventory signal, this kind of cross-source confirmation significantly strengthens the fundamental case for tighter near-term crude balances.
What Are Crude Oil Prices Doing in Response to Inventory Tightening?
WTI and Brent Price Movements: A Snapshot
| Benchmark | Price (June 10, 2026) | Daily Change | Notable Context |
|---|---|---|---|
| Brent Crude | $92.82/bbl | +$1.37 (+1.50%) | Down ~$5.40 from prior week |
| WTI Crude | $89.81/bbl | +$1.61 (+1.83%) | Positive intraday momentum |
Why Prices Can Rise and Fall in the Same Week
The data above captures a useful paradox in modern oil market behaviour. On the day of the EIA inventory release, both Brent and WTI were trading higher. Yet Brent had shed roughly $5.40 per barrel compared to the same point the prior week. This intraweek oil price volatility guide reflects the degree to which competing forces are simultaneously pulling at crude prices.
The Disconnect Between Inventory Signals and Spot Price Behaviour
Inventory fundamentals are one input into a multi-variable pricing model that markets run continuously. Even when commercial stockpiles are 5% below seasonal norms and drawdowns are accelerating, prices can move sideways or decline if forward-looking participants are pricing in anticipated supply recovery, demand softening in major importing economies, or shifts in OPEC+ production policy.
This disconnect between current inventory tightness and spot price behaviour is a recurring feature of oil markets and one that trips up many retail participants who expect a linear relationship between stockpile levels and benchmark prices. The market is always trading the future, not the present.
Geopolitical Overlays: How External Risk Factors Complicate the Inventory-Price Relationship
The current market environment carries an unusually dense layer of geopolitical complexity. Concerns around Middle East supply disruptions, OPEC+ output decisions, and macroeconomic demand uncertainty in major importing nations are all competing with the bullish inventory signal in real time. This helps explain why a fundamentally tighter-than-average supply picture has not yet translated into sustained upward price momentum.
Market Paradox: Fundamentally tight commercial inventories do not automatically produce higher prices when macro-level forces are pulling in the opposite direction. Understanding this divergence is essential for anyone attempting to use inventory data as a price forecasting tool.
The next major ASX story will hit our subscribers first
How Do Gasoline and Distillate Inventories Fit Into the Broader Picture?
Gasoline: A Modest Build Within a Tightening System
The gasoline picture is more nuanced than the crude headline. Despite a modest 200,000 barrel weekly build — which extended a prior week's 3.4 million barrel gain — production has climbed to 9.7 million barrels per day to meet seasonal demand. The fact that gasoline inventories are building modestly while crude stocks are falling sharply suggests that refinery conversion efficiency is doing its job, but that the crude-to-product pipeline is being stretched to capacity.
Distillates: A More Concerning Deficit
Middle distillates present a more structurally concerning picture than either crude or gasoline. U.S. shale slowdown dynamics have further complicated the domestic supply picture, as reduced upstream activity limits the incremental volumes available to offset refinery demand:
- Distillate stocks fell by 200,000 barrels in the most recent reporting week
- Inventories now sit 13% below the five-year seasonal average, a significantly deeper deficit than the crude shortfall
- Production averaged 5.2 million barrels per day, which appears insufficient to close the gap given current demand trajectory
- The four-week average demand of 3.7 million bpd is running 7.2% above prior-year levels
Comparative Inventory Deficit Summary
| Product Category | Position vs. Five-Year Seasonal Average |
|---|---|
| Commercial Crude Oil | 5% below seasonal norm |
| Distillate Fuels | 13% below seasonal norm |
| Motor Gasoline | Near-neutral with modest builds |
The distillate deficit is the figure that warrants the closest monitoring. Diesel underpins freight, construction, agriculture, and manufacturing in ways that gasoline does not. A persistent supply shortfall in this category carries implications that reach well beyond energy markets into the broader cost structure of the economy.
What Does a Sustained Crude Drawdown Cycle Mean for Near-Term Market Tightness?
Defining Consecutive Drawdowns and Their Historical Significance
A single large weekly inventory decline is notable but not unusual. What carries greater analytical weight is a sequence of consecutive drawdowns that progressively erode the buffer between current stockpiles and historical seasonal norms. Oil inventories headed toward multi-decade lows is a scenario that analysts are increasingly monitoring, particularly when commercial crude stocks move from near-average to 5% below average over a compressed timeframe, limiting the system's capacity to absorb unexpected demand spikes or supply disruptions.
Hypothetical Scenario: What Happens If Refinery Runs Stay Elevated Through Q3?
Assuming refinery utilisation remains above 90% through August 2026 — a plausible scenario given current margin incentives — the downstream consequences could include:
- Crude intake remaining elevated at approximately 15 to 16 million bpd through peak summer
- Commercial stockpiles potentially approaching multi-year lows if import volumes do not compensate
- Distillate deficits widening further, creating upward price pressure on diesel and heating oil
- WTI potentially finding structural price support from supply-side tightness even if demand growth moderates in the back half of the year
Disclaimer: The scenario above is speculative and based on seasonal trend assumptions. Actual outcomes will depend on OPEC+ production decisions, domestic output levels, import flows, and macroeconomic demand conditions.
How Does U.S. Inventory Data Interact with Global Oil Market Dynamics?
OPEC+ Output Decisions and Their Effect on U.S. Import Flows
U.S. commercial inventory levels do not develop in isolation. Net crude imports from OPEC+ producers are a critical variable, and OPEC's market influence extends directly to U.S. storage terminals within weeks as tanker delivery schedules shift in response to quota adjustments. A tightening of OPEC+ output during a period of elevated domestic refinery demand has a compounding effect on commercial stockpiles that the weekly EIA data will eventually capture.
The Strategic Petroleum Reserve: A Separate Variable in the Equation
The SPR adds a layer of complexity that weekly commercial inventory data alone cannot resolve. At various points, SPR releases have temporarily masked underlying commercial tightness by supplementing available supply. Conversely, SPR replenishment activity competes with refiners for available crude volumes, potentially accelerating commercial drawdowns. Analysing commercial inventories without tracking SPR activity produces an incomplete picture of actual domestic supply availability.
Import Dependency and Domestic Production as Counterweights
U.S. domestic crude production, concentrated in basins such as the Permian, Eagle Ford, and Bakken, serves as the primary counterweight to rising refinery demand. When production growth keeps pace with refinery intake, inventory drawdowns moderate. However, when production plateaus or declines — even temporarily due to weather or infrastructure constraints — the refinery throughput machine accelerates stockpile erosion at a pace that import flows may not fully offset in the short term.
Broader Context: The EIA weekly report is best understood as one node in a global supply network. Its signals are most meaningful when interpreted alongside domestic production trends, import flows, SPR activity, and OPEC+ policy, not as a standalone indicator.
Frequently Asked Questions: U.S. Oil Inventories and Refinery Runs
What does it mean when crude inventories fall below the five-year seasonal average?
When commercial stockpiles drop below the five-year average for any given time of year, it indicates the market is holding less supply than historical norms suggest is typical. A 5% deficit is a moderate but meaningful signal that tends to support firmer crude pricing when sustained across multiple reporting periods, particularly if it is accompanied by evidence of genuine demand growth rather than simply reduced imports.
Why do refiners increase throughput during summer?
The summer driving season generates peak gasoline demand, and refiners respond by maximising crude processing rates to capture widening crack spreads. Higher throughput means more crude consumed daily, which directly accelerates the depletion of commercial stockpiles at Cushing and other storage hubs.
What is the difference between API and EIA inventory data?
The API releases private, survey-derived estimates each Tuesday, one day before the EIA's official figures. The EIA report draws on a broader survey base and is considered the authoritative benchmark. When both datasets point toward significant drawdowns in the same week, it meaningfully strengthens the signal's credibility compared to a reading from either source alone.
Why is the distillate deficit more concerning than the crude deficit?
With distillate stocks running 13% below the five-year average versus a 5% shortfall for crude, the middle distillate segment is in a tighter supply position relative to historical norms. Because diesel and heating oil are essential inputs for freight, agriculture, and industrial production, a sustained deficit in this category carries broader economic implications than a comparable crude shortfall. Furthermore, as EIA crude inventory data confirms, the trajectory of distillate stocks has shown no meaningful recovery in recent reporting periods.
Does a crude drawdown automatically push benchmark prices higher?
No. While tightening inventories are a classically bullish fundamental signal, crude prices respond to a wide range of variables simultaneously, including OPEC+ production policy, macroeconomic demand forecasts, currency movements, and geopolitical risk premiums. Markets can price in anticipated supply recovery even while current stockpiles are actively declining, which explains why strong inventory drawdowns do not always produce immediate price responses.
Key Takeaways: What the Inventory Data Tells Us About Where the Oil Market Is Headed
The picture assembled from the week ending June 5, 2026 points toward a market in which supply buffers are being compressed from multiple directions simultaneously. U.S. oil inventories continue their slide as refiners boost runs, and the evidence supporting this conclusion is drawn from multiple converging data sources:
- Commercial crude inventories have declined to 426.5 million barrels, sitting 5% below the five-year seasonal average
- Refinery throughput near 15.7 million bpd is the primary consumption driver behind the drawdown
- Distillate inventories represent the more acute pressure point at 13% below historical seasonal norms
- Year-over-year demand growth of 3.5% for total products and 7.2% for distillates confirms genuine consumption expansion
- Dual confirmation from API and EIA data in the same reporting week strengthens the fundamental signal
- Crude prices are responding to inventory tightness but remain subject to competing geopolitical and macroeconomic forces that complicate the fundamental trade
Investors, traders, and energy market participants tracking whether U.S. oil inventories continue their slide as refiners boost runs in the weeks ahead should monitor not only the headline crude figure but the distillate balance, refinery utilisation trends, and the pace of any SPR activity or import volume shifts. Those variables, taken together, will determine whether the current drawdown cycle deepens into a more structurally significant supply event or moderates as the seasonal refining peak begins to plateau.
Want to Stay Ahead of the Next Major Commodity Discovery?
While energy market participants track crude drawdowns and refinery dynamics, Discovery Alert's proprietary Discovery IQ model scans ASX announcements in real time, delivering instant notifications on significant mineral discoveries across 30+ commodities — turning complex data into actionable investment opportunities before the broader market catches on. Begin your 14-day free trial at Discovery Alert today and position yourself ahead of the next major find.