June 16, 2026
The Physical Oil Market Sends a Signal Worth Watching
When crude oil futures gain on spot demand, the instinct is to look first at geopolitics, central bank decisions, or the latest OPEC+ communique. However, some of the most durable and meaningful price signals in commodity markets originate not in the realm of paper trading or policy announcements, but in the unglamorous mechanics of physical supply and demand. When buyers need barrels today, and they are willing to pay more to secure them, that urgency eventually propagates through the entire futures curve.
Understanding why this happens, and what it means for traders, portfolio managers, and energy observers, requires looking beneath headline price moves to the architecture of how crude oil markets actually function. For a broader view, crude oil price trends in 2025 provide essential context for interpreting these signals.
When big ASX news breaks, our subscribers know first
What Spot Demand Actually Means in Oil Markets
The Mechanics Behind Spot Versus Futures Pricing
The crude oil market operates across two distinct but deeply interconnected pricing layers. The spot market involves the purchase of physical crude for near-immediate delivery, typically settled within a few business days of the transaction. These are real barrels changing hands between producers, traders, and refiners who need feedstock to keep their facilities operating.
Futures contracts, by contrast, are standardised financial agreements to buy or sell a defined quantity of crude at a specified price on a future delivery date. These instruments serve both as hedging tools for commercial participants and as speculative vehicles for financial players who never intend to take physical delivery.
The relationship between the two is not passive. When physical spot demand strengthens, it creates upward pressure that arbitrageurs transmit into the futures market. Traders who identify a profitable spread between the current spot price and a futures contract will buy physical crude and simultaneously sell the equivalent futures position, gradually compressing the gap between the two price levels.
Contango, Backwardation, and What Each Signals
The shape of the futures curve reveals the market's collective view of near-term supply adequacy. In a contango structure, futures contracts for delivery further in the future trade at a premium over nearby contracts. This reflects the cost of carrying inventory: storage fees, insurance, and financing expenses that accumulate over time. Contango tends to emerge when supply is comfortable and storage is well-utilised.
Backwardation inverts this relationship. When near-term contracts command a premium over longer-dated ones, it signals that the market perceives an immediate shortage of physical supply relative to current demand. Historically, backwardation in crude oil futures has preceded periods of sustained price strength, because it reflects genuine competition for available barrels rather than speculative positioning.
Backwardation in the crude oil futures curve is widely read by commodity market practitioners as a structural indicator that physical inventories are insufficient to comfortably meet present demand, a condition that has historically coincided with extended upward price cycles.
How Crude Oil Futures Are Priced: A Multi-Variable Framework
The Core Inputs Traders Monitor Daily
No single variable drives crude oil futures prices in isolation. Experienced market participants track an interconnected set of inputs, each capable of shifting sentiment and positioning:
| Pricing Variable | Influence on Futures | Directional Signal |
|---|---|---|
| Spot market demand strength | Direct upward transmission | Bullish |
| Global inventory levels (EIA data) | Inverse relationship with price | Bearish when rising |
| Geopolitical supply disruptions | Adds risk premium | Bullish |
| GDP growth in major economies | Proxy for consumption demand | Bullish during expansion |
| US dollar strength | Reduces affordability for non-USD buyers | Bearish when USD appreciates |
| OPEC+ production policy | Controls supply volume | Bullish when cutting |
Why Short-Term Inelasticity Amplifies Price Moves
One of the most important and least widely understood characteristics of crude oil markets is the structural inelasticity of both supply and demand in the short run. Refineries cannot rapidly switch to alternative feedstocks, and bringing new production capacity online from exploration to first barrel typically requires months to years of lead time.
This rigidity means that even relatively modest imbalances between supply and demand produce disproportionately large price responses. Historical data from periods of unexpected supply disruption demonstrates that output reductions of as little as one to two percent of global production have triggered double-digit percentage swings in crude futures prices. This amplification effect is a permanent feature of energy markets that investors and traders must account for in any risk framework.
What Is Driving the Current Crude Oil Futures Gain on Spot Demand
Indian Domestic Futures: MCX Price Movement Analysis
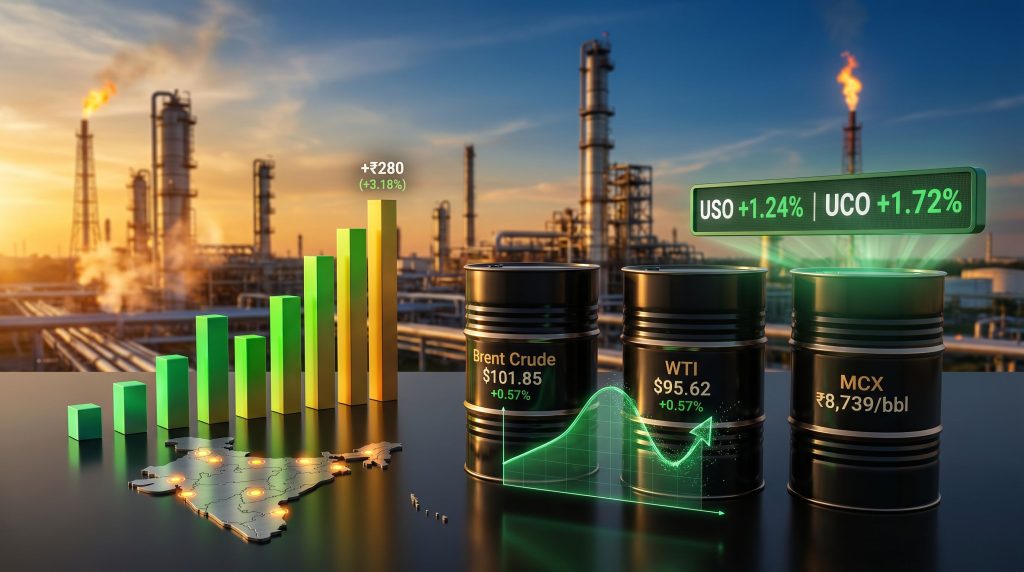
India's Multi Commodity Exchange provided a clear illustration of spot-driven futures pricing dynamics on May 7, 2026. MCX crude oil futures for June delivery recorded a gain of ₹15, or 0.17 percent, settling at ₹8,739 per barrel across 733 lots. Market analysts attributed the move to a buildup of long positions by participants responding to firm physical demand in the spot market. According to Deccan Herald's commodity coverage, such spot-demand-led moves reflect genuine commercial appetite rather than speculative noise.
Looking at the broader MCX term structure painted an even more instructive picture of the demand signal:
- May delivery contracts advanced by ₹280, or 3.18 percent, reaching ₹9,097 per barrel, indicating stronger near-term buying urgency
- April delivery contracts climbed ₹159, or 1.69 percent, to ₹9,554 per barrel, with a portion of that premium attributed to supply disruption risk perceptions in West Asia
- Elevated trading volumes across 733 lots in a single session pointed to active commercial and institutional participation, rather than thin speculative activity
The steepening premium of near-term contracts over deferred delivery months is itself a form of backwardation signal in the domestic market, reinforcing the interpretation that physical demand is the primary driver.
Global Benchmark Performance: WTI and Brent
International crude benchmarks moved in parallel on the same date, adding a global dimension to what could otherwise be read as a localised Indian market event:
| Benchmark | Price (USD/bbl) | Percentage Change | Trading Venue |
|---|---|---|---|
| West Texas Intermediate (WTI) | $95.62 | +0.57% | NYMEX, New York |
| Brent Crude | $101.85 | +0.57% | ICE Futures Europe |
| WTI Intraday High | $96.47 | Peak range | NYMEX |
| WTI Intraday Low | $91.98 | Trough range | NYMEX |
The fact that both WTI and Brent advanced by an identical 0.57 percent is analytically significant. Synchronised gains across geographically distinct benchmarks reflect broad-based demand optimism rather than a region-specific supply story. Furthermore, Brent sustaining a position above the psychologically important $100 per barrel threshold reinforces bullish sentiment across international supply chains and refiner procurement decisions.
Bullish Sentiment Across Crude Oil ETFs
Exchange-traded funds tracking crude oil exposure confirmed the directional signal from futures markets:
- USO (United States Oil Fund) advanced 1.24 percent to $73.36, a widely tracked vehicle used by both institutional allocators and retail investors seeking liquid crude oil exposure
- UCO (ProShares Ultra Bloomberg Crude Oil) gained 1.72 percent to $22.56, with the leveraged structure amplifying the underlying directional move
Simultaneous inflows into both non-leveraged and leveraged crude ETFs alongside futures gains represents convergent bullish positioning across multiple market layers, a configuration that commodity practitioners typically associate with genuine demand-pull dynamics rather than short-term speculative noise.
Structural Factors Sustaining Upward Pressure on Oil Prices
Geopolitical Risk Premiums in West Asia
The energy market's relationship with geopolitical risk is neither linear nor easily quantifiable, but it is persistent. Furthermore, oil geopolitical risks in the West Asian region have historically contributed risk premiums to Brent pricing that range from several dollars per barrel during moderate tension to significantly higher levels during acute conflict scenarios.
These premiums are not always immediately visible in spot transactions, where existing contractual obligations continue to be honoured. Instead, they tend to be priced most visibly into futures contracts covering delivery two to six months forward, where uncertainty about supply continuity is greatest. The MCX April delivery gain that was partly attributed to West Asian risk factors illustrates precisely this dynamic operating in the Indian domestic futures market.
Macroeconomic Demand Linkages
Crude oil consumption tracks economic output with a relatively tight correlation across the world's largest consuming economies. The United States, the European Union, and China collectively account for the dominant share of global refined product demand, and periods of sustained GDP expansion in these blocs historically translate into meaningful increases in industrial and transportation fuel consumption.
The current global growth trajectory, while characterised by regional unevenness, continues to support crude consumption at levels that keep physical supply balances tighter than they were during the demand destruction period of the early pandemic years. This baseline demand floor provides structural support beneath short-term price fluctuations. In addition, the trade war oil impact on global demand patterns remains a variable worth monitoring closely.
Producer and Refiner Hedging Behaviour
One of the lesser-understood dynamics in crude oil futures markets is the role of hedging flows from commercial participants on both sides of the supply chain.
- Upstream producers lock in revenue certainty by selling futures when spot prices rise, providing a natural ceiling effect that can temporarily cap futures upside but simultaneously confirms the underlying strength of spot market conditions
- Refiners purchase futures to hedge input costs when they anticipate demand growth for their products, adding incremental buying pressure to the futures curve
- The convergence of these opposing commercial flows creates what practitioners describe as natural price discovery bands, where the interaction of hedging activity and speculative positioning determines the equilibrium trading range
Consequently, commodity hedging strategies have become increasingly sophisticated as participants navigate tighter supply balances and elevated volatility.
The compression of producer selling pressure against refiner buying demand in futures markets creates a dynamic where price movements driven by genuine physical demand are ultimately more durable than those originating purely from speculative positioning.
How MCX Crude Oil Futures Differ From Global Benchmarks
The Currency Overlay Effect
MCX crude oil futures introduce a dimension of complexity that global benchmark analysis alone cannot capture. Because MCX contracts are denominated in Indian rupees and priced with reference to international benchmarks, primarily WTI, they incorporate a currency overlay that can amplify or dampen price movements relative to what dollar-denominated markets suggest.
When the US dollar strengthens against the Indian rupee, MCX crude prices can rise even when global benchmarks are trading flat or slightly lower in dollar terms, because more rupees are required to purchase the same dollar-denominated barrel. Conversely, a weakening rupee can produce MCX price gains that exceed what WTI or Brent movements would imply. Domestic import duties further separate MCX pricing from simple currency-adjusted international benchmarks.
Why Indian Spot Demand Matters Globally
India's position in global crude oil markets is frequently underestimated by observers focused primarily on US and European trading activity. As the world's third-largest crude oil importer, India processes approximately five million barrels per day across its refinery network, a volume that makes Indian spot purchasing activity a genuine input into global price formation rather than a passive reflection of it.
Rising MCX futures volumes and strengthening domestic prices are therefore meaningful signals for global market participants. When Indian refiners increase spot purchases, they are absorbing physical barrels that would otherwise be available to international markets, tightening the global supply balance and reinforcing upward pressure on international benchmarks.
The next major ASX story will hit our subscribers first
Bearish Risks That Could Reverse These Gains
Technical Resistance and Downside Scenarios
While the prevailing momentum in crude oil futures favours the upside, prudent risk frameworks require mapping the conditions under which the bullish narrative could unravel. Technical analysis frameworks identify potential selling pressure zones near the $61 per barrel level on WTI, with deeper downside targets in the $56 to $58 per barrel range if momentum reverses materially.
The primary catalyst for such a reversal would likely emerge from EIA weekly petroleum status reports. These weekly inventory data releases are among the single most market-moving scheduled events in commodity markets, capable of shifting trader positioning significantly within hours of publication. A sustained series of unexpected inventory builds would undermine the spot demand narrative that is currently supporting futures prices. You can monitor live benchmark prices through Trading Economics' crude oil data for real-time reference.
Macro Headwinds: Dollar Strength and Demand Destruction
Two macroeconomic forces have historically proven capable of reversing oil price rallies even in the presence of genuine underlying demand:
- US dollar appreciation: A materially stronger dollar reduces the purchasing power of non-US buyers for a commodity priced in dollars, compressing import volumes and softening spot demand from emerging market economies including India
- Consumer demand destruction: When retail fuel prices remain elevated for extended periods, consumers and businesses adapt by reducing discretionary travel and fuel consumption. This threshold effect has historically emerged when Brent sustains levels above $100 to $110 per barrel for prolonged periods
Central bank tightening cycles in major economies introduce an additional layer of demand-side risk by constraining GDP growth and reducing industrial energy consumption, creating the conditions for a demand-led price correction even without any change in physical supply.
OPEC+ Production Policy as a Wildcard
The production decisions of OPEC+ member states represent perhaps the most unpredictable single variable in crude oil price forecasting. OPEC's market influence is such that any unexpected decision to increase production quotas, whether driven by member state budget pressures, geopolitical realignments, or compliance failures, would add supply-side weight capable of reversing spot-driven futures gains relatively quickly.
Conversely, extensions of existing production restraint agreements or improvements in compliance from historically under-producing member states would reinforce the current trajectory and provide additional fundamental support beneath futures prices.
How Investors Should Interpret This Signal
Positioning Frameworks for Different Market Participants
Different categories of market participant draw different actionable conclusions from spot-driven futures gains:
For institutional energy traders:
- Spot-driven futures gains combined with rising open interest represent a genuine demand signal, not speculative noise
- The spread between prompt contracts and three-month forward delivery should be monitored for backwardation confirmation
- EIA inventory data remains the primary near-term catalyst capable of either validating or invalidating the bullish narrative
For macro-oriented portfolio managers:
- Rising crude prices function as a leading indicator for energy sector earnings upgrades and potential consumer price inflation
- Combining energy equity exposure with futures positioning allows participation in both the commodity price move and the corporate earnings leverage it generates
- Currency-adjusted analysis is essential for investors in non-dollar-denominated markets
For retail and ETF-focused investors:
- USO provides straightforward crude oil exposure without the operational complexity of direct futures trading
- UCO amplifies both gains and losses through leverage and is suited only to short-term tactical positioning with active risk management
- Leveraged instruments require a clear directional thesis and defined exit parameters before entry
Reading the Broader Energy Cycle
Energy market practitioners consistently distinguish between two categories of price rally: those that originate in paper markets through speculative positioning, and those that begin in the physical market through genuine supply and demand imbalances. The latter category has historically produced more durable price uptrends because it reflects real-world consumption dynamics that take time to reverse.
The current configuration, combining strength in Indian domestic spot demand on MCX, synchronised gains across WTI and Brent, and rising ETF inflows, exhibits the multi-layered confirmation pattern that commodity analysts associate with physical demand-led price cycles. This represents a pattern where crude oil futures gain on spot demand in ways that are fundamentally distinct from purely speculative momentum. The EIA's spot price data offers a reliable reference point for tracking these underlying physical market dynamics over time.
Frequently Asked Questions: Crude Oil Futures and Spot Demand
What causes crude oil futures to gain on spot demand?
Physical demand strength in spot markets drives traders and arbitrageurs to build futures positions, compressing the spread between spot and forward prices. Firm physical offtake signals that available supply is being efficiently absorbed, reducing surplus inventory fears and providing fundamental support for bullish futures positioning.
What is the difference between WTI and Brent crude?
WTI is a light, sweet crude benchmark primarily traded on NYMEX in New York, reflecting North American production and refining dynamics. Brent, traded on ICE Futures Europe, serves as the reference price for approximately two-thirds of globally traded crude, incorporating seaborne supply from the North Sea, West Africa, and Middle Eastern export routes.
How does MCX crude oil pricing relate to international benchmarks?
MCX futures are denominated in Indian rupees and priced with reference to international crude benchmarks, primarily WTI, adjusted for the prevailing USD/INR exchange rate and applicable import duties. Price movements on MCX therefore reflect both global crude dynamics and domestic currency fluctuations simultaneously.
What is backwardation in oil futures markets?
Backwardation describes the condition where near-term futures contracts trade at a premium over longer-dated ones. It typically indicates that immediate physical demand or supply constraints are creating competition for available barrels, a structural condition historically associated with bullish crude price cycles.
Why do oil prices respond sharply to geopolitical events?
Crude oil supply chains are concentrated in geopolitically sensitive regions, meaning disruptions to production or transit infrastructure can remove significant volumes from global supply rapidly. Combined with the short-term inelasticity of both supply and demand, even relatively small supply shocks produce disproportionately large price responses in futures markets.
Key Takeaways: Crude Oil Futures Gain on Spot Demand
| Metric | Value | What It Signals |
|---|---|---|
| MCX June Delivery Gain | ₹15 (+0.17%) to ₹8,739/bbl | Domestic futures responding to spot demand |
| MCX May Delivery Gain | ₹280 (+3.18%) to ₹9,097/bbl | Stronger near-term demand urgency |
| MCX April Delivery Gain | ₹159 (+1.69%) to ₹9,554/bbl | West Asia risk premium partially embedded |
| WTI Price | $95.62/bbl (+0.57%) | Global benchmark confirming bullish trend |
| Brent Crude Price | $101.85/bbl (+0.57%) | Holding above $100 psychological threshold |
| WTI Intraday Range | $91.98 to $96.47/bbl | Meaningful intraday volatility profile |
| USO ETF Move | +1.24% to $73.36 | Retail and institutional demand confirmation |
| UCO ETF Move | +1.72% to $22.56 | Leveraged bullish positioning signal |
| MCX Trading Volume | 733 lots | Active commercial participation |
Disclaimer: This article is intended for informational and educational purposes only and does not constitute financial advice or a recommendation to buy or sell any financial instrument or commodity. Crude oil markets are subject to significant volatility, and past price patterns are not indicative of future performance. Readers should conduct their own due diligence and consult a qualified financial adviser before making any investment decisions. All price data referenced relates to market activity reported on May 7, 2026.
Want to Stay Ahead of the Next Major Commodity Discovery?
While crude oil spot demand signals offer valuable insights into broader commodity cycles, significant mineral discoveries on the ASX can generate equally compelling opportunities — often within hours of announcement. Discovery Alert's proprietary Discovery IQ model instantly identifies high-potential ASX mineral discoveries across 30+ commodities, delivering real-time alerts that empower both traders and long-term investors to act decisively. Explore historic discovery returns on Discovery Alert's dedicated discoveries page and begin your 14-day free trial today to position yourself ahead of the market.