June 21, 2026
When Geography Becomes Destiny: The Strait of Hormuz and the Price of Oil
Every so often, a single strip of water reminds the world just how fragile its energy infrastructure truly is. The Strait of Hormuz, a narrow maritime corridor barely 33 kilometres wide at its tightest point, sits between Iran and Oman and functions as the circulatory system for a significant portion of global crude oil supply. When military activity escalates in and around this passage, commodity futures markets do not wait for confirmed disruption to reprice risk. They act on probability, and in early June 2026, those probabilities shifted dramatically.
Understanding why crude oil futures hit record highs amid West Asia tensions requires looking well beyond the headlines. The mechanics of geopolitical risk pricing, the structural vulnerabilities of import-dependent economies, and the behavioural patterns of institutional traders during active conflict periods all converge to explain why MCX crude oil surged to ₹9,260 per barrel while global benchmarks tracked toward multi-year highs within a matter of trading sessions.
When big ASX news breaks, our subscribers know first
The Geopolitical Risk Premium: An Invisible Price Floor
Commodity futures markets are, at their core, probability-weighting machines. Traders and algorithms continuously assign likelihoods to supply disruption scenarios and embed those probabilities into forward pricing. During periods of geopolitical calm, this risk premium is thin, often just a few dollars per barrel. During active conflict, particularly conflict that threatens critical maritime chokepoints, that premium expands rapidly and can become self-reinforcing.
The mechanism works as follows. When military exchanges are confirmed near the Strait of Hormuz, market participants immediately recalculate the probability distribution of supply disruption scenarios. Even if the physical flow of oil continues uninterrupted, the option value of that continuity diminishes. Insurers raise premiums for tankers transiting the region. Shipping companies reroute vessels preemptively. Refiners in Asia begin bidding more aggressively for spot cargoes as a buffer against potential shortages. Each of these micro-decisions aggregates into upward price pressure at the futures level.
Crude oil is uniquely sensitive to West Asian instability compared to most other commodities because the concentration of supply infrastructure in a geographically compact and politically volatile region creates what analysts describe as a structural chokepoint premium. No other commodity has an equivalent single-point-of-failure geography with comparable global supply significance. For further context on the broader forces shaping prices, the current crude oil market overview provides a useful reference point.
Key Price Levels During the June 2026 Escalation
The multi-session rally that unfolded across late May and early June 2026 produced the following benchmark movements, reflecting a broad and sustained repricing of conflict risk:
| Benchmark | Price Level | Movement |
|---|---|---|
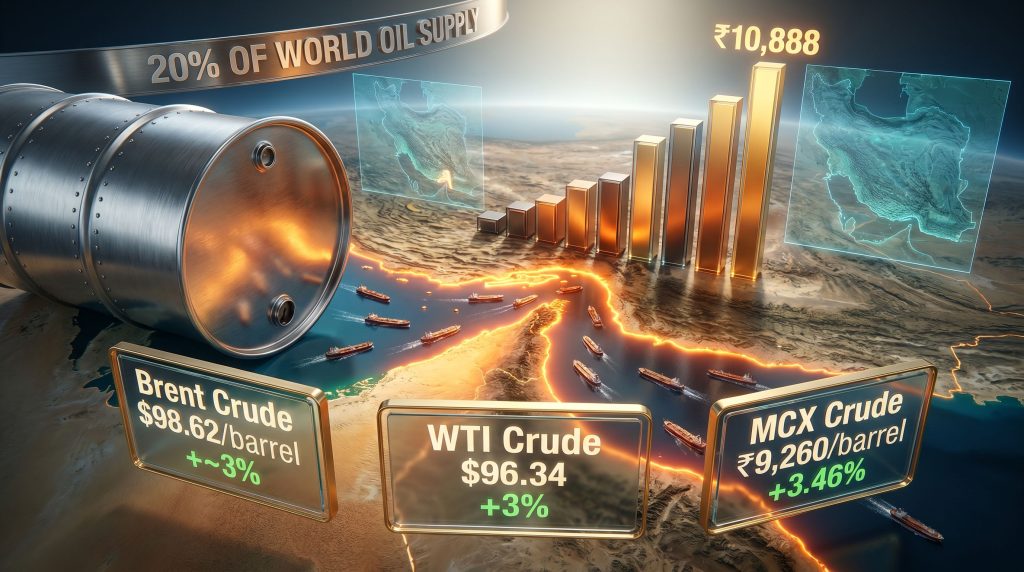
| MCX Crude Oil (June contract) | ₹9,260 per barrel | +₹310 / +3.46% |
| Brent Crude (August futures) | $98.62 per barrel | +~3% |
| WTI Crude Futures | $96.34 per barrel | +3% |
| MCX Crude Oil (April contract, lifetime high) | ₹10,888 per barrel | +2.83% |
| MCX May Contract | ₹9,485 per barrel | Fresh record |
| WTI (broader conflict peak) | $116.55 per barrel | Conflict premium |
| Brent (broader conflict peak) | $111.40 per barrel | Conflict premium |
Disclaimer: Price levels reflect the multi-session rally trajectory across the escalation period and are subject to change based on evolving geopolitical and market conditions. This article does not constitute financial advice.
The significance of three consecutive sessions of gains cannot be understated from an analytical perspective. A single-session spike is typically interpreted as an emotional overreaction. Three consecutive sessions of gains signal something structurally different: markets have completed their initial shock repricing and have entered a sustained risk re-evaluation phase where traders are repositioning portfolios, not just reacting to news.
How the Strait of Hormuz Dictates Global Oil Price Floors
The World's Most Consequential Energy Chokepoint
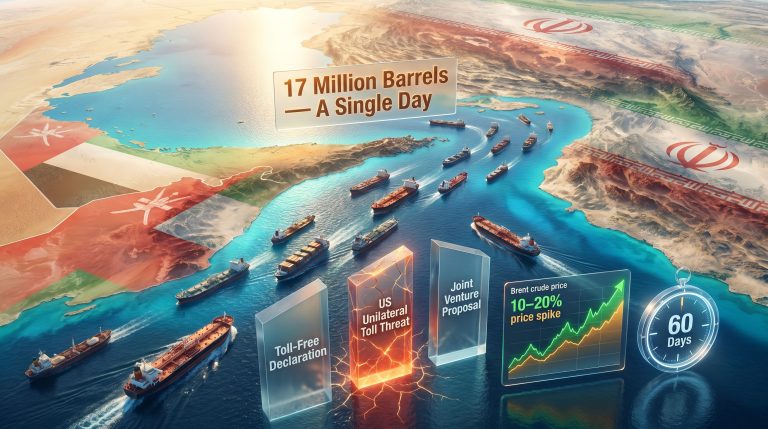
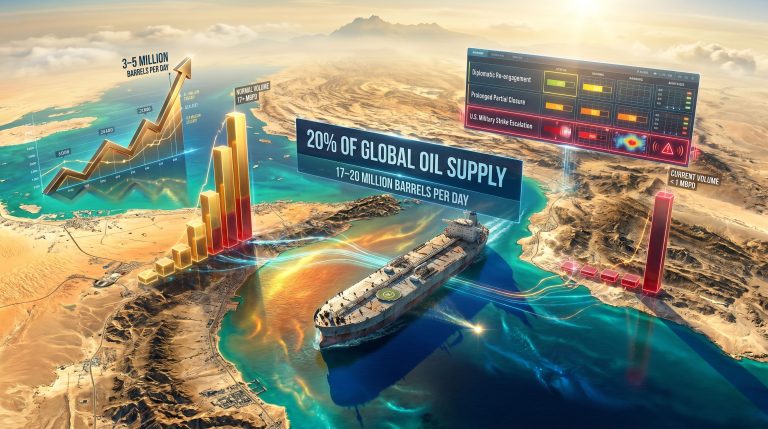
According to the U.S. Energy Information Administration, approximately 20% of the world's total petroleum liquids transit through the Strait of Hormuz on a daily basis. This figure encompasses not only crude oil but also liquefied natural gas, refined petroleum products, and petrochemical feedstocks. The volume is staggering: roughly 17 to 21 million barrels per day pass through this corridor, making it the single most important maritime energy passage on the planet.
What makes the Strait uniquely dangerous from a supply security perspective is not just its volume throughput but its geometric constraints. The navigable channel for laden tankers is effectively two lanes, each approximately three kilometres wide, with a separation zone between them. A small number of vessels, or a credible threat to those lanes, can create supply anxiety across every oil-importing nation simultaneously. The Wall Street Journal's reporting on limited flows through the Strait of Hormuz illustrates precisely how swiftly markets respond to such constraints.
What Happens When Tanker Traffic Is Threatened
The alternative routing scenario, where tankers are diverted around the Cape of Good Hope at Africa's southern tip, adds approximately 15 to 20 additional days of transit time for vessels destined for Asian markets. This has several cascading consequences that are not always immediately visible in headline price data:
- Freight costs increase substantially, with some estimates suggesting per-voyage costs rise by $2 to $4 million for a Very Large Crude Carrier (VLCC) on the rerouted path
- The effective global tanker fleet capacity tightens because vessels spend more time at sea rather than turning around between loading and discharge ports
- Refinery input cost timelines extend, creating inventory drawdown pressure at Asian facilities that rely on Persian Gulf crude supply
- War risk insurance premiums for Hormuz-transiting vessels escalate, adding further cost layers that eventually reach consumers
Strait of Hormuz: Supply Disruption Scenarios
| Scenario | Estimated Price Impact | Duration Risk |
|---|---|---|
| Partial tanker avoidance (current) | +$5 to $15/barrel premium | Weeks to months |
| Full closure (historical modelling) | +$30 to $50+/barrel spike | Indefinite |
| Diplomatic resolution | -$8 to $15/barrel correction | Rapid |
Decoding the Escalation Signals That Moved Futures Prices
The Military Exchange and Its Market Implications
The specific sequence of events during the June 2026 escalation involved a multi-vector military exchange. Iran launched missiles targeting Gulf state territories, with interceptions carried out by US and Bahraini defence forces. Separately, US military assets shot down three drones that had been targeting civilian shipping vessels within the Strait of Hormuz corridor. Iran's Islamic Revolutionary Guard Corps then publicly claimed retaliatory strikes against US military infrastructure in the region.
Markets treat IRGC operational activity as a distinctly significant escalation signal, separate from state-level diplomatic posturing. The IRGC has historically operated with a degree of tactical autonomy that creates uncertainty about whether its actions reflect coordinated state strategy or independent escalatory decisions. This ambiguity adds a risk premium layered on top of the standard geopolitical discount, because traders cannot confidently model IRGC decision-making using conventional diplomatic frameworks. Furthermore, the geopolitical oil price drivers at play in this region have consistently proven difficult to model with precision.
The Diplomatic Contradiction
One of the most analytically interesting features of the June 2026 price environment was the simultaneous existence of active diplomatic engagement and active military exchanges. President Trump indicated that negotiations with Iran remained ongoing and suggested a potential agreement regarding the Strait of Hormuz could be reached within approximately one week. Markets largely discounted this optimism.
When diplomatic signals and military actions move in opposite directions simultaneously, futures markets consistently price in the worst-case scenario until concrete, verifiable evidence of de-escalation emerges. Political statements, however senior their source, carry far less market weight than confirmed troop movements, verified ceasefires, or independent third-party mediation confirmations.
This behavioural pattern explains why three consecutive sessions of price gains were recorded even as diplomatic language became more conciliatory. Israel-Lebanon diplomatic discussions were also being monitored as a secondary variable, with any de-escalation on that front carrying potential spillover benefits for broader West Asia risk sentiment.
India's Compounded Vulnerability: MCX as a National Risk Barometer
Why INR-Denominated Crude Futures Amplify Global Shocks
India imports approximately 85 to 88% of its crude oil requirements, making it one of the most exposed major economies globally to West Asian supply disruptions. The Multi Commodity Exchange (MCX) functions not merely as a financial instrument but as a real-time barometer of India's energy security stress. When global benchmarks rise, MCX contracts typically rise by an amplified margin due to the compounding effect of currency dynamics.
During conflict-driven commodity rallies, the US dollar frequently strengthens as a safe-haven asset. This creates a double compression effect on India's energy costs: crude oil prices rise in dollar terms, and the INR simultaneously depreciates against the dollar, meaning each barrel costs more in rupee terms than the raw commodity price movement alone would suggest. The ₹310 single-session surge to ₹9,260 per barrel on the MCX reflects precisely this compounding dynamic.
Downstream Cost Pressures Across the Indian Economy
Elevated MCX crude prices translate into a specific cascade of economic consequences for India:
- State-owned refiners face higher input costs that either compress margins or must be passed through to consumers
- Fuel retail prices for petrol and diesel face upward pressure, directly affecting transportation costs
- Petrochemical feedstock costs rise, affecting plastics, packaging, and synthetic materials sectors
- Agricultural input costs increase as diesel-dependent irrigation and logistics face higher operating expenses
- Headline CPI inflation receives an upward impulse through the energy component, complicating monetary policy decisions
Persian Gulf supply routes are not merely convenient for Indian refiners; they are structurally indispensable given the volume, grade compatibility, and pricing arrangements built around Gulf crude. Saudi Arab Heavy, Iraqi Basrah, and UAE Murban grades are specifically processed by Indian refinery configurations that were designed around their sulphur content and API gravity characteristics, meaning rerouting to alternative supply origins is not simply a logistical adjustment but often a technically constrained and more expensive option.
The next major ASX story will hit our subscribers first
Macroeconomic Consequences of Sustained High Oil Prices
Inflation Transmission and Central Bank Dilemmas
The relationship between crude oil price spikes and headline consumer price inflation is well-documented but often misunderstood in terms of its timing. The pass-through is not immediate. It typically manifests across two to four months as refiners adjust pricing, retailers rework cost structures, and transportation networks reprice service contracts. This lag creates a particularly difficult environment for central banks in import-dependent economies.
A central bank facing imported energy inflation has a narrow and uncomfortable set of choices: tighten monetary policy to defend the currency and dampen inflation expectations, at the cost of suppressing domestic growth; or hold rates steady and accept a period of elevated inflation, risking currency depreciation that further amplifies the oil import bill. Historical analogies are instructive. The 1973 OPEC embargo, the 2008 surge to $147 per barrel, and the 2022 post-Ukraine invasion rally each demonstrated that the duration and severity of oil price shocks, more than their initial magnitude, determine whether central banks are forced into growth-damaging tightening cycles.
In addition, understanding the oil market trade war impact alongside geopolitical conflict provides a more complete picture of the compounding pressures on crude benchmarks during periods of global uncertainty.
Winners, Losers, and the Asymmetric Impact
| Economy Type | Short-Term Impact | Long-Term Risk |
|---|---|---|
| Oil-exporting Gulf states | Revenue windfall | Geopolitical instability exposure |
| India (major importer) | Import bill surge, INR pressure | Inflationary pass-through |
| Europe (import-dependent) | Energy cost re-escalation | Recession risk if prolonged |
| US (net exporter) | Domestic producer benefit | Strategic reserve pressure |
| China (largest crude importer) | Supply security concern | Accelerated diversification |
IMF and World Bank modelling frameworks have historically estimated that a sustained $10 per barrel increase in crude oil prices reduces global GDP growth by approximately 0.2 to 0.3 percentage points in the year following the shock, with the impact concentrated in net-importing developing economies. At the price levels seen during the June 2026 escalation, with Brent approaching $100 per barrel, the macroeconomic implications extend well beyond energy sector dynamics.
The Anatomy of a Conflict-Driven Commodity Rally
Three Phases of Geopolitical Oil Price Spikes
Experienced energy market analysts typically decompose conflict-driven price rallies into three distinct phases, each requiring a different interpretive framework:
- Initial shock repricing (hours to one to two days): Algorithmic systems react to conflict headlines, options markets reprice volatility, and speculative positions are established. This phase often overstates the eventual sustained price level.
- Sustained risk premium embedding (days to weeks): Institutional investors, hedgers, and physical market participants reassess their exposure. This is where the three-session consecutive gain pattern becomes analytically meaningful, as it confirms the transition from emotional reaction to calculated repositioning.
- Resolution-triggered correction (hours to days post-confirmation): Verified diplomatic breakthroughs or confirmed de-escalation trigger rapid corrections as risk premiums unwind. The speed of the correction is typically proportional to the credibility and specificity of the resolution signal.
Volatility Indicators to Monitor
Beyond benchmark price levels, several technical indicators provide early warning signals during geopolitical escalation periods:
- OVX (Oil Volatility Index): Often called the crude oil VIX, elevated OVX readings indicate that options markets are pricing in significant price uncertainty, which typically precedes or accompanies major price moves
- Open interest changes in WTI and Brent futures: Rapid increases in open interest alongside rising prices confirm that new money is entering the market rather than short covering, suggesting the rally has institutional participation depth
- Backwardation structure: When near-month contracts trade at a premium to far-month contracts, the market is signalling that immediate physical supply is perceived as scarce or at-risk, a powerful confirmation of genuine supply anxiety rather than purely speculative activity
- Tanker tracking data: Real-time vessel tracking platforms provide leading indicators of physical rerouting behaviour before it is reflected in official supply statistics
Scenario Planning: Three Pathways for Crude Oil Prices
The trajectory of crude oil prices from the June 2026 elevated levels depends critically on how two primary variables evolve: the status of US-Iran diplomatic engagement and the operational tempo of IRGC military activity near the Strait of Hormuz. Consequently, the crude oil trade geopolitics shaping this environment warrant close and continuous monitoring.
Scenario A: Diplomatic Resolution Within Two to Four Weeks
Brent corrects toward the $82 to $87 per barrel range. MCX futures retreat sharply as the currency and commodity components of the INR-denominated premium both unwind. The geopolitical risk premium effectively collapses upon confirmed transit guarantees for civilian and commercial shipping.
Scenario B: Prolonged Standoff Without Physical Supply Disruption
Brent consolidates in the $95 to $105 per barrel range. Markets maintain an elevated but stable risk premium. Volatility remains high but panic pricing is avoided. This scenario is most associated with sustained inflationary pressure across import-dependent economies without triggering an acute growth shock.
Scenario C: Physical Strait of Hormuz Disruption
Brent surges toward $120 to $140 per barrel or beyond. The International Energy Agency's emergency strategic reserve release mechanisms are activated. Global recession risk escalates materially, particularly for Asian economies with limited domestic energy resources.
The above scenarios represent analytical projections based on historical precedent and current market conditions. They are not investment recommendations and should not be relied upon as forecasts of future prices.
Frequently Asked Questions: Crude Oil Futures and West Asia Tensions
Why Did Crude Oil Futures Hit Record Highs in June 2026?
A multi-day military escalation between the US and Iran, involving missile launches toward Gulf state territories, drone interceptions over civilian shipping lanes in the Strait of Hormuz, and IRGC strike claims on US military assets, embedded a significant geopolitical risk premium into global crude benchmarks. Crude oil futures hit record highs amid West Asia tensions as MCX crude oil reached ₹9,260 per barrel, Brent approached $98.62, and WTI crossed $96.34 per barrel across the rally period.
What Is the Strait of Hormuz and Why Does It Matter for Oil Prices?
The Strait of Hormuz is a narrow maritime passage between Iran and Oman through which approximately 20% of the world's daily petroleum liquids flow. Any credible threat to transit safety through this corridor, even without confirmed physical disruption, triggers immediate upward pressure on global crude futures as markets price in supply uncertainty.
How Does West Asia Conflict Affect Indian Consumers?
India depends on imports for roughly 85 to 88% of its crude oil needs. When global prices spike due to geopolitical risk, INR-denominated MCX futures rise by an amplified margin due to simultaneous currency depreciation, increasing costs for refiners and creating downstream inflationary pressure across fuel, transportation, agriculture, and petrochemical sectors.
Could Diplomatic Talks Bring Oil Prices Down Quickly?
Historically, confirmed diplomatic breakthroughs involving transit guarantees through critical chokepoints have produced rapid $8 to $15 per barrel corrections in crude futures. Markets require concrete, verifiable agreements rather than political statements to price in de-escalation. Verbal commitments, even from senior officials, carry limited weight when active military exchanges are ongoing. Furthermore, OPEC's market influence during such periods adds another layer of complexity to any price correction timeline.
What Price Level Would Signal a Full Geopolitical Risk Premium Correction?
Analysts generally look for WTI retracing toward the $80 to $85 per barrel range and Brent toward the $85 to $90 per barrel level as indicators that the conflict risk premium has substantially unwound. The exact correction magnitude depends on the nature, credibility, and permanence of any resolution mechanism.
Key Takeaways for Investors and Energy Analysts
The June 2026 West Asia escalation offers a concentrated case study in how geopolitical risk translates into commodity price dynamics with measurable economic consequences across multiple geographies simultaneously. Several structural insights emerge from this episode:
- The Strait of Hormuz remains the single most consequential geographic variable in global oil pricing, with its 20% of global supply throughput creating an irreplaceable concentration of systemic risk
- Three consecutive sessions of gains in crude futures are not noise; they represent a market-wide transition from initial reaction to sustained risk re-evaluation
- India's dual vulnerability as a major import-dependent economy with currency exposure to dollar-strengthening episodes creates amplified domestic energy cost consequences during West Asian instability
- IRGC operational statements and actions carry distinct market-moving significance that is analytically separable from state-level diplomatic posturing
- Verified diplomatic mechanisms, particularly those addressing Hormuz transit specifically, are the most powerful near-term catalyst for meaningful price correction
- Structural backwardation in crude futures curves, rising OVX readings, and tanker rerouting data are the most reliable leading indicators for traders monitoring the physical versus speculative dimensions of any conflict-driven price rally
For readers seeking deeper and ongoing analysis of global energy market dynamics and the evolving West Asia situation, ET EnergyWorld at energy.economictimes.indiatimes.com provides continuous coverage of oil market developments, geopolitical risk events, and commodity exchange movements across Indian and international markets. In addition, Trading Economics' crude oil data offers real-time benchmark pricing and historical context for tracking how current levels compare against longer-term trends.
Want to Know Which ASX Stocks Could Benefit From Rising Commodity Prices?
When geopolitical shocks send oil and energy commodities surging, the ripple effects often reach ASX-listed resource and exploration companies — and Discovery Alert's proprietary Discovery IQ model scans ASX announcements in real time, delivering instant alerts on significant mineral discoveries so subscribers can identify actionable opportunities before the broader market reacts. Explore the historic returns major discoveries have generated and begin a 14-day free trial to position yourself ahead of the next market-moving event.