August 12, 2026
When Diplomacy Fails to Deliver: How Geopolitical Risk Premiums Shape Crude Oil Pricing
Energy markets have a long memory for broken promises. Across decades of Middle East diplomacy, traders have learned to price not just what agreements say, but what they can actually deliver. The gap between a diplomatic announcement and physical barrels flowing through a maritime chokepoint is where fortunes are made and lost in crude futures. That gap, currently measured in tens of millions of barrels per day of missing supply, is precisely why oil rises as doubts over US-Iran deal heighten supply concerns across global energy markets in August 2026.
Understanding this dynamic requires looking past headline price moves and into the structural mechanics of how geopolitical risk gets embedded into crude benchmarks. Furthermore, it requires understanding why inventory data can temporarily lose its relevance when supply chains face existential disruption. The geopolitical oil price tensions driving current market behaviour have deep structural roots that go well beyond any single diplomatic announcement.
When big ASX news breaks, our subscribers know first
The Anatomy of a Geopolitical Price Rally
How Markets Reprice Risk When Diplomatic Confidence Erodes
Oil markets do not wait for certainty. They price probability distributions, and when those distributions shift, benchmarks move fast. The current rally in Brent and WTI futures is a direct expression of declining confidence that a preliminary US-Iran framework will translate into restored physical supply flows within any timeframe that matters to forward curves.
The price action tells its own story:
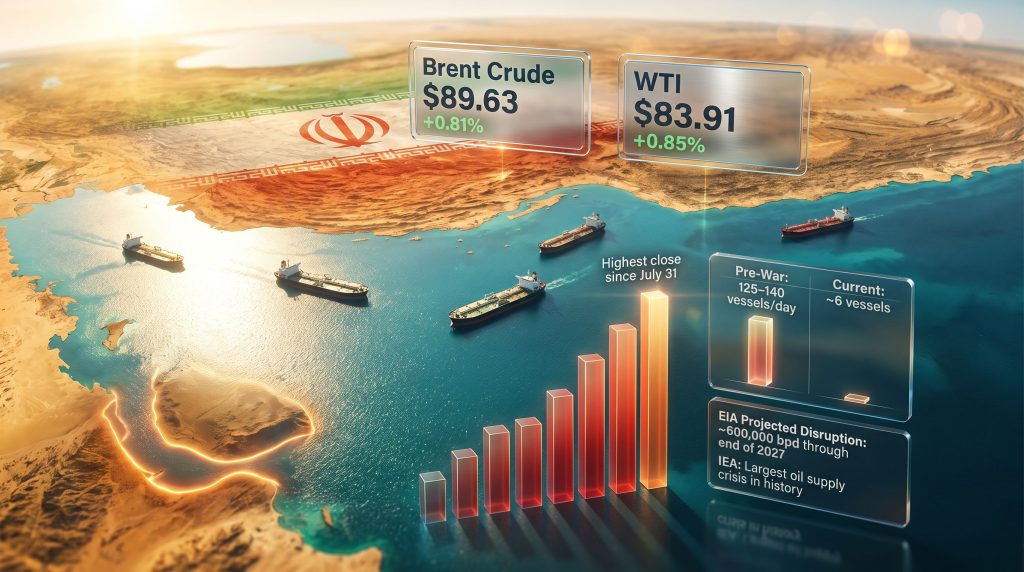
- Brent crude advanced to $89.63 per barrel (up 72 cents or +0.81%) in early Wednesday trading at 0053 GMT
- WTI crude climbed to $83.91 per barrel (up 71 cents or +0.85%)
- Both benchmarks had already settled more than $1 higher on Tuesday, reaching their highest closing levels since July 31
- Monday's session saw a roughly 5% single-session surge as diplomatic optimism surrounding a preliminary US-Iran agreement began to structurally unravel
According to Reuters reporting on the situation, "the pattern is textbook: an initial selloff on deal announcement as markets price restored supply, followed by a sharp reversal as analysts identify the absence of concrete implementation mechanisms. This cycle has repeated across multiple decades of Middle East diplomacy."
What makes the current episode particularly instructive is the speed of the reversal. Markets initially treated the announcement as supply-positive, then almost immediately began stress-testing its delivery assumptions. Consequently, that stress test produced a rapid reassessment of risk.
The Concept of the Geopolitical Risk Premium in Crude Markets
A geopolitical risk premium is the additional price that crude markets assign above what fundamental supply-demand balances alone would justify, reflecting uncertainty about future availability. This premium is not static. It expands when diplomatic processes stall, military incidents escalate, or chokepoint restrictions intensify. It contracts when verified supply restoration begins.
Critically, the premium is asymmetric. Markets tend to price upside supply risk faster than they price restoration confidence, because the cost of being wrong about a disruption far exceeds the cost of being wrong about a recovery.
The Strait of Hormuz: Decoding a Chokepoint in Crisis
Why Vessel Traffic Numbers Matter More Than Diplomatic Statements
The Strait of Hormuz is a 33-kilometre-wide navigable channel between Iran and Oman. Approximately 20% of the world's traded oil passes through this corridor, along with significant volumes of liquefied natural gas destined for Asian markets. When shipping through this waterway is disrupted, the effects are not regional — they cascade through global refinery feedstock availability, freight insurance markets, and energy import costs across Asia, Europe, and beyond.
The current traffic data presents a stark picture:
| Metric | Pre-Conflict Baseline | Current Conditions (August 2026) |
|---|---|---|
| Daily vessel transits (Hormuz) | 125–140 vessels | Approximately 6 vessels (Monday) |
| 10-day rolling average | ~130+ vessels | Approximately 11 vessels |
| EIA supply disruption projection | Baseline | ~600,000 bpd through end of 2027 |
| IEA characterisation | Normal operations | Largest oil supply crisis in modern history |
The collapse from 125–140 daily transits to just six is not a minor adjustment. It represents a near-complete suspension of normal commercial shipping through a waterway that underpins global crude supply chains. Even the 10-day rolling average of approximately 11 vessels demonstrates that Monday's figure was not an anomaly but part of a sustained traffic collapse.
The Bab el-Mandeb: A Second Active Chokepoint
What compounds the current supply disruption beyond historical precedent is the simultaneous activation of a second major maritime chokepoint. The Bab el-Mandeb Strait, connecting the Red Sea to the Gulf of Aden, reported separate shipping attacks on Tuesday, with both US forces and Houthi-aligned groups reporting incidents.
This dual-chokepoint scenario creates compounding supply risk for:
- Asian importers including India, China, Japan, and South Korea, which depend heavily on Middle East crude
- European refiners that rely on Red Sea routing for cost-effective crude deliveries
- Global insurance underwriters who must price simultaneous risk across two strategic corridors
The two-chokepoint dynamic is particularly significant because alternative routing via the Cape of Good Hope adds approximately 10–14 days to voyages and significantly increases freight costs, squeezing refinery margins globally.
Iran's Stated Conditions for Hormuz Reopening
Iran's senior security official publicly outlined the conditions under which the Strait of Hormuz would be reopened for normal commercial traffic. These conditions extend well beyond any bilateral energy agreement:
- Release of frozen Iranian sovereign assets held under international sanctions frameworks
- Cessation of active hostilities across multiple regional conflict zones
- Acceptance of broader ceasefire terms covering several theatres simultaneously
These preconditions effectively transform what markets initially perceived as a bilateral energy negotiation into a multi-theatre geopolitical settlement. The complexity of satisfying all conditions simultaneously is what keeps the delivery gap wide and the geopolitical risk premium elevated.
Why the US-Iran Framework Is Not Calming Crude Markets
Understanding the Delivery Gap: From Diplomatic Paper to Physical Barrels
One of the more sophisticated dynamics currently playing out in crude markets is the distinction between an announcement effect and a delivery gap. The announcement effect is the immediate price reaction to diplomatic news. The delivery gap, however, is the structural distance between a framework agreement and actual restored supply flows, measured in weeks, months, and institutional complexity.
Markets are currently pricing the delivery gap. Key reasons why traders remain sceptical that supply normalisation is imminent include:
- Vague implementation architecture — The preliminary agreement lacks specific, verifiable timelines for restoring Iranian crude export capacity
- Maritime traffic restoration lag — Even after a confirmed ceasefire, shipping industry specialists estimate that security clearances, insurance reinstatement, and vessel routing reconfiguration could require several weeks to months
- Port and terminal verification — Export facilities require operational assessment before large-volume commercial shipments can responsibly resume
- Sanctions unwinding complexity — Multilateral legal processes governing frozen asset releases do not resolve on diplomatic timelines
Furthermore, OPEC's market influence adds another layer of complexity, as the organisation must simultaneously manage production strategy against a backdrop of severe supply uncertainty from the region.
What Genuine Supply Restoration Would Require
A practical restoration sequence would need to clear several sequential hurdles before a single additional barrel reaches Asian or European refineries:
- Verified military ceasefire across all relevant conflict theatres
- International maritime safety authority clearances for Hormuz commercial transit
- War risk insurance reinstatement by Lloyd's and international underwriters
- Iranian port authority operational confirmation
- Tanker owner and operator risk acceptance under revised routing protocols
- Sanctions relief legal confirmation enabling financial settlement of crude cargoes
Each of these steps represents a distinct institutional process, and they do not run in parallel. The sequential nature of supply restoration is precisely why forward-looking crude markets maintain elevated risk premiums even when a diplomatic framework exists.
US Crude Inventory Data: A Misleading Signal in a Disrupted Market
The API Report Versus Market Reality
A significant statistical divergence emerged this week that initially appeared to contradict the oil price rally. Industry sources citing American Petroleum Institute data reported a crude inventory build that substantially exceeded market expectations:
| Inventory Category | Analyst Expectation (Reuters Poll) | API-Reported Change |
|---|---|---|
| Crude oil stocks | Expected decline | Rose by approximately +9.1 million barrels |
| Gasoline stocks | Expected decline | Fell by approximately -1.5 million barrels |
| Distillate stocks | Expected decline | Fell by approximately -596,000 barrels |
Note: Official EIA confirmation was due at 10:30 a.m. ET (1430 GMT) on Wednesday. The EIA data may revise these figures.
Why a 9.1 Million Barrel Build Did Not Kill the Rally
The apparent paradox of rising prices alongside a large crude inventory build reveals something important about how geopolitical disruption environments alter market pricing logic. Several structural factors explain why the build failed to suppress prices:
- Refined product drawdowns in gasoline (down ~1.5 million barrels) and distillates (down ~596,000 barrels) signal robust downstream demand, confirming that end-use consumption remains strong despite elevated pump prices
- Geopolitical risk premium dominance: In active supply disruption environments, forward uncertainty about availability consistently outweighs backward-looking inventory snapshots
- Import timing effects: Large weekly crude builds frequently reflect vessel arrival clustering rather than genuine demand weakness, particularly during periods of route disruption
- Refinery throughput adjustments: Refiners managing uncertainty about future crude availability may build strategic buffers, paradoxically increasing inventory figures while the broader supply picture deteriorates
In supply-disruption regimes, the market prices what it fears losing in the future, not what it currently holds in storage. This is why inventory builds can coexist with price rallies when geopolitical risk dominates trader positioning.
The oil markets under trade war pressure narrative provides useful context here — similar dynamics played out when tariff uncertainty caused traders to prioritise geopolitical sentiment over domestic inventory readings.
The Historical Scale of This Supply Disruption
Comparing Current Conditions to Major Historical Oil Shocks
The International Energy Agency's characterisation of the current Iran conflict's impact as the largest oil supply crisis in modern history places it in significant historical context. The EIA's global oil outlook reinforces this assessment, projecting sustained disruptions through the end of 2027. Comparing it against past disruptions reveals both the severity and the structural differences of the current episode:
| Historical Supply Shock | Peak Disruption (bpd) | Duration | Primary Cause |
|---|---|---|---|
| 1973 Arab Oil Embargo | ~4.3 million | ~5 months | OAPEC production cuts |
| 1990 Gulf War (Iraq/Kuwait) | ~4.3 million | ~7 months | Iraqi invasion, coalition response |
| 2011 Libyan Civil War | ~1.4 million | 12+ months | Internal armed conflict |
| Current Iran Conflict (EIA est.) | ~600,000+ | Projected through end 2027 | Hormuz closure, regional conflict |
Disclaimer: Historical comparisons are provided for analytical context. Current disruption figures reflect EIA projections as of August 2026. Escalation scenarios could materially alter forward estimates.
While the current EIA-projected disruption volume of approximately 600,000 barrels per day appears smaller in isolation than historical episodes, the multi-year projection horizon through the end of 2027 and the simultaneous activation of two chokepoints distinguish the current crisis structurally. The 1973 embargo, by contrast, involved direct production cuts rather than maritime blockades, making restoration mechanisms fundamentally different.
The next major ASX story will hit our subscribers first
Scenario Analysis: Three Pathways for Crude Pricing
How Different Diplomatic and Military Outcomes Could Reshape Brent and WTI
Scenario A: Deal Collapses, Hormuz Remains Restricted (Bearish Supply, Bullish Price)
Should the preliminary framework break down entirely, crude markets would likely price a sustained chokepoint closure scenario. Brent could test the $95–$100+ per barrel range as supply fears intensify. Asian importers dependent on Middle East crude — particularly India, China, Japan, and South Korea — would face acute feedstock shortages that their strategic petroleum reserves could only partially offset.
Scenario B: Deal Holds, But Implementation Is Gradual (Most Probable)
Under this base case, prices likely remain elevated in the $85–$92 per barrel range as markets wait for physical confirmation of supply restoration. Hormuz traffic normalisation could take 6–12 weeks under optimistic assumptions. Inventory builds would emerge as a lagging indicator once exports resume, eventually beginning to compress the geopolitical premium.
Scenario C: Full Rapid Normalisation (Low Probability)
A rapid, verified reopening of Hormuz, combined with near-immediate sanctions relief and export resumption, could deflate the risk premium sharply. Brent might retrace toward the $75–$80 per barrel range under this scenario. However, the complexity of Iran's stated preconditions makes this the least probable near-term outcome.
What to Watch: Critical Indicators for Energy Market Participants
The Data Points That Will Drive Crude Price Direction
For traders, analysts, and energy market observers monitoring how this situation evolves, the following indicators carry the highest signal value:
- EIA Weekly Petroleum Status Report (Wednesday, 10:30 a.m. ET / 1430 GMT): Official crude and product inventory data that will either validate or revise the API-reported 9.1 million barrel build
- Strait of Hormuz daily vessel transit counts: The single most direct real-time measure of whether physical supply restoration is occurring, independent of diplomatic announcements
- Negotiation specificity in US-Iran talks: Watch for concrete implementation timelines, verified asset release confirmations, and ceasefire verification mechanisms rather than framework announcements
- Houthi activity in the Bab el-Mandeb: This second chokepoint can independently sustain geopolitical risk premiums regardless of Hormuz developments
- IEA and EIA monthly oil market reports: Forward supply-demand balance projections from both agencies will anchor medium-term price expectations
- War risk insurance premium movements: Lloyd's of London market pricing for Hormuz routing provides a real-time institutional assessment of supply restoration probability
Monitoring crude oil price trends against these indicators will be essential for any market participant attempting to separate temporary volatility from structural repricing. In addition, broader analysis of how this crisis intersects with global finance is available through the IMF's energy trade assessment, which charts the wider economic consequences of sustained regional disruption.
The ultimate measure of diplomatic success in this conflict will not be a press conference. It will be daily vessel transit counts through the Strait of Hormuz returning toward pre-conflict levels of 125–140 ships. Until that data emerges, with oil rises as doubts over US-Iran deal heighten supply concerns continuing to drive positioning, the geopolitical risk premium embedded in both Brent and WTI is likely to remain a structural feature of crude pricing rather than a temporary aberration.
This article contains forward-looking scenarios and analytical projections based on publicly available data as of August 12, 2026. Energy market conditions are subject to rapid change based on geopolitical developments. Nothing in this article constitutes financial or investment advice. Readers should conduct independent analysis and consult qualified advisors before making any investment decisions.
Want to Stay Ahead of Resource Market Shifts Driven by Geopolitical Events?
Discovery Alert's proprietary Discovery IQ model delivers real-time alerts on significant ASX mineral discoveries, transforming complex market signals into actionable investment insights the moment they emerge — ideal for investors navigating volatile commodity environments like the current crude supply crisis. Explore how historic mineral discoveries have generated substantial returns and begin your 14-day free trial today to secure a market-leading edge.