
May 23, 2026
Why Crude Oil Has Become the Master Switch of Global Finance
Few forces in the global economy operate with the breadth and simultaneity of crude oil. Most commodities affect a single sector or region when their prices shift. Oil is different. When crude moves, it pulls on inflation expectations, central bank calculations, sovereign debt markets, currency valuations, and corporate earnings all at once. Understanding the oil influence on inflation and markets is not simply an energy sector exercise; it is a prerequisite for navigating virtually every major asset class in the modern investment landscape.
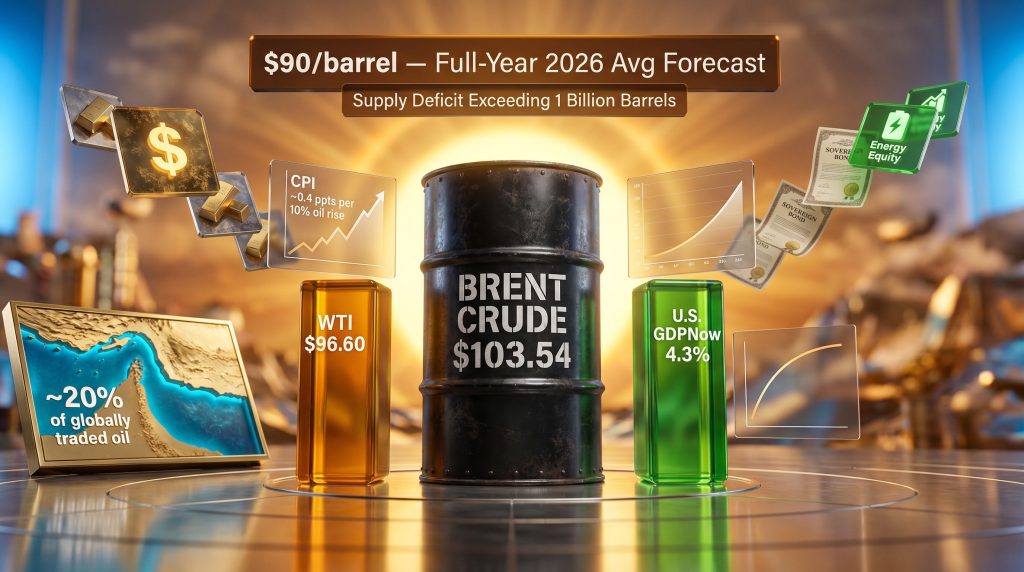
The current environment makes this dynamic unusually visible. Brent Crude has been trading near $103.54, having gained 8.2% month-on-month, while WTI Crude sits at approximately $96.60, both benchmarks reflecting substantial geopolitical supply premiums embedded in forward pricing. These are not abstract numbers. They are the inputs into every logistics invoice, every airline ticket, every bag of fertilizer-grown grain, and every central bank inflation projection circulating among policymakers right now.
When big ASX news breaks, our subscribers know first
The Mechanics Behind Oil's Inflationary Reach
Direct Pass-Through: The Channels Everyone Can See
The most straightforward path from a rising crude price to a higher consumer price index runs through refined petroleum products. Gasoline, diesel, jet fuel, and heating oil all reprice quickly when crude costs climb, lifting the energy component of CPI within weeks rather than months.
But the transmission is far broader than the fuel pump. Consider the layered web of oil-dependent costs embedded in everyday economic activity:
- Transport and logistics costs rise as diesel prices increase, raising the cost of moving every physical good along every supply chain
- Agricultural production depends on petrochemical-derived fertilizers and fuel-intensive machinery, embedding oil costs directly into food prices
- Petrochemical manufacturing of plastics, packaging, and synthetic textiles carries crude oil as a core feedstock cost
- Utility generation in economies reliant on oil-fired power plants passes fuel costs directly onto electricity tariffs
- Construction and infrastructure use petroleum-based materials including bitumen, solvents, and plastics throughout the build process
The combined effect is that a sustained oil price increase does not simply inflate one CPI subcomponent. It creates pressure across multiple categories simultaneously, making the aggregate inflationary impact larger than any single channel would suggest in isolation. For a deeper look at how crude oil and geopolitics interact to shape these pricing dynamics, the current supply environment offers particularly clear illustrations.
Second-Round Effects: The Slower, Stickier Problem
Beyond direct energy cost pass-through lies a more persistent inflationary mechanism that policymakers watch most carefully. Second-round effects occur when higher energy costs ripple through into wages, services pricing, and core goods inflation, creating a self-reinforcing dynamic that is significantly harder to reverse.
Research from the U.S. Federal Reserve examining advanced economies including Canada, the United Kingdom, and the euro area found that oil price changes generate both direct and secondary inflationary responses. These second-round effects raised four-quarter headline inflation by approximately 0.5 percentage points on average across those economies since the fourth quarter of 2022.
The quantitative relationships, while context-dependent, provide useful calibration:
| Scenario | Estimated CPI Impact |
|---|---|
| 10% oil price increase (headline CPI) | ~0.4 percentage points |
| Second-round effects only | ~0.1 to 0.2 percentage points |
| Post-2022 average second-round lift to 4-quarter CPI | ~0.5 percentage points |
| Meaningful pass-through duration | 6 to 18 months |
Sources: U.S. Federal Reserve (2023), Austrian National Bank/BIS academic literature
Why the 1970s Comparison Is Instructive But Incomplete
A common framing in energy market analysis is to compare current oil shocks to the devastating inflationary episodes of the 1970s. The comparison is legitimate in direction but misleading in magnitude. Several structural changes have significantly reduced, though not eliminated, the oil-to-inflation transmission coefficient:
- Advanced economies are materially more energy-efficient per unit of GDP than they were five decades ago
- Renewable energy, nuclear power, and natural gas have diversified the energy mix substantially
- Service-sector-dominated economies have inherently lower oil intensity than manufacturing-heavy predecessors
- Central bank credibility in anchoring long-term inflation expectations is considerably stronger than in the pre-Volcker era
- More flexible labour markets reduce the probability of wage-price spiral formation
The critical takeaway for investors is that the pass-through is smaller but not small. A sustained supply disruption of the kind currently being priced into crude markets retains the capacity to shift inflation trajectories by enough to alter central bank forward guidance and reprice bond markets materially. Academic research on oil price and inflation dynamics confirms that even in more energy-efficient modern economies, these transmission effects remain economically significant.
How Oil Shocks Cascade Through Financial Markets
The Stagflation Sequence: A Six-Step Transmission
When crude oil prices spike sharply and sustainably, financial markets must simultaneously price two opposing economic forces: rising inflationary pressure and deteriorating growth. This combination, commonly described as stagflation risk, is among the most punishing environments for diversified portfolios because conventional hedging relationships break down.
The typical market sequence following a major oil supply shock unfolds in identifiable stages:
- Energy and fuel prices rise immediately, lifting the energy component of consumer price indices within weeks
- Inflation expectations lift across the yield curve as bond markets price in higher future CPI readings
- Central banks face a genuine policy dilemma between raising rates to suppress inflation and holding to protect growth
- Equity multiples compress as higher discount rates mechanically reduce the present value of future corporate earnings
- Consumer spending weakens as higher fuel costs erode real disposable income across households
- Risk-off sentiment spreads across asset classes as markets reprice for a stagflationary backdrop
Research from Vanguard has noted that sustained energy disruptions comparable in scale to the 1990 Gulf War shock or the 2022 European energy crisis have the capacity to generate a materially stagflationary backdrop, with the euro area and Japan identified as particularly exposed given their structural dependence on energy imports.
Cross-Asset Responses: A Structured View
The oil influence on inflation and markets manifests differently across asset classes, creating both risks and opportunities depending on portfolio positioning. Furthermore, the oil market trade-war impact adds an additional layer of complexity to how these cross-asset relationships behave during periods of geopolitical stress:
| Asset Class | Typical Response to Oil Price Spike | Key Mechanism |
|---|---|---|
| Energy equities | Outperform | Direct revenue uplift for producers |
| Consumer discretionary | Underperform | Higher input costs, weaker household spending |
| Government bonds (yields) | Rise (prices fall) | Inflation expectations push yields higher |
| Gold | Mixed to negative | Higher yields and stronger USD reduce appeal |
| U.S. dollar | Strengthen short-term | Petrodollar flows and rate expectation repricing |
| Commodity currencies (AUD, CAD, NOK) | Strengthen | Export revenue uplift for energy exporters |
| Emerging market bonds | Weaken | Higher USD and tighter global financial conditions |
The Oil-Gold Inverse Relationship: A Critical Dynamic
One of the less intuitive dimensions of the current market environment is the strong inverse correlation between gold and the combined forces of oil prices, bond yields, and the U.S. dollar. Analysis from Saxo Bank's commodity strategy team highlights that this elevated inverse correlation has been a defining feature of recent cross-asset behaviour, and that until the relationship changes, crude oil is likely to remain the dominant macro driver across markets.
The mechanism is straightforward once understood:
- Rising oil prices generate inflation concerns, which push bond yields higher
- Higher nominal yields increase the opportunity cost of holding non-yielding assets like gold
- Simultaneously, rate expectation repricing strengthens the U.S. dollar
- A stronger dollar reduces the attractiveness of gold for non-USD investors by making it more expensive in their currencies
- The net result is that geopolitical uncertainty alone is insufficient to sustain gold's upside when oil-driven macro conditions are working against it
In addition, gold, bonds and volatility have been moving in increasingly correlated patterns during recent oil-driven macro episodes, reinforcing the importance of understanding crude's role in cross-asset dynamics.
Geopolitical Supply Risk vs. Demand Reality: The Forces Competing for Price Control
The Strait of Hormuz: Why One Chokepoint Moves Global Markets
Approximately 20% of globally traded oil transits through the Strait of Hormuz, the narrow passage between the Persian Gulf and the Gulf of Oman. This concentration of critical energy flows through a single geographic bottleneck means that any credible threat to transit safety immediately introduces a supply risk premium into crude prices worldwide. Consequently, geopolitical trade disruptions of this nature reverberate well beyond energy markets, affecting freight, manufacturing, and broader financial conditions.
BMI analysts at Fitch Solutions have outlined the current scenario parameters in detail. Their base case assigns a 55% probability to an extension scenario for the U.S.-Iran conflict. They forecast Dated Brent to average $90 per barrel across full-year 2026, a figure they note is substantially above their pre-conflict Brent futures forecast of $81.50 per barrel. Their May monthly average forecast stands at $125 per barrel, with June projected at $115 per barrel.
Key structural factors embedded in these projections include:
- A cumulative supply deficit already exceeding one billion barrels under current conditions
- An estimated 6 to 8 week post-conflict normalisation window before Strait of Hormuz flows approach pre-crisis levels
- Significant regional energy infrastructure repair timelines adding further delay to any supply normalisation
- Asian refiners cutting throughput rates sharply as a coping strategy, with the BMI team warning this approach carries significant downstream risks
The BMI analysis notes that reduced refinery throughput limits the downstream availability of refined products, transmitting crude market scarcity directly to fuel prices at the retail level. As summer demand peaks in the northern hemisphere and fuel inventory buffers are progressively depleted, these pressures are expected to intensify considerably. (BMI/Fitch Solutions, May 2026)
The Demand Puzzle: Mixed Signals From the U.S. Economy
Commodity strategists at Zaye Capital Markets have described oil as currently caught between geopolitical supply support on one side and weakening global demand expectations on the other. The distinction matters because the supply-demand balance ultimately determines whether current price levels are justified fundamentally or represent a pure risk premium that could deflate rapidly on diplomatic progress.
The U.S. economic data flow as of late May 2026 illustrates the genuine ambiguity:
Demand-supportive indicators:
- U.S. Q2 GDPNow estimate revised up to 4.3%, well above consensus of approximately 1.6%
- Initial jobless claims: 209,000, below the 210,000 expected and the 212,000 prior reading
- Continuing claims: 1.782 million, with the four-week average falling to 203,000
- Strong labour market conditions historically correlate with elevated transport, freight, travel, and business energy consumption
Demand-limiting indicators:
- Kansas City Fed Manufacturing Index fell to 8 from 10, missing the expected reading of 9
- Philadelphia Fed Manufacturing Index collapsed to -0.4, against expectations of +17.8 and a prior reading of +26.7
- Manufacturing weakness signals potential softening in industrial oil consumption, which is one of the most oil-intensive segments of the economy
The interplay between these competing signals creates a pricing feedback loop. Stronger consumer and labour data support crude demand but can simultaneously lift the U.S. dollar through rate expectation repricing, creating a partial offset. Weaker manufacturing data pressures oil through demand fears but may be overridden by the geopolitical supply premium when conflict risk remains elevated.
Regional Vulnerability: Which Economies Bear the Greatest Burden
Net Importers vs. Net Exporters: The Structural Divide
The inflationary and fiscal impact of oil price shocks is distributed unevenly across the global economy. The single most important structural variable is whether an economy is a net importer or a net exporter of crude oil and refined products.
Most exposed economies (net importers):
- Euro area — structurally dependent on imported energy with limited domestic crude production, creating simultaneous current account and inflationary pressure
- Japan — near-total dependence on imported crude, compounded by yen weakness that amplifies the USD-priced oil cost in domestic currency terms
- India — large and growing import dependency, where energy subsidies designed to shield consumers create significant fiscal strain during sustained price spikes
- South Korea and Taiwan — export-oriented manufacturing economies with high energy import intensity and limited ability to pass costs to global customers without losing competitiveness
Lower exposure or beneficiary economies (net exporters):
- United States — now a net crude exporter; domestic shale production partially offsets import cost pressures and generates export revenue
- Canada, Norway, Australia — commodity exporters whose fiscal positions and currencies benefit from elevated energy revenues
- Gulf Cooperation Council states — direct fiscal beneficiaries of sustained high crude prices, with sovereign wealth funds accumulating at elevated rates
Academic research consistently confirms that the oil-to-inflation pass-through is weaker in economies where energy represents a smaller share of the consumer price basket, where fuel taxation acts as a price buffer, and where the labour market limits wage-price spiral formation. Quantitative analysis on inflation pass-through from oil shocks reinforces that these structural variables are among the most reliable predictors of cross-country variation in oil-to-CPI sensitivity.
The Central Bank Dilemma: When Monetary Policy Cannot Fix a Supply Problem
Rate Hikes Cannot Produce Oil
The fundamental challenge oil shocks create for central banks is that monetary policy tools are poorly calibrated for supply-side inflation. Raising interest rates can suppress consumer demand and reduce inflationary pressure through the demand channel, but it cannot increase crude oil production, reopen blocked shipping routes, or repair damaged energy infrastructure. However, understanding the central bank impact on gold illustrates how these institutions nonetheless shape asset price behaviour even when their tools cannot address the underlying supply problem.
The policy calculus forces central banks to assess several overlapping uncertainties:
- Whether the supply disruption is transitory or structural in nature
- Whether inflation expectations surveys are showing signs of de-anchoring from long-term targets
- Whether wage growth is beginning to incorporate energy-driven cost-of-living adjustments
- Whether growth is deteriorating fast enough to shift the primary policy priority from inflation control to recession prevention
Rising oil prices feed directly into sovereign bond markets through the inflation expectations channel. Higher crude prices lift near-term CPI forecasts, which push breakeven inflation rates higher, which in turn drive nominal yields upward even when real yields are unchanged. The result is a yield curve repricing that tightens financial conditions throughout the economy without any deliberate central bank action, acting as an automatic stabiliser that also constrains growth.
The next major ASX story will hit our subscribers first
Key Takeaways: Oil's Multi-Channel Macro Transmission
| Transmission Channel | Short-Term Impact | Medium-Term Impact |
|---|---|---|
| Consumer energy prices | Immediate CPI lift | Sustained if supply disruption persists |
| Transport and logistics costs | Higher freight costs | Embedded across goods prices |
| Agricultural and food prices | Fertiliser and fuel cost pass-through | Food CPI elevation |
| Bond yields | Rise on inflation expectations | Yield curve repricing |
| Central bank policy | Delayed rate cuts or signalled hikes | Higher-for-longer rate environment |
| Equity markets | Energy sector outperforms | Broad multiple compression |
| Currency markets | USD and commodity currencies strengthen | Emerging market currency pressure |
| Gold | Near-term headwinds from yield and USD | Recovery possible if growth fears dominate |
The oil influence on inflation and markets operates across at least six distinct transmission channels simultaneously. While the modern pass-through is structurally smaller than the inflationary episodes of the 1970s, it remains large enough to materially reshape CPI trajectories, central bank policy paths, and cross-asset pricing dynamics, particularly when supply disruptions are geopolitically driven, prolonged, and concentrated through a single critical chokepoint.
Disclaimer: This article is intended for informational and educational purposes only. It does not constitute financial or investment advice. Forecasts, price projections, and scenario analyses referenced throughout reflect the views of third-party analysts and research institutions at the time of publication and are subject to change. Past relationships between oil prices and inflation or asset prices do not guarantee future outcomes. Investors should conduct their own due diligence and consult qualified financial professionals before making investment decisions.
Want To Stay Ahead of the Market Moves That Matter Most?
When oil shocks ripple across commodities, currencies, and equities simultaneously, identifying the right ASX opportunities ahead of the crowd becomes critical — Discovery Alert's proprietary Discovery IQ model delivers real-time alerts on significant ASX mineral discoveries, cutting through the complexity to surface actionable investment insights the moment they emerge. Explore how historic mineral discoveries have generated substantial market returns on Discovery Alert's discoveries page, and begin your 14-day free trial today to position yourself ahead of the broader market.