August 3, 2026
The Hidden Crisis Beneath the Crude Oil Headline
Most commodity market cycles follow a predictable rhythm: supply constraints emerge, prices rise, producers respond, inventories rebuild, and the cycle resets. The crude oil market in mid-2026 is conspicuously breaking that pattern. Despite a coordinated and increasingly aggressive production restoration programme by OPEC+, physical oil inventories are not recovering at anything close to the pace the headline quota numbers would suggest. Understanding why requires looking past the policy announcements and into the physical plumbing of the global oil supply chain.
The gap between what OPEC+ says it is producing and what actually reaches consuming markets has become one of the defining analytical challenges of the current cycle. Tight global oil inventories and OPEC+ production increases are now operating in an almost paradoxical relationship, where larger output targets coexist with accelerating onshore stock depletion.
When big ASX news breaks, our subscribers know first
How Severe Is the Global Oil Inventory Shortage Right Now?
OECD Stocks Are Approaching Multi-Decade Lows
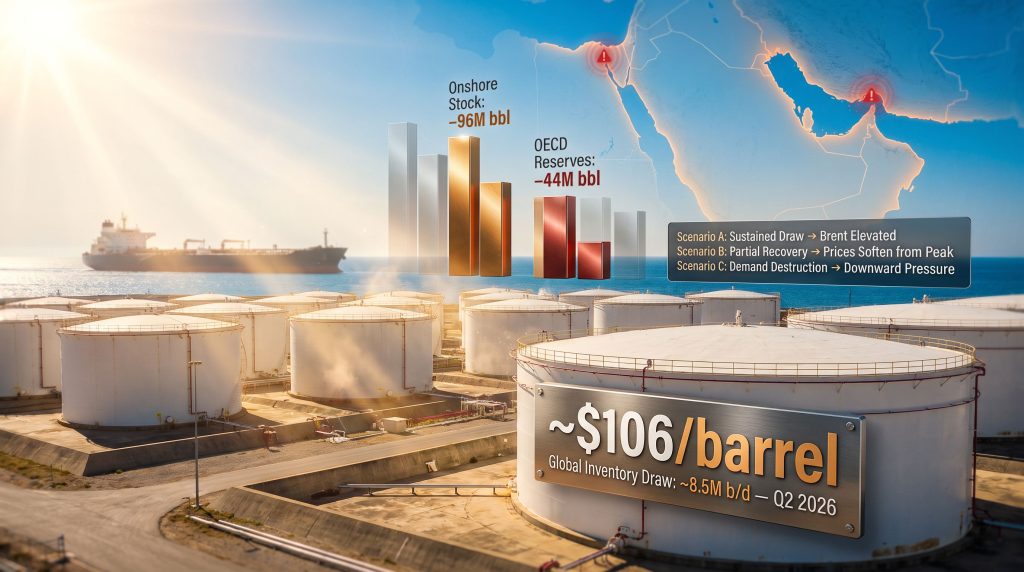
The raw data from the second quarter of 2026 is difficult to frame as anything other than alarming by historical standards. Global inventory draws averaged approximately 8.5 million barrels per day through Q2 2026, a depletion rate that places this cycle among the most aggressive in recent market history. Brent crude averaged around $106 per barrel across May and June, reflecting the physical scarcity premium that inventory tightness typically generates.
| Inventory Metric | Current Status |
|---|---|
| Global inventory draw (Q2 2026 avg.) | ~8.5 million b/d |
| Brent crude average (May-June 2026) | ~$106/barrel |
| Onshore stock decline (June 2026) | ~96 million barrels |
| OECD government reserve drawdown | ~44 million barrels |
| Oil-on-water surge (June 2026) | +117 million barrels |
What makes these figures particularly notable is their simultaneity. Onshore commercial stocks fell by approximately 96 million barrels in June 2026 alone, while OECD government strategic reserves were drawn down by roughly 44 million barrels during the same period. When governments are actively releasing strategic reserves at that scale, it communicates genuine market stress rather than cyclical inventory management.
The Misleading Signal in Headline Inventory Numbers
One dimension of the current inventory picture that deserves closer scrutiny is the sharp rise in oil-on-water volumes. Floating crude storage and in-transit tanker volumes surged by approximately +117 million barrels in June 2026, a figure that, viewed in isolation, might suggest the market is better supplied than the onshore data indicates.
However, it does not. There are several reasons why rising oil-on-water metrics can be structurally misleading:
- Crude aboard tankers navigating extended alternative routes due to Red Sea and Suez Canal disruptions is effectively removed from active circulation for weeks or months longer than normal
- Floating storage is not a substitute for land-based inventory from a refinery feedstock availability perspective
- Higher oil-on-water volumes in a disruption environment can actually reflect supply tightness rather than supply abundance, as barrels accumulate in transit rather than reaching end markets
The distinction matters enormously for price formation. What appears to be inventory on paper may be physically inaccessible for weeks, creating a functional supply gap that is larger than aggregate headline figures imply. Furthermore, the crude oil price trends observed through 2025 and into 2026 established the foundation for this increasingly complex dynamic.
Middle Distillate Deficits: The Refined Products Crisis Beneath the Crude Headline
Beneath the crude oil narrative sits an equally significant problem in refined products, particularly middle distillates. Gasoil and diesel shortfalls are present across Northwest Europe and Singapore, two of the world's most important refined product hubs. U.S. distillate inventories have partially recovered from their May 2026 lows but remain meaningfully below year-ago levels and the five-year seasonal average.
This matters for several interconnected reasons:
- Middle distillate scarcity typically precedes broader crude market stress by weeks to months, functioning as an early-warning indicator for tightening upstream conditions
- Refinery throughput decisions driven by poor distillate margins can paradoxically reduce crude demand while worsening product availability
- Gasoil shortfalls across Northwest Europe and Singapore suggest that even modest further disruptions to crude supply could rapidly translate into downstream product crises
The persistence of distillate deficits across three geographically distinct markets simultaneously suggests this is not a regional anomaly but a structural feature of the current supply-demand balance.
What Is OPEC+'s Current Production Strategy and Can It Rebalance the Market?
Breaking Down the September 2026 Output Increase
OPEC+ announced an incremental production increase of 188,000 barrels per day for September 2026, forming part of a broader monthly restoration target of approximately 547,000 b/d. The distinction between these two figures is critical and frequently misunderstood in market commentary.
The 188,000 b/d figure represents the incremental addition for a single month, while the 547,000 b/d target reflects the cumulative monthly pace at which the group has been unwinding voluntary cuts across 2025 and into 2026. By mid-2026, OPEC+ had effectively reversed the full scope of its voluntary production restraint programme. Understanding OPEC's influence on global markets is essential context for interpreting why these announcements consistently generate more market movement than their physical delivery warrants.
On paper, this represents a significant volume restoration. In physical markets, the effect has been considerably more muted, for reasons that market analysts at PVM Oil Associates, part of TP ICAP, have consistently flagged: the gap between announced quota targets and actual barrel delivery to consumers is widened by capacity constraints, infrastructure limitations, and disrupted export corridors. As analysts at PVM Oil Associates have noted, the announcement of higher targets does not automatically translate into higher volumes reaching end markets.
The Capacity Constraint Problem Inside OPEC+
Several OPEC+ member states are operating at or near their effective production ceilings, meaning quota increases above those ceilings are theoretical rather than physical. The specific dynamics creating this constraint include:
- Export terminal saturation in certain Gulf producers limiting the rate at which increased output can be loaded onto tankers
- Pipeline infrastructure bottlenecks constraining landlocked producers' ability to move additional volumes to ports
- Maintenance backlogs that accumulated during the period of voluntary cuts, reducing immediately available capacity when ramp-up is required
- Shipping route disruptions that reduce the effective delivery rate of barrels already produced
The cumulative result is that OPEC+'s actual output consistently underperforms its stated targets, a pattern that has persisted throughout the voluntary cut reversal cycle. According to Investopedia's analysis of OPEC's pricing power, the gap between policy intent and market delivery has historically been a persistent feature of cartel-style production coordination.
Has Full Reversal of Voluntary Cuts Actually Delivered?
The technical definition of full reversal within the OPEC+ framework refers specifically to the elimination of the additional voluntary cuts that member states agreed to layer on top of their baseline production commitments from 2023 onward. Full reversal does not mean production at maximum theoretical capacity. It means production at the pre-voluntary-cut baseline, which itself sits below the historical peak output of most member states.
This definitional nuance is routinely obscured in market reporting. The result is that headlines announcing full cut reversal imply a degree of supply restoration that the physical data simply does not support.
Which Geopolitical Flashpoints Are Amplifying Supply Risk in 2026?
Middle East Conflict Zones and Energy Infrastructure
Ongoing attacks targeting oil and energy infrastructure across the broader Middle East region have introduced a persistent supply disruption premium into crude pricing. The frequency and severity of these events through 2026 have been sufficient to prevent any sustained normalisation of regional export flows, even during periods when diplomatic dialogue has reduced the risk of direct state-on-state military escalation.
Persian Gulf and Red Sea shipping lane disruptions have materially altered tanker routing patterns, with vessels diverting around the Cape of Good Hope rather than transiting the Suez Canal. The knock-on effects include:
- Extended voyage times of two to four weeks on key trade routes
- Elevated freight rates across the tanker market
- Effective reduction in the volume of crude in active global circulation at any given point in time
- Upward pressure on insurance premiums for vessels operating in affected zones
Kazakhstan Export Constraints: An Underreported Supply Bottleneck
While Middle East disruptions dominate market attention, the constraints on Kazakhstani crude exports represent a materially significant but frequently underreported supply bottleneck. Kazakhstan's primary export route, the Caspian Pipeline Consortium system, has experienced capacity and operational challenges that have reduced the volume of Caspian Basin crude reaching European refineries.
This matters particularly for European refinery feedstock availability, where Kazakhstani crude grades serve as important inputs for complex refining configurations. Consequently, reduced Caspian supply compounds the already-stressed distillate picture across Northwest Europe.
Geopolitical Risk Matrix
| Risk Factor | Region Affected | Market Impact |
|---|---|---|
| Energy infrastructure attacks | Middle East | Supply disruption premium |
| Red Sea / Suez Canal disruptions | Global shipping lanes | Extended timelines, elevated freight |
| Kazakhstan export constraints | Caspian / Europe | Reduced feedstock availability |
| U.S.-Iran policy uncertainty | Global crude pricing | Persistent risk premium in forward curves |
| Ukraine conflict spillover | Eastern Europe / FSU | Refined product market stress |
U.S.-Iran Policy Uncertainty
Shifting diplomatic signals between Washington and Tehran have injected a layer of volatility into forward crude pricing that is difficult to quantify but impossible to ignore. The U.S. decision to postpone further military action following consultations with Gulf allies provided a brief market relief signal, but the absence of any durable agreement on sanctions or nuclear parameters means the risk premium embedded in oil forward curves has not been meaningfully reduced.
Market participants have learned from repeated experience that policy signals on Iran can reverse rapidly. In addition, the oil price rally driven by Trump tariffs demonstrated how geopolitical policy shifts can override supply fundamentals in the short term, making any removal of the geopolitical premium from forward prices a high-risk analytical position.
How Do Inventory Drawdowns Actually Drive Crude Price Behaviour?
The Mechanics of Inventory Depletion and Price Support
When global inventories draw at approximately 8.5 million b/d, the market's structural price floor shifts higher through a well-understood mechanical process. Days-of-supply coverage falls, creating urgency in procurement among refiners who cannot afford to experience feedstock shortfalls. This urgency translates directly into willingness to pay spot premiums above forward prices, the condition known as backwardation.
Backwardation is not merely a pricing curiosity. It signals that physical availability today is more valuable than the promise of supply tomorrow, reflecting genuine near-term scarcity. Sustained backwardation of the depth being observed in mid-2026 is historically consistent with periods of multi-month price elevation.
Comparing 2026 to Historical Tightening Episodes
The closest recent parallel to the current inventory cycle is the 2021–2022 post-pandemic drawdown period, when demand recovered faster than supply could respond. However, the 2026 cycle differs in several important respects:
- In 2021–2022, the supply constraint was primarily a capacity issue; in 2026, it is compounded by active geopolitical disruptions across multiple corridors simultaneously
- OPEC+ in 2022 was broadly increasing output in a cooperative framework; in 2026, the group is completing a reversal cycle that has repeatedly underdelivered versus target
- The 2026 cycle features simultaneous crude and refined product tightness, whereas 2021–2022 saw periods where crude and product markets diverged meaningfully
Scenario Modelling: Three Market Paths Through Q4 2026
Scenario A – Sustained Inventory Draw:
Middle East export flows remain constrained, OPEC+ actual output underperforms targets, and onshore inventories continue declining. Brent remains elevated above $100/barrel, distillate premiums widen further, and strategic reserve drawdowns accelerate.
Scenario B – Partial Supply Recovery:
OPEC+ members progressively close the gap between quota and actual output, some shipping route normalisation occurs. Prices soften modestly from peak levels but remain above long-run averages given below-norm stock positions. Distillate markets begin gradual rebalancing.
Scenario C – Demand Softening Overrides Supply Tightness:
Trade dispute escalation or inflation-driven demand destruction weakens consumption faster than inventory draws. Downward price pressure emerges despite structural supply constraints, with macro headwinds dominating the near-term price signal.
Most analysts treating this framework view Scenario B as the base case through August 2026, with Scenario A representing the upside risk and Scenario C the primary downside tail.
What Are the Key Price Indicators Traders and Analysts Are Watching?
Brent at $106: What the Benchmark Is Actually Communicating
A Brent crude average of approximately $106 per barrel across May and June 2026 is not simply a supply-demand equilibrium price. It reflects several compounding signals:
- A physical scarcity premium above fundamental cost-of-supply levels driven by inventory tightness
- A geopolitical risk premium reflecting active disruption across multiple supply corridors
- A backwardation premium compensating near-term sellers for delivering into a structurally undersupplied spot market
Physical crude differentials behaving at elevated levels relative to paper benchmarks further confirm that the tightness is real and not a futures market artefact.
Distillate Crack Spreads as a Leading Indicator
Gasoil and diesel crack spreads, which measure the refining margin between crude input costs and refined product sale prices, have been functioning as a leading indicator of broader crude market stress throughout this cycle. Elevated crack spreads across Northwest Europe, Singapore, and the U.S. Gulf Coast signal:
- Refinery throughput is insufficient to meet regional product demand
- Product importers are competing aggressively for available supply
- The tightness in refined products will eventually feed back into higher crude demand as refiners seek to maximise throughput
When distillate crack spreads remain elevated for extended periods, historical patterns suggest crude prices follow with a lag of approximately four to eight weeks. The EIA's Short-Term Energy Outlook provides updated distillate and crude inventory forecasts that serve as a key reference point for tracking these lagged dynamics.
The Trade Dispute and Inflation Overlay
The macro backdrop adds a layer of complexity that makes straightforward bullish positioning in crude more nuanced than the inventory data alone would suggest. Furthermore, the trade war's impact on oil prices has demonstrated how unresolved commercial disputes can erode demand forecasts even within a structurally tight supply environment.
Inflation simultaneously supports nominal oil prices while potentially eroding the volume of fuel consumption among price-sensitive consumers and industrial users. The result is a market where structural supply tightness and macro demand fragility are competing simultaneously, creating unusual volatility in both directions around a fundamentally elevated price level.
The next major ASX story will hit our subscribers first
Frequently Asked Questions: Tight Oil Inventories and OPEC+ Production Increases
Why Are Global Oil Inventories So Low Despite OPEC+ Increasing Production?
OPEC+ output increases announced through 2025 and 2026 have not translated into proportional physical supply relief because actual member-state output has been constrained by capacity ceilings, logistics limitations, and disrupted export routes. Simultaneously, global demand has remained resilient, and geopolitical disruptions have removed barrels from circulation across multiple supply corridors. The result is a market where tight global oil inventories and OPEC+ production increases coexist, with quota increases visible on paper but inventory drawdowns continuing in practice.
What Does an 8.5 Million Barrel Per Day Inventory Draw Mean for Oil Prices?
A sustained global inventory draw at this scale means physical supply is falling materially short of consumption. This creates upward price pressure as buyers compete for available barrels, pushes spot prices above forward prices (backwardation), and erodes the buffer stocks that normally absorb supply shocks. Historically, draws of this magnitude have corresponded with elevated and rising crude benchmarks over the subsequent one to three quarters.
How Do Red Sea and Persian Gulf Disruptions Affect Global Oil Supply?
Shipping disruptions across these corridors force tankers onto longer alternative routes, extending delivery timelines by weeks, increasing freight costs, and effectively reducing the volume of oil in active circulation at any given time. Even when production volumes remain stable, routing constraints reduce the rate at which barrels reach end markets, functionally tightening supply without any change in upstream output. A detailed geopolitical and OPEC analysis of these disruption dynamics provides additional context for understanding the cumulative supply impact.
Could Weak Demand Offset the Inventory Tightness?
Demand deterioration driven by trade disputes, inflationary pressure, or broader economic slowdown represents the primary downside risk to the current supply-tightness thesis. If consumption weakens materially before inventory positions recover, the supply-demand balance could shift more rapidly than current forecasts suggest. Most analysts view this as a tail risk rather than a base case for the near-term outlook, though macro uncertainty has increased materially through mid-2026.
What Is the Significance of OECD Government Reserve Drawdowns?
Strategic reserve releases totalling approximately 44 million barrels in June 2026 alone indicate that policymakers are actively intervening to supplement commercial supply. This is a signal of genuine market stress rather than routine inventory management. Sustained government reserve drawdowns also reduce the buffer available to absorb future supply shocks, making the market more vulnerable to price spikes if disruptions intensify. According to J.P. Morgan's oil price research, sustained strategic reserve depletion at this pace historically precedes an acceleration in crude benchmarks during subsequent quarters.
The Bottom Line: Why Physical Market Realities Are Overriding OPEC+ Policy Signals
The Three Forces Keeping Oil Prices Supported Through August 2026
- Structural inventory deficits across onshore OECD and non-OECD storage that remain well below seasonal norms despite partial improvements
- Geopolitical supply disruptions preventing normal export flow recovery across multiple producing regions simultaneously
- The execution gap between OPEC+ production targets and the volumes physically reaching consuming markets
What Would Need to Change for the Market to Rebalance?
- A durable, sustained recovery in Middle East crude export flows, not just diplomatic announcements or temporary pauses in conflict activity
- OPEC+ member-state output consistently meeting or exceeding quota targets over multiple consecutive months
- Demand softening sufficient to reduce the pace of inventory draws below the rate of new supply additions
- A reduction in shipping disruptions across the Red Sea and Suez Canal significant enough to restore normal tanker routing patterns
Key Takeaways for Market Participants
Summary of Critical Market Dynamics:
Global inventory draws of ~8.5 million b/d in Q2 2026 represent one of the most aggressive depletion rates in recent market history. OPEC+'s 188,000 b/d September increment and broader 547,000 b/d monthly target increase are unlikely to single-handedly restore buffer stocks given current export constraints. Middle distillate shortfalls in the U.S., Northwest Europe, and Singapore signal independent stress in refined product markets beyond crude oil. Geopolitical risk across the Middle East, Red Sea, and Caspian Basin remains the most volatile variable in near-term price forecasting. Prices are expected to remain firm through August 2026 unless export flows recover sustainably or demand weakens materially.
The tight global oil inventories and OPEC+ production increase dynamic defining mid-2026 crude markets is unlikely to resolve quickly. The physical constraints binding actual supply delivery are structural rather than transitory, and the geopolitical forces sustaining disruption premiums show no clear path to near-term resolution. For market participants, the key analytical discipline is maintaining the distinction between what OPEC+ announces and what the physical market actually receives.
Want to Stay Ahead of the Next Major Resource Discovery Before the Market Moves?
While crude oil markets grapple with the widening gap between policy announcements and physical delivery, Discovery Alert's proprietary Discovery IQ model delivers real-time alerts on significant ASX mineral discoveries, transforming complex resource data into actionable investment insights for both short-term traders and long-term investors. Explore how historic mineral discoveries have generated substantial returns and begin your 14-day free trial today to position yourself ahead of the broader market.