
August 3, 2026
When Sentiment Overrides Supply: Understanding How Oil Falls on Iran De-Escalation and Crude Draw Signals Diverge
Commodity markets have a peculiar habit of ignoring fundamentals precisely when those fundamentals matter most. Oil pricing operates through two entirely separate mechanisms that frequently pull in opposite directions: the physical reality of barrels in storage and the psychological architecture of perceived risk. When these two forces collide, the result is a price move that appears contradictory on the surface but follows a rational, if often misunderstood, logic. The recent episode in which oil falls on Iran de-escalation and crude draw data simultaneously tells exactly this story, and understanding why requires looking well beneath the headline figures.
When big ASX news breaks, our subscribers know first
The Two-Layer Structure of Crude Oil Pricing
Most investors treat oil as a single price driven by supply and demand. In practice, the spot price of Brent or WTI at any given moment reflects two stacked components that respond to entirely different inputs.
The first layer is fundamental value: the price justified by current inventory levels, refinery utilisation rates, production volumes, and demand trajectories. This layer moves gradually, responding to weekly EIA reports, OPEC+ production decisions, and seasonal consumption patterns.
The second layer is the geopolitical risk premium: an additional price cushion that markets embed when physical supply routes face credible threats. This premium is not static. It inflates rapidly when escalation signals emerge and collapses almost instantaneously when diplomatic signals suggest those threats have receded, regardless of whether a single physical barrel has changed hands.
This structural asymmetry explains a phenomenon that repeatedly catches less experienced market participants off guard: oil prices can fall sharply even when inventory data is bullish, because the risk premium layer is responding to information that has nothing to do with supply and demand. Furthermore, understanding crude oil price trends helps investors contextualise these divergences within longer-term market cycles.
The key insight for energy-exposed investors is not whether prices fell, but why they fell. A risk premium collapse is a fundamentally different market signal than a genuine deterioration in physical supply conditions, and the investment implications of each diverge sharply.
How the Iran De-Escalation Removed the Hormuz Risk Layer
The specific trigger for the most recent selloff was a decision to call off a planned military strike on Iran following a request for additional negotiating time. That single diplomatic development was sufficient to remove a substantial portion of the risk premium that had been built into crude benchmarks over the preceding weeks.
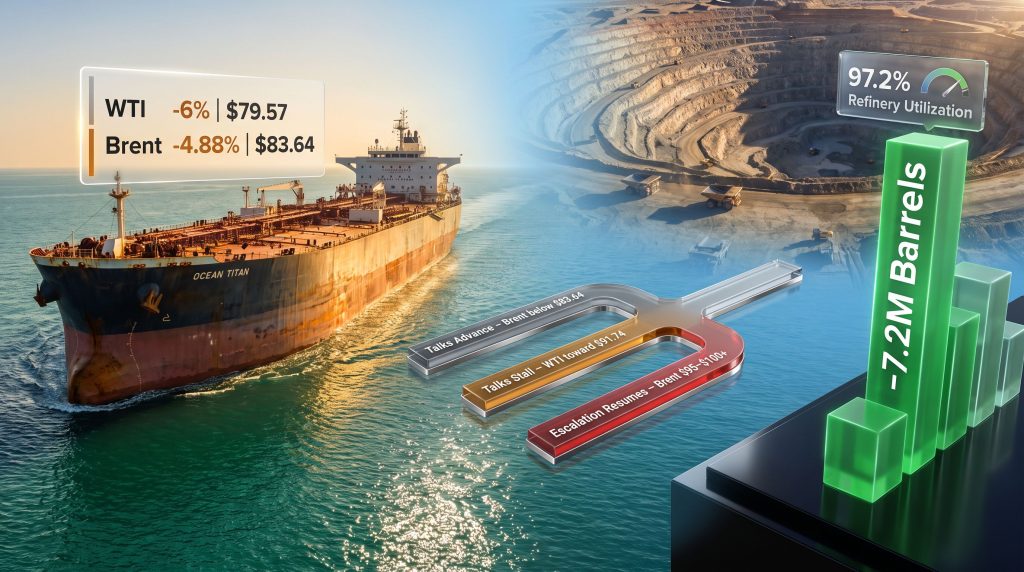
WTI declined approximately 6%, settling near $79.57 per barrel. Brent fell approximately 4.88%, settling near $83.64 per barrel. According to Reuters reporting on the oil price decline, US and European equity futures advanced simultaneously, confirming that this was a broad risk-off-to-risk-on rotation rather than an oil-specific supply development.
The divergence in the magnitude of decline between Brent and WTI is itself informative. Brent, as the global seaborne benchmark, carries greater sensitivity to Strait of Hormuz disruption risk because it reflects the supply routes used by the Gulf's major exporters. WTI, reflecting landlocked US production, typically responds more directly to domestic inventory and refinery data. The fact that WTI fell more than Brent in percentage terms during this episode suggests that some of the decline reflected broader dollar and equity dynamics beyond the purely geopolitical risk premium removal.
Why the Strait of Hormuz Commands Such an Outsized Premium
The Strait of Hormuz is a waterway of genuinely extraordinary strategic importance. Approximately 20% of globally traded seaborne oil passes through this narrow chokepoint, making it the single most consequential maritime passage in the energy world. Major Gulf exporters including Saudi Arabia, the UAE, Kuwait, Iraq, and Iran all depend on Hormuz access to reach international markets.
| Metric | Detail |
|---|---|
| Estimated share of global seaborne oil | ~20% of global oil trade |
| Key exporters dependent on Hormuz | Saudi Arabia, UAE, Kuwait, Iraq, Iran |
| Historical Brent premium during closure scenarios | $20 to $40+ per barrel |
| Negotiating status (early August 2026) | Talks ongoing; Iran's Fars News rejected initial US terms |
The historical record of Brent premiums during Hormuz disruption scenarios explains why even a partial reduction in that risk can trigger a price move of the magnitude observed. When traders price in a $15 to $30 risk premium and then receive a diplomatic signal suggesting that premium may be unwarranted, the mechanical repricing is immediate and severe.
Critically, Iran's Fars News agency publicly rejected the proposed framework, including terms related to reopening the Strait of Hormuz. This rejection is the single most important detail that separates a durable price decline from a temporary sentiment-driven one. The risk premium was not permanently removed — it was suspended pending the outcome of Monday's negotiations. Traders who sold aggressively on the headline may face rapid reversal exposure. The broader trade war oil markets dynamic adds yet another layer of complexity to this already volatile pricing environment.
What the EIA Data Actually Says About Physical Supply
While the diplomatic headline dominated price action, the concurrent EIA inventory report told a structurally different story about the physical state of the US crude market.
For the week ending July 24, 2026, the US Energy Information Administration reported data that any fundamental analyst would characterise as decidedly bullish for crude prices:
| EIA Data Point | Reported Figure |
|---|---|
| Commercial crude stock change | -7.2 million barrels |
| Total commercial crude inventories | 404.5 million barrels |
| Deviation from five-year seasonal average | Approximately -6% |
| Refinery utilisation rate | 97.2% of capacity |
| Crude inputs to refineries | 17.3 million barrels per day (+271,000 bpd week-over-week) |
A 7.2 million barrel weekly draw is a substantial reduction by any historical standard. Combined with inventories sitting approximately 6% below the five-year seasonal average, this data confirms that the US physical crude market is operating with meaningfully less buffer than historical norms would suggest.
The 97.2% refinery utilisation rate is particularly significant. Near-maximum refinery runs indicate that crude demand from the processing sector remains robust, which structurally supports prices. Refineries do not run at 97% capacity when demand is soft. This data point alone challenges the narrative that a sub-$80 WTI price reflects genuine market equilibrium.
Why did oil fall if crude inventories drew down? Oil prices declined because diplomatic signals between the US and Iran reduced the geopolitical risk premium embedded in Brent and WTI. The 7.2 million barrel crude draw reflects strong physical demand, but sentiment-driven price moves can temporarily override fundamental supply signals, typically over a two to four week horizon before fundamentals reassert themselves.
Reading the Conflicting Signals Side by Side
| Signal Type | Direction | Implication |
|---|---|---|
| Diplomatic de-escalation (Iran talks) | Bearish | Risk premium removed, prices fall |
| EIA crude draw of 7.2 million barrels | Bullish | Physical supply tightening |
| Refinery utilisation at 97.2% | Bullish | Strong crude demand confirmed |
| Iran's rejection of US terms | Bullish | Risk premium may return rapidly |
| Equity futures advancing | Mixed | Risk-on rotation, dollar strength potential |
Three Scenarios Institutions Are Pricing for Oil's Next Move
With the outcome of negotiations unresolved, institutional traders are working within a defined scenario architecture rather than a single price forecast. Each scenario carries distinct implications for crude benchmarks and, critically, for the fuel cost structures of mining operations globally.
Scenario 1: Base Case — Talks Stall and the Risk Premium Partially Rebuilds
In this scenario, negotiations fail to advance beyond the rejected framework. Strike planning resumes, and the geopolitical risk premium that was removed in the selloff begins to rebuild incrementally. WTI recovers toward its late-July weekly average of $91.74, representing a potential recovery of more than $12 per barrel from the post-selloff settlement. Brent rebounds above $87. Diesel costs for fuel-intensive industries begin climbing back toward prior levels.
Scenario 2: Bull Case for Oil — Full Escalation Resumes
A complete collapse of negotiations triggers renewed military posturing, pushing Brent toward the $95 to $100 range and potentially beyond if Hormuz access is credibly threatened. Under this scenario, the EIA's August 5, 2026 report would need to show continued inventory draws to validate the supply-tightness narrative. Mining and logistics operators would face the most pronounced diesel cost headwinds of any scenario outlined here.
Scenario 3: Bear Case for Oil — Talks Advance and Hormuz Reopens
A framework agreement that includes terms for Hormuz access restoration removes the risk premium more durably. Brent consolidates below $83.64, potentially testing lower technical support levels. Physical inventory data would need to deteriorate substantially to offset the compounding bearish impact of genuine diplomatic resolution. Under this scenario, diesel costs for mining operators would decline, providing meaningful margin relief.
$91.74 WTI functions as the institutional benchmark for whether geopolitical risk has been fully repriced back into oil. A sustained close above this level confirms that the risk premium has returned and that fuel-intensive mining operations face rising cost pressures.
The Direct Transmission From Crude Benchmarks to Mining Operating Costs
The implications of oil price movements extend well beyond the upstream energy sector. Mining operations rank among the most fuel-intensive industries in the global economy, and the channel through which crude price changes transmit to mine-site operating costs is direct and well-documented.
Diesel powers the core machinery of virtually every large-scale mining operation:
- Haul trucks, which represent the single largest category of fuel consumption on most open-pit mine sites
- Drill rigs used across both exploration and production drilling programmes
- On-site power generation at remote operations lacking grid connectivity
- Processing equipment and auxiliary machinery throughout the production chain
Research from S&P Global provides a rigorous quantitative framework for understanding this transmission. A 60% increase in fuel prices was found to raise manganese mining cash costs by approximately $7.59 per dry metric ton, representing a 6.55% uplift to the global manganese cost base. That analysis was anchored to a period when Brent rose more than 50% in March 2026 and was forecast to average $125 per barrel in April 2026, while diesel climbed approximately 34% to around $5 per gallon. The commodity price impact on mining margins during such periods has been well documented across multiple commodity classes.
Which Mining Commodities Face the Highest Diesel Cost Exposure
Not all mining operations carry equal fuel intensity. The commodities most exposed to diesel cost inflation share characteristics of high haulage volumes, remote locations, or energy-intensive processing requirements:
- Open-pit bulk commodities (iron ore, manganese, coal): highest haul truck fuel intensity per tonne of production
- Remote gold and copper operations: dependent on diesel generation where grid power is unavailable
- Lithium brine and hard rock operations: processing and haulage both carry significant fuel dependency
- Nickel laterite mining: energy-intensive processing adds fuel exposure beyond simple haulage
However, it is worth noting that mining decarbonisation benefits are increasingly relevant here, as operators who have invested in electrification and alternative energy sources are proving more resilient to these diesel cost cycles.
What Brent at $83.64 Means for Mining Cost Trajectories
| Oil Price Scenario | Approximate Brent Level | Directional Impact on Diesel | Mining Cost Implication |
|---|---|---|---|
| Full de-escalation, Hormuz reopens | Below $83.64 | Declining | Margin improvement for fuel-intensive miners |
| Talks stall, partial risk premium returns | $87 to $92 | Elevated but stable | Cost pressure contained |
| Escalation resumes, Hormuz threatened | $95 to $100+ | Rising sharply | Significant cash cost headwinds |
| Peak escalation scenario (April 2026) | ~$125 | +34% vs. baseline | 6.55%+ uplift to global cost base |
The next major ASX story will hit our subscribers first
Policy Credibility, Dollar Dynamics, and the Macro Variables That Could Override the Iran Narrative
Oil pricing does not occur in a vacuum isolated from broader macroeconomic forces. US Treasury Secretary Scott Bessent's commentary regarding a potential expansion of the Federal Reserve's dollar liquidity backstop introduced an additional variable into the market's analytical framework during this period.
Senior market analyst Matt Simpson of StoneX observed that the credibility of such policy statements can carry more market weight than the actual implementation itself, underscoring how institutional trust and forward guidance shape commodity pricing alongside physical fundamentals. This observation reflects a broader truth about commodity markets: perceived policy direction frequently moves prices before any tangible change in physical supply or demand occurs.
The dollar dimension matters specifically for oil because crude is globally priced in USD. Dollar strengthening creates a headwind for non-US buyers, effectively raising the cost of crude in local currency terms and suppressing demand. Any Fed policy development that strengthens the dollar therefore adds a second channel of downward pressure on oil prices, independent of the geopolitical situation.
Additional macro variables that could amplify or dampen the Iran narrative include:
- Chinese economic data releases, given China's position as the world's largest crude importer and the primary swing variable in global demand forecasts
- OPEC market influence, which could tighten supply independent of the Hormuz situation
- Global equity market risk appetite, as risk-on environments tend to support commodity demand expectations
- Federal Reserve policy trajectory and its cascading impact on the US dollar index
The August 5 EIA Report: The Next Critical Data Point
The next scheduled EIA Weekly Petroleum Status Report represents the most significant near-term catalyst for validating or challenging the current price level. Several specific thresholds will determine how the market interprets the physical supply picture in the context of ongoing diplomatic uncertainty:
-
Commercial crude inventories falling below 404.5 million barrels would confirm that physical tightness is deepening, establishing a stronger fundamental floor under prices even if geopolitical risk premiums remain temporarily compressed.
-
Refinery utilisation remaining above 95% would validate continued strong crude demand and support the bullish physical case.
-
A crude inventory build would validate the bearish sentiment established by the de-escalation selloff and potentially push WTI below $79.57.
-
A draw exceeding 5 million barrels combined with continued high refinery utilisation would create maximum tension between the bearish geopolitical sentiment and the bullish physical supply picture, historically a setup that resolves in favour of fundamentals over a two to four week horizon.
If the EIA reports another large crude draw while Iran talks remain unresolved, the market faces a structural tension between bearish sentiment from de-escalation headlines and bullish fundamentals from tightening physical supply. This divergence historically resolves in favour of fundamentals over a two to four week horizon, suggesting that the recent price decline may represent a time-limited opportunity for energy-exposed investors to reassess positioning. As OilPrice.com reported, the speed of the selloff itself reflects how aggressively the risk premium had been priced in beforehand.
Frequently Asked Questions
Why does oil fall when Iran de-escalation news emerges?
When diplomatic signals suggest a reduced probability of conflict near the Strait of Hormuz, traders remove the geopolitical risk premium embedded in crude prices. Depending on the perceived severity of the threat, this premium can represent $5 to $20 or more per barrel. Its removal causes sharp, rapid price declines even when physical supply conditions remain unchanged.
What is a crude inventory draw and why does it matter for oil prices?
A crude inventory draw occurs when US commercial crude stockpiles decline over a given week, as reported by the EIA. A draw signals that demand is outpacing supply in the physical market, which is fundamentally supportive of prices. The 7.2 million barrel draw for the week ending July 24, 2026 left inventories approximately 6% below the five-year seasonal average, a level that indicates reduced buffer capacity in the US storage system.
How do oil price movements translate into real costs for mining operations?
Diesel is refined from crude oil, so crude benchmark movements transmit directly to diesel costs at mine sites. S&P Global's research found that a 60% increase in fuel prices raised manganese mining cash costs by $7.59 per dry metric ton, a 6.55% increase to the global cost base, illustrating the direct and material relationship between crude benchmarks and operational mining margins.
What does WTI at $91.74 represent as an institutional reference level?
$91.74 represents WTI's weekly average price for the week ending July 24, 2026 — the level at which the market was fully pricing the geopolitical risk premium from the Iran conflict. A sustained close above this level signals that the risk premium has been fully restored, indicating higher diesel costs ahead for fuel-intensive mining operations globally.
Disclaimer: This article is intended for informational purposes only and does not constitute financial or investment advice. Oil price forecasts, scenario projections, and cost impact estimates involve inherent uncertainty and should not be relied upon as predictions of future market conditions. Readers should conduct independent research and consult qualified financial advisers before making investment decisions. All figures referenced are sourced from publicly available data including the US Energy Information Administration and S&P Global.
Want to Stay Ahead of the Next Major ASX Mineral Discovery?
Discovery Alert's proprietary Discovery IQ model delivers real-time alerts on significant ASX mineral discoveries, cutting through market noise to identify actionable opportunities the moment they are announced — explore historic discoveries and their exceptional returns, then begin your 14-day free trial to position yourself ahead of the broader market.