
August 10, 2026
When Paper Markets Lose Their Nerve: Understanding the Psychology Behind Crude Oil Positioning
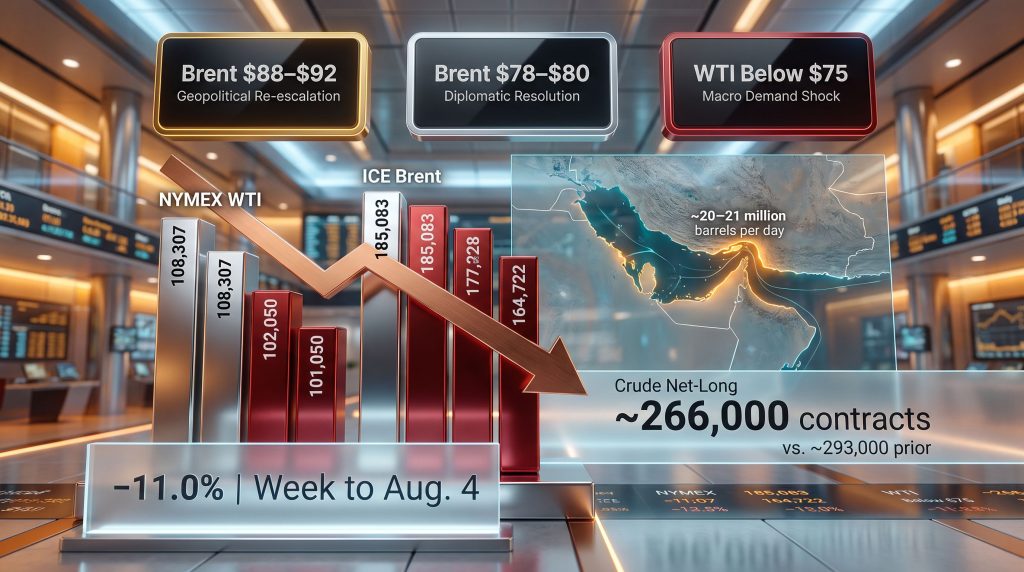
There is a well-documented gap between what crude oil markets should do based on geopolitical fundamentals and what institutional money managers actually do when uncertainty compounds. In textbook theory, a chokepoint as strategically critical as the Strait of Hormuz, handling an estimated 20 to 21 million barrels per day of crude and petroleum products at peak throughput, should anchor speculative positioning firmly in bullish territory for as long as supply disruption risk remains unresolved. In practice, markets operate differently.
Probability discounting, liquidity constraints, and macro anxiety collectively erode the appetite for directional bets long before a diplomatic resolution is confirmed. These dynamics, explored further through a crude oil market overview, provide essential context for understanding where positioning currently stands.
That tension between geopolitical reality and speculative behaviour sits at the heart of the current crude oil positioning landscape, where bullish oil bets shrink for a second week running across both major futures benchmarks.
When big ASX news breaks, our subscribers know first
What the COT Report Reveals About Institutional Sentiment
The Commitment of Traders report, published weekly by the CFTC and ICE, functions as a real-time window into the directional convictions of the most sophisticated participants in commodity markets. For energy analysts, the money manager category within this report is the most closely tracked, as it captures the positioning of hedge funds, commodity trading advisors, and other institutional speculators whose behaviour tends to both reflect and amplify near-term price trends.
When net-long positions in this category decline, it does not necessarily mean prices will fall immediately. It means that the pool of speculative capital supporting upward price momentum is contracting, removing a structural layer of buying pressure that markets often depend upon to sustain rallies.
The Two-Week Drawdown in Numbers
The positioning data for the week ending August 4 reveals a meaningful contraction across both major crude benchmarks:
| Benchmark | Prior Net Long Position | Latest Net Long Position | Change | % Move |
|---|---|---|---|---|
| NYMEX WTI | ~108,307 lots | 101,050 lots | -7,257 lots | ~-6.7% |
| ICE Brent | ~185,083 lots | 164,722 lots | -20,361 lots | -11.0% |
| Combined Crude | ~293,000 contracts | ~266,000 contracts | -25,000+ contracts | ~-8.5% |
Several dimensions of this data deserve careful attention:
- The Brent reduction of 11% in a single reporting week represents a substantive institutional pullback, not a marginal trimming of exposure
- WTI net longs at 101,050 lots are approaching territory that has historically been associated with cautious or range-bound price expectations among market participants
- The combined crude net long of approximately 266,000 contracts follows an aggressive accumulation phase, with roughly 171,000 contracts of net buying recorded across the prior three weeks, making the reversal statistically significant rather than noise
- Saxo Bank's Head of Commodity Strategy Ole Hansen characterised the weekly reduction as a 25,000-contract drawdown in the combined crude net long, noting that despite ongoing supply disruption risks, positioning continues to indicate limited conviction in any sustained price advance
According to recent hedge fund activity data, bullish oil bets had previously hit a four-month high before the current retreat, underscoring just how sharp this reversal in speculative conviction has been.
COT Timing Caveat: The COT report carries a three-day publication lag, reflecting positions held as of the prior Tuesday. This means rapid geopolitical developments, such as tanker strikes or diplomatic announcements mid-week, may already be partially stale by the time the data is released and analysed.
Three Psychological Forces Driving the Speculative Retreat
Understanding why bullish oil bets shrink for a second week running requires looking beyond the headline numbers to the behavioural mechanics driving position reduction. Three interconnected forces are at work.
1. Geopolitical Risk Premium Erosion
Crude oil futures markets price geopolitical risk as a probabilistic premium above fundamental supply-demand value. When a new threat emerges, momentum-driven funds rapidly build long positions to capture the expected price spike. The problem arises when resolution signals emerge without actual resolution.
Early indications of a potential Strait of Hormuz management arrangement between Iran and Oman were sufficient to begin deflating the fear premium, even in the absence of a confirmed agreement. The broader dynamics of crude oil trade geopolitics help explain why such diplomatic signals carry such outsized weight in futures markets.
This creates a phenomenon where traders are simultaneously responding to diplomatic signals they believe reduce tail risk, while the underlying supply disruption remains entirely unresolved. The market prices the expectation of normalisation rather than normalisation itself, leaving investors exposed to abrupt repricing if negotiations collapse.
2. Surplus Anxiety and Structural Supply Growth
Beyond geopolitics, a growing unease about the medium-term supply trajectory is weighing on speculative appetite. Furthermore, several supply-side developments compound this concern:
- Russian crude production climbed above 9 million barrels per day in July, sustaining output at levels that complicate OPEC+ cohesion and add persistent volume to global markets
- Libya has outlined production ambitions targeting 2 million barrels per day by the early 2030s, which would represent a meaningful long-term addition to global supply capacity
- U.S. diesel exports recently reached record highs even as domestic stockpiles declined, a signal that refinery output is running at elevated capacity and adding refined product volume to international markets
- ING commodities strategists Warren Patterson and Ewa Manthey noted in a published research note that speculative sentiment turned more cautious in the most recent reporting week, consistent with these mounting supply-side pressures
3. Liquidity Constraints and Reversal Risk
A less-discussed but increasingly important factor is the structural decline in crude oil market liquidity observed in recent months. Thinner order books make large directional bets more expensive to unwind under adverse conditions, raising the cost of being wrong.
For institutional managers running risk-adjusted mandates, this asymmetry discourages new bullish position-building even when fundamental supply disruptions remain active. The practical consequence is that traders have become increasingly reluctant to absorb the reversal risk that accompanies large net-long accumulations, preferring to reduce gross exposure and preserve optionality rather than defend directional positions through high-uncertainty macro windows.
The Hormuz Variable: Unresolved Risk That Markets Are Discounting
The Strait of Hormuz remains one of the most consequential energy chokepoints on the planet. Shipping data indicates that vessel transit volumes through the waterway have dropped sharply as tensions have escalated, and ADNOC has publicly reported 15 vessel attacks in the region.
An Iraq-Syria pipeline that could potentially bypass Hormuz has been discussed as a revival candidate within a three-year timeframe, underscoring how seriously regional planners are taking the disruption risk. Yet despite all of this, speculative positioning has declined, and this divergence reveals something important about how sophisticated market participants are thinking.
The Probability vs. Possibility Distinction: Markets do not price worst-case scenarios at face value. They price the probability-weighted expected outcome. An unresolved Hormuz situation that has persisted without a catastrophic supply interruption gradually trains market participants to assign lower probabilities to escalation, even as the possibility remains real.
The event-driven price action visible in the most recent trading sessions illustrates this dynamic clearly. Iran's issuance of six sweeping demands as preconditions for a peace arrangement with the United States, combined with Houthi claims of a ballistic missile strike on an Aramco refinery in Jazan, drove an immediate and sharp market reaction.
Brent front-month futures surged to $85.81, a gain of 2.70%, while WTI climbed to $80.28, up 2.69% in early trading. However, this repricing reflects event-driven volatility rather than a structural reversal in speculative positioning. The two are fundamentally different signals, and conflating them leads to misreading the market's actual directional conviction.
Demand-Side Pressures Reinforcing Bearish Institutional Behaviour
The supply picture does not operate in isolation. Demand uncertainty is simultaneously compressing speculative enthusiasm from the other direction.
- India, which imports approximately 90% of its oil requirements, has seen domestic crude output fall for a third consecutive year, sustaining import dependency but not necessarily at volumes capable of providing strong price support
- China's crude import volumes rebounded after a historically weak June performance, but the durability of that recovery remains in question given persistent economic headwinds and the pivot by China's top refiner toward Russian crude as a cost management strategy
- European natural gas storage has fallen to its lowest level since 2011 heading into the winter season, creating cross-commodity capital allocation pressures that could redirect energy sector flows in ways that affect crude positioning indirectly
- The Hormuz bottleneck has already begun pushing Indian refiners toward West African crude grades as an alternative sourcing strategy, introducing new freight and logistics dynamics into the demand picture
Consequently, the trade war oil markets dynamic has added yet another layer of demand-side uncertainty that institutional investors are clearly factoring into their positioning decisions.
Scenario Analysis: Three Price Trajectories Worth Tracking
For investors attempting to position around the current COT data, three plausible scenarios present meaningfully different outcomes:
| Scenario | Positioning Signal | Likely Price Outcome | Key Trigger |
|---|---|---|---|
| Geopolitical Re-escalation | Net longs rebuild rapidly | Brent tests $88-$92 range | Confirmed Hormuz supply disruption |
| Diplomatic Resolution | Net longs continue declining | Brent retreats toward $78-$80 | Iran-Oman deal confirmed; Hormuz normalises |
| Macro Demand Shock | Gross short positions increase | WTI breaks below $75 | Recession signals from major economies |
Citi's revised Brent price outlook adds an important layer to this framework. The bank has lifted its near-term Brent projections while simultaneously maintaining a bearish medium-term view, with price weakness projected to extend into 2027.
This bifurcated stance — bullish near-term on geopolitical floors, bearish longer-term on structural oversupply — appears to be the thesis most closely anchoring current speculative behaviour. Institutional managers appear to be tracking the 2027 trajectory more attentively than the immediate event risk headlines. In addition, OPEC market influence over production quotas and compliance continues to shape where the medium-term price ceiling may ultimately settle.
The next major ASX story will hit our subscribers first
How to Read a COT Report: A Practical Framework for Energy Investors
For investors who want to incorporate COT data into their analytical process, the following step-by-step framework provides a structured starting point:
- Identify the correct reporting category — Focus on the Money Managers segment rather than commercial hedgers, as this captures directional speculative conviction rather than production-related hedging activity
- Calculate the net long position — Subtract total short contracts from total long contracts to determine overall directional bias for the reporting period
- Track the weekly change in isolation — A declining net long signals sentiment deterioration; a rising net long indicates accumulating bullish conviction regardless of where spot prices are trading
- Contextualise against historical ranges — Compare current positioning against 52-week highs and lows to assess whether the market is in a crowded or thin positioning environment
- Cross-reference positioning with price action — Divergences between positioning and price, such as prices rising while net longs fall, can signal an impending reversal or a short-covering driven rally rather than fundamental conviction
- Monitor gross positions separately — Rising gross shorts alongside falling gross longs indicates active bearish positioning being built, not merely profit-taking by bulls exiting existing trades
Context on Crowded Positioning: Combined crude net-long positions above 400,000 to 500,000 contracts have historically been associated with crowded bullish conditions and elevated reversal risk. At approximately 266,000 contracts, the current combined position sits well below those historical extremes, suggesting the market is not technically in oversold territory from a pure positioning standpoint.
Key Signals Investors Should Be Watching
Several developments in the coming weeks will determine whether the current two-week positioning retreat extends into a sustained trend or reverses sharply. The oil volatility trends emerging from these catalysts could prove decisive for near-term directional momentum.
- Whether the reported Hormuz draft agreement awaiting approval from Iran's leadership moves toward formal ratification or stalls
- The trajectory of Russian crude output relative to OPEC+ compliance commitments, particularly given reports that Russia has recently turned to South Korea for fuel supplies as its domestic refinery crisis deepens following Ukrainian drone strikes
- China's monthly crude import volumes as a gauge of whether the post-June rebound has genuine momentum or represents temporary restocking behaviour
- Any shift in Aramco's pricing strategy, given reports that the company deepened its Asia oil discount ahead of a possible Hormuz deal, which signals that producers themselves are factoring in resolution probability
- The evolution of European energy storage heading into winter, which could generate unexpected demand for crude-linked products and alter the cross-commodity capital allocation picture
The pattern emerging from all of these threads is consistent: institutional participants are choosing caution over conviction, reducing exposure across both WTI and Brent while monitoring for a catalyst that provides genuine directional clarity.
Furthermore, as Reuters has noted, oil prices have remained surprisingly resilient despite months of US-Iran tensions, reinforcing the probability-discounting behaviour now clearly visible in the COT data.
Until either a confirmed supply disruption or a verified diplomatic resolution removes the current ambiguity, the speculative positioning data suggests crude oil markets are entering a period of structurally range-bound sentiment, punctuated by sharp but short-lived event-driven repricing. Where bullish oil bets shrink for a second week running, the signal is one of institutional patience rather than outright bearish conviction.
This article is intended for informational purposes only and does not constitute financial or investment advice. Futures markets involve substantial risk, and past positioning patterns are not indicative of future price outcomes. Readers should conduct independent research and consult a qualified financial adviser before making investment decisions.
Want to Stay Ahead of the Next Major Commodity Discovery?
While crude oil positioning reveals how institutional money responds to macro uncertainty, the real edge for investors often lies in identifying transformative mineral discoveries before the broader market catches on. Discovery Alert's proprietary Discovery IQ model delivers real-time ASX mineral discovery alerts, instantly converting complex geological data into actionable investment insights — explore the historic returns major discoveries have generated and begin your 14-day free trial today to position yourself ahead of the market.