July 28, 2026
The Mechanics Behind a Crude Market That Reprices Faster Than It Builds
Geopolitical risk premiums in commodity markets follow a well-documented asymmetry: they accumulate slowly during periods of escalating tension and dissolve violently once the threat begins to recede. This dynamic is not unique to oil, but crude markets express it with particular intensity given the concentration of global supply through a handful of critical chokepoints. Understanding the intersection of crude trade and geopolitics is essential context for interpreting what happened to WTI futures during the week of June 9 to 19, 2026, when August crude contracts shed nearly 9% of their value in a single week.
This is the story of the return of Iranian oil, the diplomatic architecture behind it, and why the market's reaction may be running ahead of physical reality.
When big ASX news breaks, our subscribers know first
Why Crude Oil Fell Nearly 9% in a Single Week and What It Really Means
The Anatomy of a Geopolitical Risk Unwind
When conflict disrupts a critical supply corridor, crude prices absorb a risk premium that reflects the probability-weighted cost of sustained supply loss. That premium builds gradually as traders, refiners, and hedgers price in worst-case scenarios. What makes the unwind so much faster and more severe is the nature of long-position liquidation. Traders who accumulated long exposure during the escalation phase do not exit positions gradually; they exit simultaneously once the catalyst for their original thesis is removed.
The result is a cascade. As prices fall, stop-loss orders are triggered, margin calls accelerate selling, and momentum traders pile on to the short side. Physical market tightness, however genuine, becomes temporarily irrelevant to a futures market driven by sentiment repositioning.
Key Price Levels That Defined the Week
| Metric | Value |
|---|---|
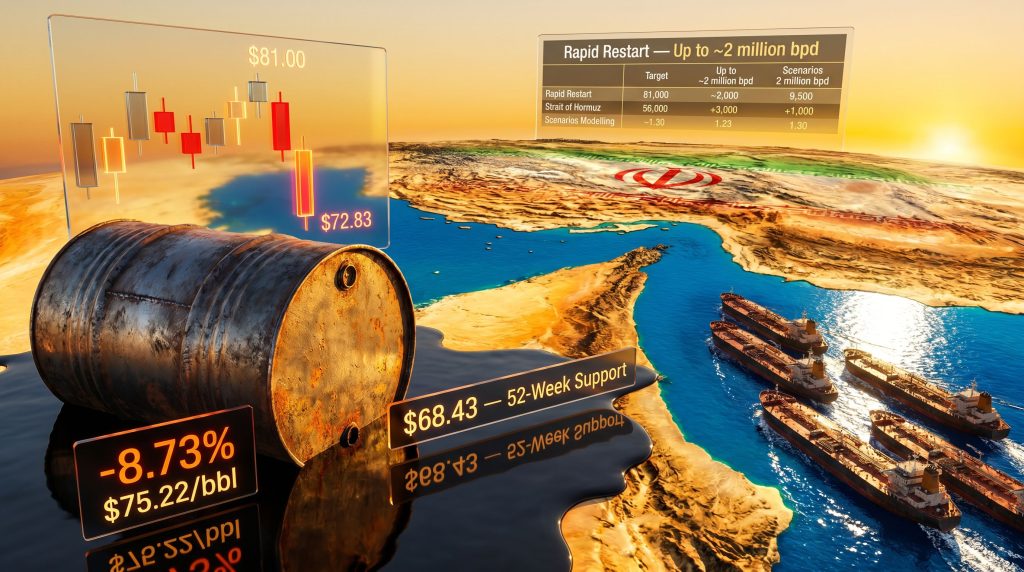
| Weekly High (August WTI Futures) | $81.00/bbl |
| Weekly Low (August WTI Futures) | $72.83/bbl |
| Weekly Settlement Price | $75.22/bbl |
| Weekly Price Change | -$7.22 (-8.73%) |
| 52-Week Moving Average (Long-Term Support) | $68.43/bbl |
| Key Retracement Resistance Zone | $86.47 to $89.68/bbl |
| Long-Term Range Floor | $55.40/bbl |
| Long-Term Range Ceiling | $100.10/bbl |
"A single-week move of nearly 9% in crude futures is rare outside of demand collapse events such as 2020. This selloff was entirely sentiment-driven. Physical market fundamentals remained structurally tight throughout the same period, creating a meaningful divergence between paper barrels and wet barrels."
What Is the U.S.-Iran Agreement and Why Does It Matter for Oil?
The Diplomatic Architecture Behind the Deal
The framework that triggered the selloff was an interim accord submitted to Congress on June 18, 2026. The agreement rests on three core pillars:
- Reopening of the Strait of Hormuz to commercial shipping, ending months of restricted transit for oil tankers and LNG carriers.
- Sanctions waiver provisions allowing Iran to resume oil exports within a defined framework and timeline.
- A pathway toward longer-term negotiations aimed at a more permanent settlement, though the current instrument is classified as a memorandum of understanding rather than a binding treaty.
That last distinction carries significant weight for market durability. A memorandum of understanding is a political commitment, not a legally enforceable obligation. Its practical effect depends entirely on the willingness of both parties to advance toward a binding settlement, which introduces a layer of uncertainty that futures prices may not be fully discounting. Furthermore, oil prices and trade war dynamics continue to complicate the broader pricing environment.
The Strait of Hormuz as a Global Oil Chokepoint
Context: The Strait of Hormuz is the world's most consequential maritime energy corridor. Approximately 20 to 21% of global petroleum liquids transit this narrow passage annually, making any disruption or restoration of flows through it disproportionately influential on global supply balances.
Reports at the time of the agreement's announcement indicated that more than 60 to 80 million barrels of crude were queued and ready to transit the strait as it reopened. The world's largest tanker operator publicly urged caution against a disorderly rush through the corridor, signalling that logistical complexity would persist even after the political framework was in place. Goldman Sachs warned separately that Hormuz traffic patterns may not fully normalise for an extended period, a view that adds an important caveat to the market's optimistic pricing.
Is This Deal Durable? Key Risk Factors to Watch
- The interim status of the accord versus the requirements for a permanent settlement creates ongoing uncertainty for supply forecasting.
- Congressional review in Washington introduces political risk, particularly given the sensitivity of Iran-related legislation.
- Iran's domestic political dynamics, including internal hardliner resistance to terms negotiated with the United States, represent a structural compliance risk.
- Historical precedent from prior sanctions relief cycles, most notably the trajectory of the 2015 Joint Comprehensive Plan of Action, demonstrates how quickly diplomatic progress can unravel.
How Much Iranian Oil Could Actually Return and How Fast?
Scenario Modelling: Three Return Trajectories
| Scenario | Timeline | Volume Estimate | Key Conditions Required |
|---|---|---|---|
| Rapid Restart | 0 to 60 days | Up to ~2 million bpd | Sanctions waiver activated, Hormuz fully open, China resumes purchases |
| Gradual Normalization | 2 to 6 months | 1.5 to 2.5 million bpd | Insurance, shipping, and refining infrastructure rebuilt |
| Stalled Recovery | 6 to 18 months | Below 1.5 million bpd | Negotiations break down or sanctions partially reimposed |
Why Iran Cannot Instantly Return to Peak Output
Iran's pre-conflict production ceiling was approximately 3.8 million barrels per day. Restoring capacity to anywhere near that level requires far more than a diplomatic agreement. Consider the following constraints:
- Infrastructure degradation during the conflict period demands significant capital expenditure before production can ramp.
- The 60-day window referenced in the interim agreement sets a benchmark for initial export resumption, not full capacity restoration.
- Upstream investment deficits accumulated during the sanctions era mean that even with full political clearance, the physical lag between sanctions relief and meaningful production recovery is measured in months to years.
- Insurance and shipping barriers persist even when political obstacles are removed, as international insurers and shipping companies require their own risk clearance processes before engaging with Iranian cargo.
The Role of China as Iran's Primary Buyer
During the sanctions era, China built a robust commercial infrastructure for absorbing Iranian crude at steep discounts, operating through intermediary traders and shadow fleet arrangements that circumvented Western financial systems. Chinese refiners, particularly independent teapot refineries, became the dominant buyers of Iranian barrels. However, OPEC's market influence on pricing dynamics means this bilateral flow does not exist in isolation from broader cartel strategy.
Whether other Asian importers re-engage is less certain. India, which saw its energy import bill surge by 82% due to elevated crude prices during the conflict, has nonetheless signalled that it is not rushing back to Middle Eastern supply despite the Hormuz reopening. India's state-owned oil company ONGC is actively considering resuming Venezuelan oil operations as part of a deliberate long-term supply diversification strategy, a signal that the crisis has permanently altered import preferences for at least some major consuming nations.
What Does the IEA's Demand Downgrade Tell Us About the Broader Market?
Demand Destruction as a Legacy of the Conflict Period
The International Energy Agency revised its 2026 oil demand outlook downward during the week, citing consumption suppression caused by elevated fuel prices across key importing economies during the conflict. This is a feedback loop that markets often underappreciate: sustained high energy costs do not merely reduce discretionary fuel consumption; they ripple through broader economic activity, reducing industrial output, freight volumes, and petrochemical demand simultaneously.
One underappreciated downstream effect is the acceleration of structural demand shifts. High oil prices during the conflict demonstrably accelerated electric vehicle adoption across European markets, a transition that, once made, does not reverse when prices fall. The ECB has noted explicitly that the Iran peace deal will not immediately reverse Europe's energy price shock, and TotalEnergies has cautioned that a key Saudi refinery will not fully recover until 2027, compressing European refining margins for the foreseeable future.
The IEA's 2027 Surplus Forecast: A Structural Shift in the Making
Forward-Looking Note: The IEA has projected a substantial oil surplus emerging by 2027 if Middle East supply continues to normalise. This represents one of the most significant potential structural shifts in global oil balances since the 2020 demand collapse. All forward-looking projections carry inherent uncertainty and should not be interpreted as investment advice.
The divergence between near-term inventory tightness and medium-term surplus expectations creates a fundamentally contested pricing environment. Furthermore, OPEC demand forecasts point in the opposite direction, emphasising the need for sustained upstream investment to meet future consumption. The tension between these two institutional outlooks will likely define crude market sentiment well into 2027.
Why Physical Markets Are Telling a Different Story Than Futures Prices
U.S. Inventory Data: The Bullish Counterweight
| Inventory Metric | Observation |
|---|---|
| U.S. Crude Stockpile Trend | Declined for 9 consecutive weeks, losing approximately 52 million barrels |
| Cushing, Oklahoma Hub | Continued drawdown, signalling tight physical supply |
| Refinery Demand Signal | Elevated heading into summer driving season |
The concept of paper barrels versus wet barrels captures a recurring tension in crude markets. Futures prices reflect trader expectations about future supply and demand, while physical inventory data reflects what is actually happening in real storage right now. During sentiment-driven selloffs, futures can disconnect sharply from physical reality. The 9-week consecutive draw in U.S. crude inventories, totalling approximately 52 million barrels, represents a substantial physical tightening that the futures market largely dismissed during the diplomatic euphoria of mid-June.
The Inventory Paradox: Tight Today, Surplus Tomorrow?
The forward curve structure, specifically the relationship between spot prices and deferred futures contracts, encodes market expectations about this paradox. A market in backwardation, where near-term prices exceed future prices, signals current tightness. A shift toward contango, where future prices exceed spot, would signal anticipated oversupply. Watching the term structure shift in WTI futures over coming weeks will provide arguably more reliable signals about market direction than any single price level.
The pace of Iranian supply restoration is the critical variable. A gradual normalisation stretching over six or more months gives the market time to absorb incremental volumes without tipping into surplus. A rapid restart closer to 2 million barrels per day within 60 days would compress that adjustment window considerably.
The next major ASX story will hit our subscribers first
How Are Global Oil Trade Flows Being Restructured?
Winners and Losers in the Post-Conflict Supply Reshuffle
- Middle East producers are seeing Murban and Dubai crude prices fall, opening arbitrage opportunities for U.S. and European buyers who had previously turned to alternative supply sources during the conflict.
- Alternative suppliers including U.S. shale producers and West African exporters, who gained market share during the conflict at elevated prices, now face renewed competition as Gulf volumes return.
- Tanker markets remain disrupted. High tanker rates are continuing to disrupt Persian Gulf oil shipments to Asia even as Hormuz reopens physically, with logistical friction expected to persist for weeks or months.
- Qatar LNG is preparing for a rapid restart of LNG exports as the corridor reopens, with volumes potentially recovering within weeks of full operational clearance.
- Poland has moved to tax fuel windfall profits earned during the Iran war period, reflecting broader political pressure across Europe to recapture economic rents generated by the supply crisis.
India's Strategic Recalibration: A Case Study in Supply Diversification
India's response to the crisis illustrates how a sustained supply shock can permanently alter the strategic calculus of a major importing nation. Following an 82% surge in its energy import bill, India has ordered a major expansion of its strategic petroleum reserves. In addition, it is deliberately declining to rush back to Middle Eastern crude despite the Hormuz reopening, and ONGC is actively exploring Venezuelan operations as an alternative sourcing option.
This is not short-term price optimisation; it is long-term supply architecture revision. For OPEC members who depend on Asian demand growth as the justification for maintaining high production targets, India's recalibration represents a meaningful strategic complication. Consequently, oil market trade impacts will continue to reverberate well beyond the diplomatic settlement itself.
Technical Outlook: What Do the Charts Say About Where WTI Is Headed?
Reading the Weekly WTI Structure
The main trend shifted to downward when sellers broke below the $75.45 swing level during the week of June 9 to 19, placing the market firmly in sell-the-rally mode. The broader long-term trading range runs from $55.40 at the floor to $100.10 at the ceiling. Within that range, the market is currently sitting inside the 50% to 61.8% Fibonacci retracement zone between $77.75 and $72.48, a historically significant value area that has the potential to attract aggressive counter-trend buyers.
The 52-week moving average at $68.43 represents major long-term support. Its significance is dual-natured: it may act as a floor that attracts institutional buying, or, if breached without a sustained defence, it could function as an acceleration trigger to the downside.
The Two-Scenario Framework for the Week of June 23 to 26, 2026
Bullish Scenario:
- A sustained hold above $77.75 signals counter-trend buyers entering the market with conviction.
- Potential momentum rally toward the retracement resistance zone at $86.47 to $89.68.
- Sellers are expected to re-engage at the upper end of this zone given the prevailing downtrend.
Bearish Scenario:
- Failure to hold $77.75 maintains downward pressure and keeps the trend intact.
- Next downside target: $72.48.
- A break below $72.48 opens the path toward the 52-week moving average at $68.43.
- Failure at $68.43 signals a potential acceleration lower with limited technical support until the $55.40 long-term range floor.
"Trader Note: The $77.75 level functions as the week's primary decision point. The market's reaction to this level will likely define directional bias for the near term. This analysis is for informational purposes only and does not constitute financial or investment advice."
What Are the Broader Macro Implications of Iranian Oil Re-entering Global Markets?
OPEC+ Strategy Under Pressure
The return of Iranian oil at any meaningful scale complicates OPEC+'s production management calculus in ways that extend beyond simple volume arithmetic. Iran has historically resisted subordinating its export ambitions to cartel discipline, particularly following periods of sanctions-enforced suppression. With domestic political and economic pressures pushing Tehran to maximise export revenue, the tension between Iran's individual incentives and OPEC+'s collective price defence objectives is likely to intensify.
Analysis from Argus suggests the deal will not produce a one-directional collapse in oil prices, a view consistent with the complexity of the supply restoration process and the multiple logistical, financial, and political barriers that remain in place. This is an important counterweight to the simplistic bearish narrative that dominated futures markets during the week of June 9 to 19. For further background on how crude oil flows signal Iran's fast return to export markets, independent analysis from Investing.com provides useful supplementary data on tanker movements and export volumes.
The Geopolitical Premium Reset: Is $75 the New Normal?
Disentangling how much of the pre-deal price level reflected pure conflict risk premium versus genuine structural supply tightness is analytically challenging. What is clearer is that a sustained return of Iranian exports at volumes approaching 2 million barrels per day would compress the medium-term price floor significantly below levels that prevailed during the conflict. Whether that compression stabilises around current levels or continues toward the $68 to $72 range depends heavily on physical delivery timelines and OPEC+'s response.
Energy Security Strategies Are Being Permanently Altered
Perhaps the least discussed but most durable consequence of the crisis is the acceleration of strategic reserve expansion programmes across multiple importing nations. India's announcement of a major reserve build is one data point in a broader pattern. Germany is considering extending oil reserve relief measures. The crisis has demonstrated the vulnerability of single-corridor dependency in a way that will shape infrastructure investment decisions for a decade.
For U.S. shale producers, who benefited from elevated prices during the conflict, the return of Iranian supply represents a genuine medium-term revenue headwind. For diversified energy investors, the episode reinforces the value of exposure to geographically distributed supply assets rather than concentrated Middle Eastern production. The World Bank has also examined who benefits and who loses from Iran's return to the oil market, providing a broader macroeconomic perspective on the supply shift.
Frequently Asked Questions: Return of Iranian Oil
How much oil could Iran export after the deal?
Early-stage estimates suggest Iranian exports could approach 2 million barrels per day within approximately 60 days of sanctions relief activation. Full recovery toward Iran's historical peak of approximately 3.8 million bpd would require significantly more time and upstream investment, making near-term volume projections inherently uncertain.
Will Iranian oil immediately push crude prices lower?
Not necessarily. While the market has already priced in a significant portion of the anticipated supply recovery through the approximately 9% weekly decline, physical delivery timelines, infrastructure restoration, and shipping logistics mean the actual volume impact will be gradual rather than immediate.
Who will buy Iranian crude first?
China is widely expected to be the primary initial buyer, given its established commercial infrastructure for handling Iranian barrels. India has signalled it is not rushing to re-engage with Middle Eastern supply despite the Hormuz reopening, representing a meaningful shift from historical patterns.
Is the U.S.-Iran deal permanent?
The current framework is an interim accord classified as a memorandum of understanding rather than a final settlement. Durability depends on the successful progression of longer-term negotiations, which remain subject to significant political risk on both sides.
What happens to oil prices if the deal collapses?
A breakdown in negotiations would likely trigger a rapid rebuilding of geopolitical risk premium. Given that the market has already unwound a substantial portion of the conflict premium, a deal failure could push WTI back toward the $86 to $90 resistance zone identified by technical analysts.
A Market at a Crossroads Between Sentiment and Fundamentals
The Three Forces That Will Determine Where Oil Goes From Here
- The pace of Iranian export restoration — whether normalisation is gradual over months or accelerates toward a rapid volume surge within weeks.
- Physical inventory trajectory — whether the 9-week U.S. drawdown trend continues or begins to reverse as Gulf supply enters storage systems.
- Geopolitical deal durability — whether the interim accord progresses toward a binding long-term settlement or encounters the political obstacles that have derailed prior frameworks.
The Central Tension Traders Must Navigate
Near-term physical markets remain structurally tight despite the dramatic price collapse. The medium-term supply outlook is shifting toward surplus as Gulf exports normalise. And the market is currently pricing the optimistic scenario in full, leaving it highly exposed to any diplomatic setback.
"The crude oil market is not simply reacting to a peace deal. It is undergoing a fundamental repricing of geopolitical risk. Whether that repricing proves accurate depends entirely on whether the diplomatic architecture holds, how quickly Iranian barrels physically reach global markets, and whether OPEC+ adjusts its own production posture in response. All market analysis and forward-looking projections in this article are for informational purposes only and do not constitute investment advice."
Readers seeking additional context on global crude oil market dynamics, Iranian sanctions history, and energy trade flow analysis can explore related coverage and data tools available at OilPrice.com, which provides ongoing tracking of global crude benchmarks, geopolitical developments, and energy market intelligence.
Want to Stay Ahead of the Next Major Commodity Market Shift?
Discovery Alert's proprietary Discovery IQ model scans ASX announcements in real time, translating complex mineral discovery data across more than 30 commodities into clear, actionable insights — the same kind of structural market intelligence that separates informed investors from the crowd. Explore Discovery Alert's discoveries page to see how historic ASX mineral discoveries have generated substantial returns, and begin a 14-day free trial to position yourself ahead of the next significant market opportunity.