July 28, 2026
The Refining Industry at a Crossroads: Six Regions, Six Stories, One Fragile Equilibrium
Alumina refining sits at the precise intersection of geology, energy economics, and logistics infrastructure. It is an industry where a single weather event in Queensland, a bauxite export decision in Conakry, or a gas price spike in Rotterdam can cascade through global supply chains within weeks. Understanding how these forces interact across geographically dispersed production centres is essential for anyone seeking to interpret production data beyond its surface-level appearance.
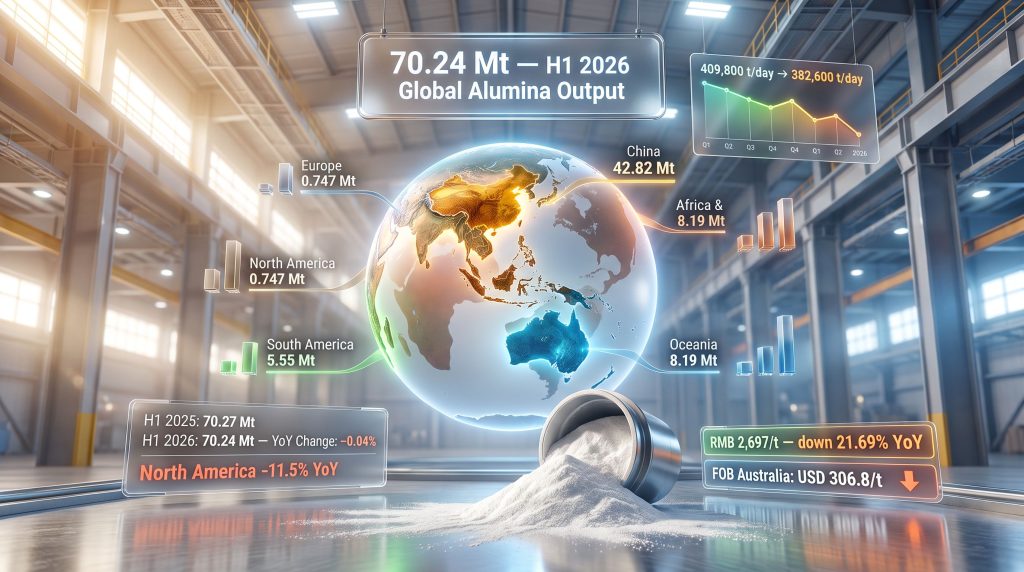
Global alumina production in H1 2026 provides exactly this kind of interpretive challenge. The aggregate number, 70.24 million tonnes, looks almost identical to the 70.27 million tonnes recorded in H1 2025. A difference of roughly 30,000 tonnes across a six-month global output figure is statistically negligible. Yet beneath that apparent stillness, six producing regions experienced sharply different operational realities driven by feedstock availability, energy cost structures, refinery capacity decisions, and commodity price pressure across seaborne markets.
When big ASX news breaks, our subscribers know first
Understanding the Quarterly Deterioration Beneath Annual Stability
Year-on-year comparisons can be misleading when sequential quarterly trends tell a more revealing story. Across the full review period, global alumina output followed a consistent downward trajectory on a quarter-by-quarter basis.
| Metric | Q4 2025 | Q1 2026 | Q2 2026 |
|---|---|---|---|
| Global Output (Mt) | 37.70 | 35.33 | 34.93 |
| Daily Average (t/day) | 409,800 | 393,700 | 382,600 |
| Quarter-on-Quarter Change | — | –6.1% | –1.7% |
- The Q4 2025 to Q1 2026 contraction of approximately 6.1% was the sharpest single-quarter decline across the entire review period
- Q2 2026 extended the sequential decline at a more moderate pace of –1.7%, suggesting some stabilisation in operating decisions
- Daily average production fell by approximately 27,200 tonnes per day between Q4 2025 and Q2 2026, a figure that points to deliberate output management rather than simple calendar effects
The industry term for this kind of behaviour is margin-led curtailment: producers reduce operating rates not because they lack physical capacity, but because operating at full rates would generate losses in a price-compressed environment. This dynamic is distinct from forced shutdowns and carries different implications for how quickly production can recover when market conditions improve. Furthermore, commodity market volatility has amplified these commodity market volatility decision-making cycles considerably across all producing regions.
Six-Region Output Comparison: H1 2025 vs H1 2026
| Region | H1 2025 (Mt) | H1 2026 (Mt) | YoY Change |
|---|---|---|---|
| China | 42.42 | 42.82 | +1.0% |
| Oceania | 8.47 | 8.19 | –3.2% |
| Africa & Asia ex-China | 6.99 | 6.93 | –0.9% |
| South America | 5.50 | 5.55 | +0.9% |
| Europe (incl. Russia) | 2.90 | 2.85 | –1.8% |
| North America | 0.844 | 0.747 | –11.5% |
Only two regions recorded year-on-year growth in global alumina production in H1 2026: China (+1.0%) and South America (+0.9%). Every other producing region contracted, with North America recording the steepest decline at –11.5%.
How China's Alumina Sector Managed Overcapacity and Margin Compression
China accounted for approximately 61% of total global H1 2026 alumina output, producing an estimated 42.82 million tonnes. On the surface, a 1.0% year-on-year increase appears healthy. The quarterly breakdown tells a more complex operational story.
| Quarter | China Output (Mt) | QoQ Change |
|---|---|---|
| Q4 2025 | 23.0 | — |
| Q1 2026 | 21.3 | –7.5% |
| Q2 2026 | 21.4 | +0.3% |
What Drove the Sharp Q1 Contraction in Chinese Refinery Output?
Several operational factors converged to reduce Chinese alumina throughput during Q1 2026. However, understanding China's industrial demand trends provides essential context for interpreting why these contractions unfolded as they did:
- Scheduled maintenance cycles across northern Chinese refineries reduced Q1 throughput across multiple sites simultaneously
- Environmental compliance shutdowns at a facility in Henan province removed additional production temporarily
- Concurrent maintenance at capacity expansion projects in Guangxi and Guizhou amplified the Q1 volume reduction beyond what any single factor could explain alone
- A rapid national build-out of refining capacity created a domestic supply surplus, applying downward pressure on spot prices even before seasonal demand weakness emerged
The pricing consequences were significant. Domestic spot alumina prices declined approximately 17% quarter-on-quarter during Q1 2026. A brief procurement uptick from Chinese smelters in March provided temporary price support, but this proved short-lived. By April and May, the margin environment had deteriorated sufficiently that numerous refiners chose to extend maintenance windows or reduce operating rates rather than sell into an oversupplied domestic market.
The H1 2026 average domestic spot alumina price in China settled at RMB 2,697 per tonne, representing a year-on-year decline of 21.69%. This is a striking figure that illustrates just how dramatically refinery economics shifted over a twelve-month period. For context, a refinery operating at full capacity into a market where its primary product has lost more than one-fifth of its value faces not just margin compression but genuine questions about the viability of incremental production. Such commodity price pressure has profound consequences for refinery investment planning across the sector.
The Chinese alumina sector's H1 2026 behaviour reflects a structural shift in refinery strategy. Rather than chasing volume, producers increasingly prioritised margin protection, a dynamic likely to define operating patterns through 2026 and into 2027 as new refining capacity continues to enter the market.
Africa and Asia (Ex-China): When Feedstock and Pricing Pressure Collide
The Africa and Asia (ex-China) grouping produced 6.93 million tonnes of alumina in H1 2026, down from 6.99 million tonnes in H1 2025. A 0.9% annual decline sounds modest, but the quarterly breakdown reveals a far more dramatic deterioration.
| Quarter | Output (Mt) | QoQ Change |
|---|---|---|
| Q4 2025 | 3.80 | — |
| Q1 2026 | 3.70 | –2.6% |
| Q2 2026 | 3.10 | –16.2% |
A 16.2% single-quarter decline represents one of the most significant regional contractions recorded across the entire global alumina industry in the review period. Three distinct factors drove this deterioration:
1. Guinean Bauxite Supply Tightening
Guinea holds the distinction of being the world's largest bauxite exporter and functions as a critical upstream feedstock supplier to refineries across Africa and parts of Asia. Beginning in June 2026, Guinea began restricting bauxite export volumes. For refineries with limited alternative feedstock sources, this created immediate raw material gaps that could not be quickly bridged through spot procurement. Shifts in global bauxite supply from Guinea consequently reverberated through multiple refining regions simultaneously.
2. Logistics Disruptions From Middle East Conflict
Shipping route diversions associated with the Middle East conflict redirected more than 1 million tonnes of Guinean bauxite that had been originally scheduled for regional refineries toward Indian ports instead. This logistical displacement created feedstock timing mismatches that cascaded through refinery schedules across the region.
3. Seaborne Alumina Benchmark Price Decline
The international FOB Australia alumina benchmark, the primary pricing reference for seaborne alumina trade globally, declined from approximately USD 321 per tonne in October 2025 to around USD 306.8 per tonne by end-Q1 2026. Lower benchmark prices reduced the economic incentive to operate at full capacity even for refineries with adequate feedstock supply.
This combination of supply-side disruption and demand-side pricing pressure is particularly damaging because neither force can offset the other. Feedstock shortages constrain physical production capacity, while low prices reduce the financial incentive to source expensive spot bauxite as a substitute. The result is a compounding contraction.
North America: The Structural Risk of Single-Refinery Dependency
North America recorded the largest year-on-year percentage decline of any producing region in H1 2026, with output contracting from 844,000 tonnes to 747,000 tonnes, a fall of 11.5%. In addition, the broader trade impacts on bulk commodities have compounded the structural challenges facing North American producers.
| Quarter | Output (000t) | QoQ Change |
|---|---|---|
| Q4 2025 | 387 | — |
| Q1 2026 | 388 | +0.3% |
| Q2 2026 | 359 | –7.5% |
The United States currently operates a single active alumina refinery: Atlantic Alumina's (Atalco) Gramercy facility located in Louisiana. The plant is producing at approximately one-third of its nameplate capacity, with annualised output estimated between 500,000 and 600,000 tonnes. Operational optimisation measures, including adjustments to bauxite blending ratios, moderated throughput further during the review period.
North America's near-total dependence on a single refinery operating well below capacity represents one of the most pronounced structural vulnerabilities in the global alumina supply chain. Any unplanned outage at Gramercy would immediately amplify North American import dependency, placing additional pressure on seaborne supply routes already navigating logistical disruptions elsewhere.
From an investment and supply chain security perspective, the North American situation raises questions that extend well beyond quarterly production figures. The absence of refining redundancy means that the region's aluminium smelters depend heavily on imported alumina, creating exposure to seaborne pricing benchmarks and logistics disruptions that domestic producers in other regions do not face. Consequently, this structural vulnerability is attracting increasing scrutiny from policymakers and industry analysts alike.
The next major ASX story will hit our subscribers first
South America: Why Infrastructure Investment Cycles Create Durable Competitive Advantages
South America was one of only two regions globally to record year-on-year production growth in H1 2026, with output rising from 5.50 million tonnes to 5.55 million tonnes, a gain of 0.9%.
| Quarter | Output (Mt) | QoQ Change |
|---|---|---|
| Q4 2025 | 2.84 | — |
| Q1 2026 | 2.80 | –1.4% |
| Q2 2026 | 2.70 | –3.6% |
The anchor of South American output is Hydro's Alunorte refinery in Brazil, which holds the distinction of being the world's largest alumina refinery by annual capacity at 6.3 million tonnes. Infrastructure upgrades completed in 2024, including the commissioning of bauxite slurry pipeline systems connecting upstream mining operations to the refinery, enabled higher sustained annual throughput and reduced operational costs per tonne. According to the International Aluminium Institute's production statistics, South American capacity utilisation has consistently outperformed global averages over the past two years.
The sequential quarterly decline in Q2 2026 was not driven by operational underperformance. Hydro reported improved productivity metrics during the period. Rather, the volume easing reflected a deliberate response to market conditions: the Platts alumina index traded in a range of approximately USD 303 to USD 330 per tonne during Q2 2026, while the ex-China seaborne alumina market remained oversupplied despite production curtailments at certain Indonesian and Australian refineries. In this environment, margin preservation guided output decisions.
The South American story illustrates a principle that is often underappreciated in commodity market analysis: capital investment cycles made years in advance can insulate producers from market headwinds that force less-prepared competitors to curtail production. The bauxite slurry pipeline infrastructure at Alunorte is not a response to 2026 market conditions; it is the product of planning decisions made several years earlier that happen to provide competitive resilience precisely when it is most needed.
Europe: Energy Cost Divergence and the Long-Term Competitiveness Question
Europe, including Russia, produced 2.85 million tonnes of alumina in H1 2026, down from 2.90 million tonnes in H1 2025, a decline of 1.8%.
| Quarter | Output (Mt) | QoQ Change |
|---|---|---|
| Q4 2025 | 1.45 | — |
| Q1 2026 | 1.38 | –4.8% |
| Q2 2026 | 1.46 | +5.8% |
The Quantified Energy Cost Disadvantage Facing European Refiners
| Region | Avg. Wholesale Electricity Cost (2025) | Relative Position |
|---|---|---|
| European Union | ~USD 95/MWh | Highest among major producers |
| United States | ~USD 45–50/MWh | ~50% below EU |
| China | ~USD 60–65/MWh | ~35% below EU |
European natural gas prices averaged approximately EUR 40–45 per MWh in H1 2026, compared with roughly EUR 34–36 per MWh in H1 2025, representing a year-on-year increase of approximately 18–25%. This energy cost escalation compounds a structural disadvantage that has been building for several years, accelerating the exit of marginal European refining capacity.
Operations including Aldel in the Netherlands and Speira's Rheinwerk facility in Germany had already curtailed or suspended production in prior periods. Hydro's European operations also contended with reduced hydropower generation during Q1 2026 due to scheduled maintenance at its power generation assets, adding an additional layer of input cost pressure.
The approximately 2:1 electricity cost ratio between European producers and their US counterparts is not a temporary aberration driven by the post-2022 energy shock alone. It reflects structural differences in energy market design, fuel mix, and industrial electricity tariff frameworks that are unlikely to be resolved quickly. European refineries that survived the 2022 energy crisis now face a prolonged period of operating at cost levels that make them globally uncompetitive relative to producers in lower-cost jurisdictions.
Oceania: Distinguishing Permanent Capacity Loss From Temporary Disruption
Oceania retained its position as the world's second-largest alumina-producing region in H1 2026, though output declined from 8.47 million tonnes to 8.19 million tonnes, a decrease of 3.2% year-on-year.
| Quarter | Output (Mt) | QoQ Change |
|---|---|---|
| Q4 2025 | 4.40 | — |
| Q1 2026 | 4.10 | –6.8% |
| Q2 2026 | 4.00 | –2.4% |
Understanding Oceania's H1 2026 performance requires separating two fundamentally different types of production reduction:
Permanent Capacity Removal:
The closure of Alcoa's Kwinana refinery in Western Australia removed a fixed volume of refining capacity from the regional production base on a structural basis. Unlike curtailments driven by margin pressure, this capacity is not available for restart when market conditions improve. The Kwinana closure will continue to exert downward pressure on Oceanian output in subsequent periods regardless of alumina pricing or bauxite availability. Alcoa's Q1 2026 results provide further detail on how this closure has affected overall group production metrics.
Temporary Weather-Related Disruption:
Heavy rainfall events at Weipa bauxite mining operations and the impact of Tropical Cyclone Narelle disrupted feedstock supply to Pacific-facing refineries during Q1 2026. Importantly, daily alumina production rates remained broadly stable at approximately 5,200 tonnes per day across both Q4 2025 and Q1 2026. The lower quarterly volume in Q1 reflected supply disruption and a shorter calendar quarter (90 days versus 92 days in Q4) rather than any deterioration in refinery operating efficiency. This distinction matters because it confirms that Oceanian refinery operators maintained their operational capabilities through the disruption period.
Five Macro-Level Forces Shaping Global Alumina Supply in 2026 and Beyond
The regional dynamics examined above are not isolated phenomena. They reflect five structural forces that will continue to shape global alumina production in H1 2026 and throughout the medium term:
1. Chinese Capacity Expansion Versus Margin Discipline
China's national refining capacity continues to grow, creating a persistent domestic oversupply condition. The critical variable for global markets is not China's production capability but the willingness of Chinese producers to operate at full rates when domestic spot prices are falling. A prolonged period of margin-led curtailment in China could paradoxically support seaborne alumina prices by limiting Chinese export availability.
2. Bauxite Supply Chain Concentration Risk Around Guinea
Guinea's growing influence over global bauxite flows represents an emerging supply chain vulnerability that has not yet received the analytical attention it warrants. As the world's largest bauxite exporter, Guinea's export policy decisions directly affect refinery feedstock availability across multiple continents simultaneously.
3. Seaborne Benchmark Pricing Weakness
The FOB Australia benchmark declining from USD 321/t to approximately USD 307/t over the review period reflects a broader softening in ex-China alumina demand. For producers reliant on seaborne trade, this benchmark compression directly determines whether operating at full capacity is economically rational.
4. Energy Cost Divergence Accelerating Geographic Refinery Shifts
The approximately 2:1 electricity cost differential between European and North American producers is accelerating a long-term shift in the global centre of gravity for alumina refining toward lower-cost jurisdictions, particularly in South America and Southeast Asia.
5. Infrastructure Investment Cycles as Competitive Moats
South America's relative outperformance in H1 2026 demonstrates that capital invested in upstream logistics infrastructure several years in advance can deliver meaningful competitive insulation during periods of market stress. This dynamic rewards long-horizon capital allocation and penalises producers who defer maintenance or infrastructure investment during earlier periods of margin pressure.
Frequently Asked Questions: Global Alumina Production in H1 2026
What was total global alumina production in H1 2026?
Global metallurgical-grade alumina production reached 70.24 million tonnes in H1 2026, representing a marginal year-on-year decline of 0.04% from 70.27 million tonnes in H1 2025. Full-year 2025 global output was approximately 144.1 million tonnes.
Which region produced the most alumina in H1 2026?
China was by far the largest producing region, contributing approximately 42.82 million tonnes, representing roughly 61% of total global output for the period.
Which region recorded the largest year-on-year production decline?
North America recorded the steepest year-on-year contraction at –11.5%, falling from 844,000 tonnes in H1 2025 to 747,000 tonnes in H1 2026. This decline was driven primarily by below-capacity operations at the sole active US alumina refinery, the Gramercy facility in Louisiana.
Why did Africa and Asia (ex-China) experience a sharp Q2 2026 decline?
The region's Q2 2026 output fell 16.2% quarter-on-quarter due to a convergence of three factors: Guinea restricting bauxite export volumes from June 2026, logistics disruptions redirecting over 1 million tonnes of bauxite away from regional refineries, and declining seaborne alumina benchmark prices compressing refinery margins below the threshold required to justify full-capacity operation.
What is the world's largest alumina refinery?
Hydro's Alunorte refinery in Barcarena, Brazil holds the title of the world's largest alumina refinery by annual capacity, with a nameplate capacity of 6.3 million tonnes per year. Infrastructure upgrades completed in 2024, including bauxite slurry pipeline systems, enhanced its production efficiency and sustained South America's position as one of the few growing regions in H1 2026.
Disclaimer: This article contains forward-looking analysis, production forecasts, and price trend assessments based on publicly available data and industry reporting as of July 2026. All figures should be independently verified before being used for investment or commercial decision-making purposes. Historical production data referenced herein is subject to revision. This article does not constitute financial advice.
Want to Stay Ahead of the Next Major Mineral Discovery on the ASX?
While global alumina supply chains navigate margin compression, feedstock disruptions, and structural capacity shifts, Discovery Alert's proprietary Discovery IQ model scans ASX announcements in real time, instantly identifying significant mineral discoveries across alumina, bauxite, and more than 30 other commodities. Explore how historic ASX mineral discoveries have generated substantial returns and begin your 14-day free trial today to position yourself ahead of the broader market.