July 28, 2026

When Price Compression Signals the Calm Before the Storm
Commodity markets have a rhythm that experienced traders learn to respect. Extended periods of range-bound price action are rarely signs of market disinterest. More often, they reflect a temporary equilibrium between competing forces — a coiling of energy that eventually releases into a sharp, directional move. The longer that compression holds, the more powerful the eventual resolution tends to be.
Crude oil technical analysis breakout levels are currently commanding serious attention from traders navigating both WTI and Brent. Both benchmarks are sandwiched inside well-defined technical boundaries, with buyers defending key floors while sellers consistently reject attempts to push prices higher. Neither side has achieved the sustained commitment needed to establish a new directional trend, and that indecision is itself meaningful information. For further context on how these dynamics are shaping the broader market, crude oil price trends throughout 2025 have reflected similarly compressed conditions.
Understanding what comes next requires more than watching a single price level. It demands a layered analysis across multiple timeframes, a clear map of the exact levels that matter, and the discipline to wait for confirmed closes rather than reacting to intraday noise.
Disclaimer: This article is for informational and educational purposes only. It does not constitute financial advice or a recommendation to buy or sell any financial instrument. Trading crude oil futures and related instruments involves significant risk of loss. Always conduct your own research and consult a licensed financial professional before making investment decisions.
When big ASX news breaks, our subscribers know first
The Structural Framework: How WTI's Daily Chart Defines the Playing Field
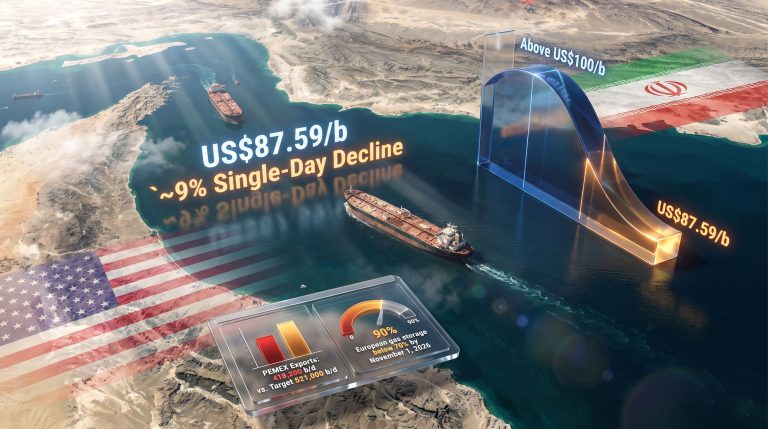
The daily chart for WTI crude oil reveals the broadest technical truth about where prices currently sit. Since establishing its most recent consolidation phase, WTI has been operating inside a broad range bounded by $88.66 on the downside and $102.70 on the upside. Every meaningful rally has stalled near the upper boundary, and every selloff has found buying interest near the lower end.
What makes the current moment particularly significant is that WTI recently attempted to break above the upper limit of this consolidation, reaching toward the ceiling before running out of buying momentum. That failed breakout attempt resolved with price sliding back into the range and testing the psychologically critical $100.00 level — a figure that carries weight far beyond its mathematical value. The oil volatility guide provides additional insight into how these compressed ranges typically resolve under volatile conditions.
The full architecture of meaningful price levels across the WTI structure is substantial:
| Price Level | Technical Role | Key Significance |
|---|---|---|
| $112.00 | Extended bullish target | April bearish gap upper boundary |
| $108.74–$112.95 | Major gap resistance | April 8 bearish gap cluster |
| $107.00 | Intermediate resistance | Prior price structure barrier |
| $104.94–$106.42 | Immediate overhead supply | May 5 bearish gap zone |
| $103.66 | Bearish pattern invalidation | Daily close above neutralises bearish engulfing |
| $102.70 | Upper range boundary | Consolidation ceiling |
| $100.00 | Psychological pivot | Short-term sentiment battleground |
| $98.48–$98.50 | Dynamic support confluence | 20-day MA and 100 SMA alignment |
| $96.20 | Intermediate support | Deeper pullback reference |
| $95.42–$97.85 | Critical support cluster | May 11 bullish gap / 50% Fibonacci |
| $88.66 | Lower range boundary | Structural consolidation floor |
The presence of layered gaps above current prices creates a stacked resistance structure that bulls must work through sequentially. These gaps are not arbitrary zones. Price gaps in futures markets represent sessions where supply and demand shifted so abruptly that no trading occurred between two price levels, leaving unresolved imbalances that markets historically revisit.
The 4-Hour Picture: Where Near-Term Momentum Is Deteriorating
The Rising Wedge Breakdown
While the daily chart provides the macro framework, the 4-hour timeframe is where short-term momentum reveals itself most clearly — and what it currently shows favours sellers over buyers.
The entire recovery rally from the beginning of May developed inside a rising wedge formation. This pattern is characterised by price making progressively higher highs and higher lows within two converging trendlines, with the key feature being that buying momentum weakens as the pattern matures. The wedge eventually broke downward, and crucially, that breakdown was subsequently verified — meaning price returned to test the broken lower boundary from below before continuing lower. This verification process filters out false breakdowns and confirms that the break was genuine rather than a noise-driven spike.
Bearish Candle and Failed Fibonacci Reclaim
Adding weight to the bearish near-term case, the failed breakout attempt at the range ceiling left behind a bearish engulfing candlestick pattern. This is a two-candle reversal signal where a bullish session is completely absorbed by a subsequent bearish session, indicating that sellers took full control. The pattern now reinforces resistance at the levels where it formed.
Compounding the bearish setup further, price briefly exceeded the 61.8% Fibonacci retracement of the prior decline before reversing sharply. A subsequent attempt to reclaim that level also failed, transforming what was previously a potential breakout zone into confirmed overhead resistance. In technical analysis, a failed breakout above a Fibonacci level carries more bearish significance than if price had never reached it in the first place, because it confirms that supply was sufficient to absorb all buying pressure at that mathematically derived threshold.
What the Momentum Oscillators Are Telling Traders
Oscillator readings across multiple indicators are currently aligned on the same side of the trade:
| Indicator | Current Signal | Interpretation |
|---|---|---|
| CCI (Commodity Channel Index) | Fresh sell signal | Bearish momentum building |
| Stochastics | Confirmed sell signal | Overbought conditions reversing |
| 20-Day Moving Average | ~$98.48 dynamic support | Medium-term bullish floor |
| 100 SMA | ~$98.50 confluence | Reinforces the ~$98.50 support zone |
| ADX | Elevated reading | A directional move is likely once range resolves |
The interesting tension here is between the short-term oscillators, which lean bearish, and the moving averages, which continue to provide a structural support floor near the $98.48–$98.50 zone. This divergence between oscillator signals and trend indicators is a hallmark of range-bound conditions, where oscillators are often more reliable guides than trend-following tools. For those seeking deeper technical context, WTI crude oil signals provide a useful external perspective on current breakout momentum.
Crude Oil Technical Analysis Breakout Levels: The Exact Triggers That Matter
The Bearish Pathway: Step-by-Step
Based on the current technical structure, the bearish scenario carries the greater weight of evidence in the near term. Furthermore, the trade war impact on oil has added an additional layer of macro uncertainty that supports cautious positioning. Here is how the bearish pathway unfolds:
-
Trigger level: daily close below $100.00. A confirmed close beneath the psychological floor removes a critical anchor and activates the downside target derived from the rising wedge pattern's measured move calculation.
-
Primary target: $95.42–$97.85 support cluster. This zone is not a single support level but a convergence of three separate technical factors: the May 11 bullish gap, the 50% Fibonacci retracement of the entire rally leg that began in early May, and the prior session low that previously halted a decline.
-
Historical precedent at the bullish gap. The bullish gap at $95.42–$97.85 previously arrested a selloff, establishing it as a zone where buying interest has demonstrably appeared before. This historical context raises the probability that buyers will re-emerge there if price revisits it.
-
Deeper breakdown level: $92.00. If the $95.42–$97.85 support cluster fails to hold, the next major reference point sits at $92.00. A daily close below this level would signal a structural breakdown with materially more bearish medium-term implications.
The Bullish Pathway: What Buyers Must Achieve
A credible bullish reversal in WTI requires navigating through a layered sequence of resistance zones. A single close above one level is not sufficient. The bull case demands sustained acceptance above each threshold in turn:
-
$103.66: First threshold. A daily close above this level would neutralise the bearish engulfing pattern that formed at the range ceiling, signalling that buyers have absorbed the selling pressure that created it.
-
$104.94–$106.42: Gap closure. Closing the May 5 bearish gap means that buyers have resolved the overhead supply imbalance, making a genuine trend reversal narrative technically defensible.
-
$107.00: Intermediate confirmation. A sustained hold above $107.00 would shift the medium-term bias decisively bullish and attract momentum-driven buying.
-
$108.74–$112.95: The structural ceiling. This large April 8 bearish gap zone halted the rally during the final sessions of April and represents the primary barrier separating current prices from a potential move toward $112.00 and beyond.
The market's current message is one of unresolved tension rather than clear direction. In these conditions, the traders who tend to perform best are those who resist the urge to force a narrative and instead allow price to reveal its own hand through confirmed closes at decisive levels.
Brent Crude: A More Complex Technical Architecture
Understanding the Nested Range Structure
Brent crude presents a technically more intricate picture than its WTI counterpart. Rather than a single consolidation range, Brent is operating within a nested structure — a broader outer consolidation containing a tighter inner range, with that inner range itself bracketed by two opposing price gaps pointing in opposite directions.
Outer consolidation: $96.75 (support) to $109.02 (resistance)
Inner short-term range: $104.23 (support) to $108.45 (resistance)
The opposing gap structure within the inner range creates a technical deadlock:
| Gap | Price Zone | Type | Current Function |
|---|---|---|---|
| May 6 bearish gap | $107.92–$109.87 | Bearish (unfilled) | Overhead resistance ceiling |
| May 11 bullish gap | $101.29–$104.00 | Bullish (open) | Downside support floor |
As long as both gaps remain open and neither is decisively closed by a daily close, sideways trading within this zone remains the most statistically likely outcome. The market is effectively in a standoff between two opposing supply and demand imbalances, neither of which has been resolved. OPEC's market influence remains a key variable that could trigger the resolution of precisely this kind of technical deadlock.
Brent's 4-Hour Dynamics Mirror WTI
The 4-hour chart for Brent tells a remarkably similar story to WTI. A rising wedge pattern broke down and that breakdown was subsequently verified during the European trading session, confirming genuine downside intent rather than a false break. The verification move led directly to a test of the nearest support zone — the lower boundary of the May 11 bullish gap.
The critical interpretive rule for Brent's current situation is that any rally back toward the broken wedge boundary should be treated as a retest of the breakdown, not a confirmed reversal. In nested range structures, premature entries based on inner range breaks rather than outer boundary closes carry substantially elevated false-breakout risk.
The Two Numbers That Resolve Brent's Stalemate
| Direction | Trigger | What It Unlocks |
|---|---|---|
| Bullish breakout | Daily close above $109.87 | Closes May 6 bearish gap; opens path toward $112+ |
| Bearish breakdown | Daily close below $101.29 | Closes bullish gap support; confirms deeper decline |
| Continued range | Price between $101.29–$109.87 | Technical stalemate persists |
The Hidden Significance of Open Price Gaps in Crude Oil Futures
Why Gaps Function as Supply and Demand Imbalance Markers
Price gaps in futures markets carry a level of structural significance that many traders underestimate. In crude oil, a gap occurs when the opening price of a new session differs substantially from the prior session's closing price, typically driven by overnight news, geopolitical developments, inventory data releases, or major changes in supply outlook. Because no trading occurred within the gap range, it represents an unresolved imbalance between buyers and sellers.
The tendency for markets to return and fill gaps over time reflects the mechanical reality that significant supply or demand at those unfilled price levels has never been tested. Until it is, the gap remains a reference point that can function as:
-
A magnetic target that price gravitates toward as the imbalance seeks resolution.
-
A support or resistance zone that absorbs price action and decelerates momentum.
-
A breakout confirmation tool where closing a gap signals that the prior imbalance has been fully absorbed.
Active Gaps Currently in Play for WTI
| Gap | Price Zone | Type | Current Role |
|---|---|---|---|
| April 8 bearish gap | $108.74–$112.95 | Bearish (unfilled) | Primary structural ceiling |
| May 5 bearish gap | $104.94–$106.42 | Bearish (unfilled) | Immediate overhead supply |
| May 11 bullish gap | $95.42–$97.85 | Bullish (open) | Key downside demand floor |
A particularly important nuance is that gaps formed on higher-volume sessions carry greater significance than those created during low-liquidity periods such as weekends or public holidays. Gaps formed on meaningful volume represent genuine institutional supply and demand at those price levels, making them more reliable as support and resistance zones. Consequently, for traders wanting live data alongside this analysis, real-time WTI futures quotes are a valuable reference point when monitoring these gap zones in real time.
The next major ASX story will hit our subscribers first
Scenario Map: WTI and Brent Side-by-Side
| Scenario | WTI Trigger | WTI Target | Brent Trigger | Brent Target |
|---|---|---|---|---|
| Strong Bullish | Close above $106.42 | $107.00 then $112.00 | Close above $109.87 | $112.00+ |
| Mild Bullish | Close above $103.66 | $104.94–$106.42 | Close above $107.92 | $109.87 |
| Neutral / Range | Between $100–$103.66 | Sideways chop | Between $101.29–$109.87 | Sideways chop |
| Mild Bearish | Close below $100.00 | $95.42–$97.85 | Close below $104.23 | $101.29 |
| Strong Bearish | Close below $96.20 | $92.00 | Close below $101.29 | Sub-$96.75 |
A Practical Framework for Trading Around These Levels
Step-by-Step Decision Protocol
Navigating a range-bound market in crude oil requires process discipline more than prediction. In addition, applying structured commodity volatility strategies can significantly improve decision-making when markets are compressed and directional signals are ambiguous. The following framework provides a structured approach:
Step 1: Match your approach to your timeframe.
-
Day traders should focus on 4-hour signals including wedge verification, oscillator alignment, and intraday gap tests.
-
Swing traders should prioritise confirmed daily closes above or below key thresholds ($100, $103.66, $109.87).
-
Position traders should monitor only the outer range boundaries: $88.66 and $102.70 for WTI; $96.75 and $109.02 for Brent.
Step 2: Require daily close confirmation before acting.
Intraday moves through key levels in range-bound environments are frequently reversed before the session ends. Waiting for a daily close filters the majority of false breakout signals and dramatically reduces costly whipsaw entries.
Step 3: Define your invalidation point before entering.
For any position taken on a breakout, identify in advance the specific level that would prove the trade wrong. For bearish positions taken on a break below $100.00, the invalidation level would be a daily close back above $103.66. Pre-defining this prevents emotional decision-making during adverse moves.
Step 4: Respect the range-bound reality.
While the near-term technical evidence leans bearish, the broader consolidation structure means that both outcomes remain possible until a confirmed close resolves the ambiguity. Sizing positions appropriately for this uncertainty — rather than for a high-conviction trending environment — is the most prudent approach.
Step 5: Treat the $95.42–$97.85 zone as a decision point, not a guaranteed reversal.
If price reaches this support cluster, its historical significance and Fibonacci alignment make it a logical area for buyers to re-emerge. However, a clean daily close below $95.42 would signal that the zone has failed and that substantially lower targets including $92.00 are in play.
Key Level Summary: Everything Traders Need to Watch
The crude oil technical analysis breakout levels currently in focus represent some of the most clearly defined and multi-factor-confirmed price zones seen in recent months. Whether the next major move proves bullish or bearish, the technical architecture is unusually well-defined.
WTI Crude Oil Priority Levels:
-
$103.66: First bullish hurdle (bearish pattern neutralisation)
-
$104.94–$106.42: Gap closure threshold (bull case strengthens materially)
-
$100.00: Immediate psychological battleground
-
$95.42–$97.85: Primary bearish target zone (gap, Fibonacci, prior low confluence)
-
$92.00: Structural breakdown trigger with major medium-term implications
Brent Crude Oil Priority Levels:
-
$109.87: Bullish breakout trigger (closes May 6 bearish gap)
-
$101.29: Bearish breakdown trigger (closes May 11 bullish gap)
-
$104.23–$108.45: Inner range boundaries (false breakout risk zone)
Traders have a rare opportunity to engage with clear invalidation criteria rather than navigating ambiguous market conditions. The discipline to wait for daily close confirmation at these crude oil technical analysis breakout levels is the single most important variable separating profitable navigation of this setup from reactive, premature commitment to a direction the market has not yet chosen.
Want to Stay Ahead of the Next Major Commodity Discovery?
While crude oil traders wait for confirmed breakouts at key technical levels, Discovery Alert's proprietary Discovery IQ model delivers real-time alerts on significant ASX mineral discoveries — instantly translating complex data across 30+ commodities into clear, actionable opportunities. Explore Discovery Alert's discoveries page to understand how historic mineral discoveries have generated substantial returns, and begin your 14-day free trial to position yourself ahead of the broader market.