July 23, 2026
When the World's Most Critical Energy Corridor Goes Dark
Every barrel of oil has a story, and for roughly one-fifth of all crude moving through global markets, that story runs through a narrow strip of water barely 21 nautical miles wide at its tightest point. The Strait of Hormuz is not simply a geographic feature — it is the circulatory valve of the world economy. Understanding what happens when that valve closes, even partially, requires thinking in phases, not headlines.
The events unfolding across global energy markets in mid-2026 are forcing that understanding on buyers, refiners, traders, and policymakers alike. A Strait of Hormuz oil supply disruption at this scale is not a theoretical exercise anymore. Indeed, oil price volatility of this magnitude has not been seen in modern energy market history.
When big ASX news breaks, our subscribers know first
The Strait of Hormuz: Why No Other Chokepoint Comes Close
What Makes Hormuz Structurally Irreplaceable?
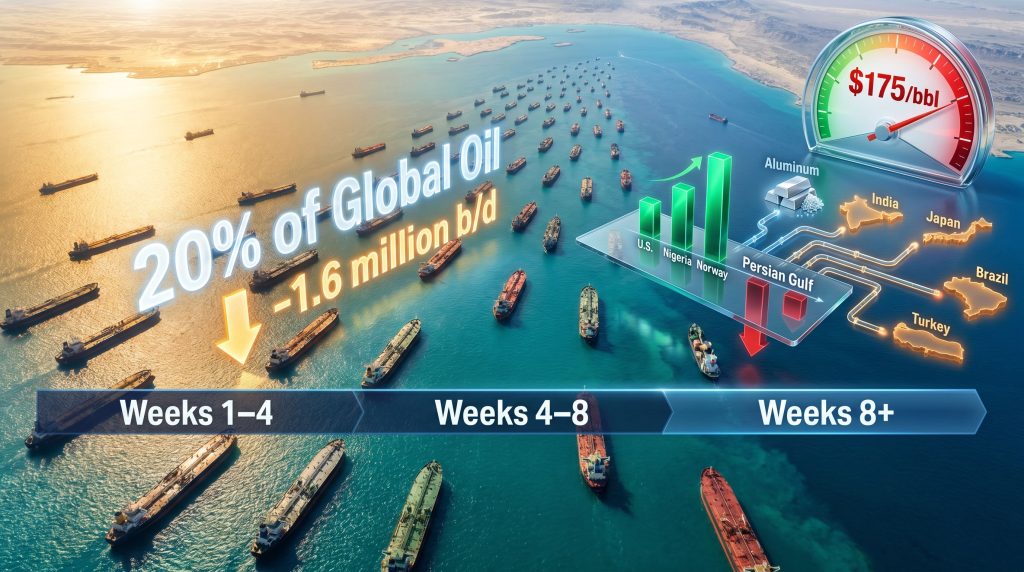
Most maritime chokepoints are significant. The Strait of Hormuz is categorically different. Approximately 20% of global oil consumption transits this corridor under normal operating conditions, along with a substantial share of worldwide liquefied natural gas trade — the latter carrying particular weight for energy-import-dependent economies across East and South Asia.
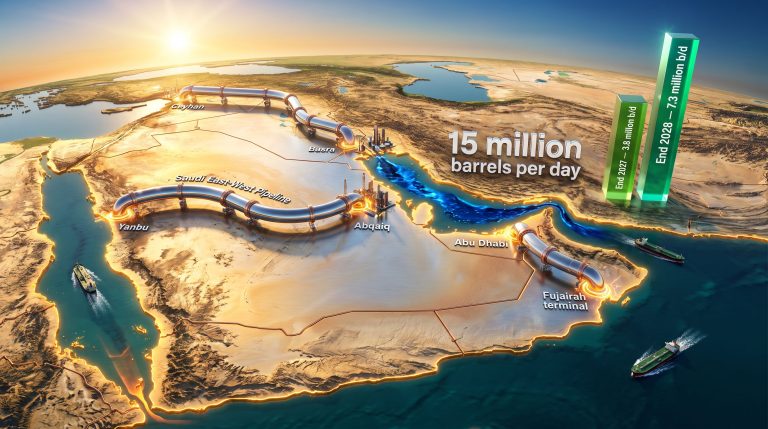
What makes Hormuz uniquely vulnerable is the absence of true substitutes. While other chokepoints like the Suez Canal or Bab al-Mandeb can be bypassed through longer routing, the Persian Gulf's landlocked geography means that most oil production from Saudi Arabia, Iraq, Kuwait, the UAE, Qatar, and Iran has no oceanic exit that does not ultimately depend on Hormuz access or specifically constructed overland pipeline systems with limited capacity.
Transit Volume Trends: What the Data Reveals
Even before the current disruption, Hormuz transit volumes had been declining. Between 2022 and 2024, crude oil and condensate flows through the strait fell by 1.6 million barrels per day (b/d), only partially offset by a 0.5 million b/d increase in petroleum product shipments during the same period.
| Flow Category | Volume Change (2022–2024) |
|---|---|
| Crude oil and condensate | −1.6 million b/d |
| Petroleum products | +0.5 million b/d |
| Net change | −1.1 million b/d |
This structural decline reflected three converging forces: OPEC+ production cuts initiated in November 2022, rerouting pressures stemming from Bab al-Mandeb instability, and expanded regional refining capacity absorbing more crude domestically before export. Furthermore, OPEC's market influence had already been shifting before the current crisis emerged. In other words, the world was already adapting to a slightly smaller Hormuz footprint — but a disruption of the magnitude now underway operates on a completely different scale.
How a Strait of Hormuz Oil Supply Disruption Actually Unfolds
Phase 1: The Deceptive Calm of the Buffer Period
The early weeks of a Hormuz disruption are typically misread by markets. Tankers that loaded and departed Persian Gulf terminals before the disruption continue sailing toward their destinations, delivering cargoes on schedule for several weeks after the strait effectively closes to new traffic. During this window, strategic and commercial reserves are activated to supplement any emerging shortfalls, and headline price spikes remain moderate relative to what the underlying supply shock will eventually demand.
This initial stability is not a signal that the disruption is manageable. It is a delay mechanism — and a deceptive one.
Phase 2: When Pre-Disruption Cargoes Run Out
The transition from Phase 1 to Phase 2 is the moment markets typically underestimate. Once pre-disruption tankers complete their voyages, the buffer they provided disappears. Commercial and strategic reserves, which have been drawn down continuously since the disruption began, are now carrying the entire weight of market stabilisation.
As ICIS oil, gas and NGL analyst Kojo Orgle noted in a May 2026 interview with World Oil, global inventories were being depleted at a rate the market had not previously encountered. Reserve drawdowns at this velocity cannot be maintained indefinitely — and their eventual exhaustion removes the primary mechanism that had been preventing far more severe price dislocations.
Phase 3: Physical Tightening Becomes Unavoidable
By the time a disruption reaches its eighth week and beyond, the dynamic shifts from financial market stress to genuine physical scarcity. Refineries dependent on Persian Gulf crude begin competing for available alternative barrels. Shipping rerouting costs escalate. Insurance premiums for vessels operating in or near conflict zones compound the effective cost of delivered crude for importers.
The Three-Phase Disruption Timeline:
-
Weeks 1–4: Pre-disruption tankers deliver normally; strategic reserves are activated; price volatility is elevated but contained
-
Weeks 4–8: Pre-war cargo supply is largely exhausted; commercial inventory drawdowns accelerate to historically unprecedented rates
-
Weeks 8+: Physical market tightness becomes visible across refinery supply chains; shipping costs surge; rerouting alternatives strain under demand
Orgle confirmed in May 2026 that markets were beginning to enter exactly this third phase, with physical tightness starting to emerge after the initial buffer period had been largely consumed (World Oil, May 14, 2026).
What Are the Real Price Implications of a Prolonged Hormuz Closure?
The $175 Per Barrel Scenario: Credible or Alarmist?
The figure that has circulated most prominently in energy analyst discussions is $175 per barrel as a ceiling scenario under sustained disruption conditions. This threshold deserves careful examination, because it is neither a prediction nor a fantasy — it represents a specific analytical construct tied to demand destruction dynamics. Consequently, understanding the full range of crude oil price trends is essential context for interpreting these projections.
At sustained prices approaching $175 per barrel, the self-correcting mechanism is not supply recovery — it is economic collapse in price-sensitive consuming economies. The cure becomes as damaging as the disease.
Kojo Orgle of ICIS framed this scenario explicitly in his May 2026 World Oil interview: reserve drawdowns have been the primary force preventing prices from reaching that level, but consumers are demonstrating reduced resilience to price surges. If price reaches those extreme levels, complete demand destruction becomes the forcing mechanism that drives prices back down — not through restored supply, but through collapsed consumption.
Why Demand Destruction Is Not a Clean Solution
The self-limiting nature of extreme oil prices is real but deeply asymmetric in its impacts. Developed economies with diversified energy mixes and financial buffers can absorb demand destruction through efficiency responses and fuel switching. Developing economies — particularly those where diesel powers agriculture and freight, and where energy costs represent a larger share of household income — face far more severe consequences.
When prices force demand destruction in these markets, the economic damage extends well beyond energy costs into food security, industrial output, and employment. The price eventually falls, but the underlying economic harm can persist for years.
The Strategic Reserve Depletion Risk
Perhaps the most underappreciated dimension of the current disruption is the pace at which buffer capacity is being consumed. Strategic petroleum reserves exist precisely for scenarios like this — but their capacity is finite, and their depletion rate during an extended Hormuz disruption is unprecedented in modern energy market history.
Once reserve capacity falls to critically low levels, the market loses its shock absorber. Any subsequent supply disruption, weather event, or logistics failure would face a market with no buffer remaining — a condition that structurally elevates volatility for an extended period beyond the original disruption itself.
Beyond Oil: How Hormuz Disruptions Cascade Through Global Supply Chains
The Commodities Most Exposed Beyond Crude
A Strait of Hormuz oil supply disruption is fundamentally misunderstood if it is analysed only through the lens of crude oil pricing. The Persian Gulf region is a concentrated source of inputs for industries far removed from energy production. However, the LNG supply outlook adds yet another layer of vulnerability for import-dependent economies.
| Commodity or Sector | Gulf Dependency Driver |
|---|---|
| Aluminum | Energy-intensive smelting operations concentrated in the Gulf |
| Plastics and petrochemicals | Natural gas feedstocks sourced from regional production |
| Nitrogen-based fertilizers | Gulf natural gas as the primary feedstock for ammonia production |
| Industrial construction materials | Regional manufacturing and processing concentration |
The fertiliser linkage deserves particular attention. Nitrogen fertilisers are produced from ammonia, which is synthesised from natural gas through the Haber-Bosch process. The Persian Gulf region hosts some of the world's largest ammonia and urea production facilities, supplied by abundant and low-cost natural gas. A disruption that halts or restricts natural gas flows or export logistics from the region does not merely raise energy costs — it tightens global food production inputs, with effects that play out across agricultural planting cycles that operate on six-to-twelve month lead times.
Which Economies Face the Greatest Exposure?
High-exposure developing economies:
-
India — significant crude import dependence on Persian Gulf producers, combined with fertiliser and petrochemical import exposure
-
Brazil — heavily reliant on Middle Eastern fertiliser inputs to sustain its agricultural export sector, including soybeans and sugarcane
-
Turkey — exposed across energy, industrial materials, and petrochemical supply chains simultaneously
Advanced economy risks:
-
Japan — historically among the most Hormuz-dependent major crude importers globally, with LNG supply chains adding further vulnerability
-
Select European nations — LNG supply disruption exposure and petrochemical feedstock dependency create compounding risks
Why Secondary Effects Outlast the Conflict
Manufacturing networks calibrated to Gulf-sourced inputs cannot instantly reconfigure when supply chains are interrupted. Procurement contracts, refinery crude slates, chemical plant feedstock specifications, and logistics infrastructure all carry inertia that extends disruption effects well beyond the point of physical supply restoration. Secondary inflationary pressures and oil market disruptions can prove more economically persistent than the initial energy price shock itself.
What Alternative Infrastructure Exists to Bypass Hormuz?
Pipeline Bypass Capacity: Real but Insufficient
Saudi Arabia and the UAE maintain overland pipeline infrastructure capable of routing crude to export terminals outside Persian Gulf jurisdiction. Combined spare bypass capacity across these systems is estimated at approximately 2.6 million b/d — a meaningful volume, but one that represents only a fraction of typical Hormuz throughput under normal operating conditions.
Critical limitations of bypass infrastructure:
-
Pipeline capacity covers a relatively small share of pre-disruption Hormuz transit volumes
-
Surge capacity is constrained by maintenance schedules, pumping station limitations, and loading terminal bottlenecks
-
Refined petroleum products and LNG have no equivalent pipeline bypass option — these flows are entirely dependent on maritime routing
-
Tanker repositioning and war-risk insurance normalisation add weeks to effective recovery timelines even after physical routes reopen
The bypass infrastructure provides a partial pressure valve — not a replacement. Buyers dependent on refined product imports or LNG from the Gulf have effectively no overland alternative. According to IEA analysis on Hormuz oil security, the strategic importance of the strait remains unmatched among the world's critical energy chokepoints.
The next major ASX story will hit our subscribers first
How Long Does Recovery Actually Take After Hormuz Reopens?
The 90-Day Recovery Window
One of the most consequential analytical points raised by ICIS analyst Kojo Orgle is that diplomatic resolution does not equal market normalisation. Even under a scenario where tensions ease and the Strait physically reopens relatively quickly, physical oil market tightness is projected to persist for at least three months or more beyond any resolution (World Oil, May 14, 2026).
A ceasefire announcement should not be interpreted as a signal that supply conditions have normalised. The mechanics of market recovery operate on a fundamentally different timeline than the mechanics of conflict resolution.
The Four-Stage Recovery Sequence:
-
Tanker repositioning — vessels that rerouted around the Cape of Good Hope or to alternative loading terminals require time to return to standard Persian Gulf transit lanes and loading schedules
-
Insurance market stabilisation — war-risk premiums embedded in shipping costs normalise gradually, not instantaneously, as underwriters reassess the risk environment
-
Producer output restoration — Gulf producers whose operations were disrupted during the conflict require time to restore production to pre-conflict levels, including well restart procedures and pipeline integrity checks
-
Refinery supply chain rebuilding — refiners must reestablish crude procurement contracts, reschedule tanker bookings, and rebuild safety stocks of feedstocks before operational stability returns
Each of these stages operates on its own timeline, and they do not run concurrently from day one of resolution. The compound effect is a recovery arc measured in quarters, not weeks.
Is OPEC+ Still Capable of Stabilising Oil Markets?
The Fracturing of Collective Discipline Under Geopolitical Pressure
For much of the post-2016 era, OPEC+ functioned as the market's ultimate backstop — a coalition capable of adjusting supply to moderate price extremes in either direction. That role is now under fundamental challenge. Kojo Orgle characterised the group's current predicament starkly in his May 2026 World Oil interview, noting that OPEC+ has lost substantial power as geopolitical tensions drive member states to prioritise individual national economic interests over collective production discipline.
The current disruption environment exposes a structural reality: OPEC+ cohesion was always contingent on member states sharing broadly aligned economic incentives. When geopolitical fault lines cut across the bloc — as they do during a conflict involving a member state — that alignment breaks down rapidly.
Key dynamics undermining OPEC+ effectiveness in the current environment:
-
Individual member states are increasingly making production decisions based on national revenue needs rather than collective quota commitments
-
Geopolitical divisions within the bloc create asymmetric incentives, with some members benefiting from higher prices and others prioritising market share retention
-
The group's conventional policy toolkit — adjusting production quotas through ministerial agreement — is not designed to address supply shocks caused by conflict involving member states
What OPEC+ Fragmentation Means for Structural Oil Price Volatility
If OPEC+ can no longer reliably function as a market stabiliser, the structural risk premium embedded in oil prices over the medium term may need to be revised upward. Markets that previously priced in OPEC+ as a reliable ceiling-and-floor mechanism may need to operate with wider volatility bands, affecting everything from corporate hedging strategies to consumer energy cost projections.
Which Producers Benefit From Persian Gulf Instability?
Atlantic Basin Producers: The Structural Winners
Prolonged Persian Gulf instability is accelerating a reassessment of crude sourcing strategy among major importers. Buyers in Asia, Europe, and elsewhere are actively evaluating how to reduce their structural dependence on Hormuz-transiting barrels — and the beneficiaries of that diversification are primarily Atlantic Basin producers. Furthermore, UNCTAD research on Hormuz disruption implications highlights that the consequences for global trade extend well beyond the energy sector alone.
| Supply Region | Hormuz Dependency | Disruption Beneficiary? |
|---|---|---|
| Persian Gulf (Saudi, UAE, Kuwait, Iraq) | High | No — directly affected |
| United States (Gulf Coast, Atlantic export terminals) | None | Yes — primary beneficiary |
| West Africa (Nigeria, Angola) | None | Yes — secondary beneficiary |
| Russia (Baltic and Pacific routes) | None | Partial — sanctions constraints limit market access |
| North Sea (Norway, UK) | None | Yes — European supply alternative |
U.S. shale producers are particularly well-positioned. American export infrastructure has expanded substantially over the past decade, with Gulf Coast terminals capable of loading VLCCs for Asian and European destinations through shipping lanes entirely unaffected by Persian Gulf conditions. For buyers seeking Hormuz-independent supply with established reliability, U.S. producers offer a credible alternative at scale.
Orgle noted in his World Oil interview that prolonged instability could accelerate a broader structural reorientation of global crude sourcing strategies, with the U.S. among the primary beneficiaries as buyers move to reduce their dependence on Hormuz-dependent barrels.
The Long-Term Sourcing Shift
What is emerging is not merely a short-term supply diversion — it is potentially a durable restructuring of buyer-seller relationships in global crude markets. Long-term supply agreements, infrastructure investments, and refinery reconfiguration decisions made during this period of disruption could lock in Atlantic Basin market share gains for years beyond the resolution of the immediate conflict.
This dynamic represents one of the least discussed but potentially most consequential long-term consequences of a sustained Strait of Hormuz oil supply disruption.
Frequently Asked Questions: Strait of Hormuz Oil Supply Disruption
How Much of the World's Oil Passes Through the Strait of Hormuz?
Under normal operating conditions, the Strait of Hormuz handles approximately 20% of global oil consumption, along with a significant portion of worldwide LNG trade. No other maritime chokepoint carries comparable volumes of energy commodities.
What Happens to Oil Prices If the Strait Closes?
Price impacts depend heavily on disruption duration and the depth of strategic reserve buffers available at the time. Short-term disruptions can be partially absorbed through coordinated reserve releases. Sustained closures lasting weeks to months carry the potential to push crude prices toward extreme levels, with $175 per barrel identified as a plausible upper-bound scenario under prolonged disruption conditions where demand destruction becomes the primary market-balancing mechanism.
How Long Would It Take Oil Markets to Recover After the Strait Reopens?
Even after physical reopening, energy market analysts project a recovery lag of at least 90 days before physical oil market tightness fully resolves. This accounts for tanker repositioning, insurance market normalisation, producer output restoration, and refinery supply chain rebuilding — processes that operate sequentially, not simultaneously.
What Commodities Beyond Oil Are Affected?
Disruptions extend to aluminium, petrochemicals, plastics, and nitrogen-based fertilisers — all dependent on Persian Gulf production or natural gas feedstocks. Secondary economic effects on agriculture, construction, and manufacturing can prove more persistent than the initial energy price shock, given the lead times embedded in agricultural procurement and industrial supply chain reconfiguration.
Which Countries Are Most Exposed?
Developing economies including India, Brazil, and Turkey face the greatest exposure due to dependence on Middle Eastern energy and commodity imports. Japan and select European nations carry significant vulnerability through LNG supply chains and petrochemical feedstock dependencies.
Key Takeaways
-
Physical tightness is actively emerging as pre-disruption cargo buffers are exhausted and inventory drawdowns reach historically unprecedented rates
-
The $175 per barrel scenario is analytically credible under sustained disruption, though demand destruction functions as a self-limiting ceiling that corrects prices through economic damage rather than supply recovery
-
Recovery takes months, not weeks — diplomatic resolution does not translate to immediate market normalisation given the sequential nature of tanker, insurance, production, and refinery supply chain recovery
-
OPEC+ cohesion is under structural strain, with individual member states increasingly prioritising national economic interests over collective production discipline, reducing the group's stabilising capacity
-
Atlantic Basin producers stand to benefit from a structural reorientation of global crude sourcing strategies as buyers seek Hormuz-independent supply
-
Supply chain effects extend far beyond crude oil — fertilisers, petrochemicals, aluminium, and industrial materials all carry meaningful disruption exposure with long recovery lead times
This article incorporates analysis from Kojo Orgle, oil, gas and NGL analyst at ICIS, as reported by World Oil on May 14, 2026. All figures, projections, and price scenarios referenced herein reflect analyst assessments at the time of publication and should not be construed as investment advice. Oil market conditions are subject to rapid change based on geopolitical developments, diplomatic outcomes, and macroeconomic factors. Readers should consult primary sources including the U.S. Energy Information Administration's critical energy chokepoint analysis and independent commodity market research before making any financial or commercial decisions based on the scenarios described above.
Want to Profit From the Next Major Resource Discovery Before the Market Catches On?
While geopolitical shocks reshape global energy markets, Discovery Alert's proprietary Discovery IQ model scans ASX announcements in real time, instantly identifying significant mineral discoveries with the potential for outsized returns — the kind of opportunity that historically rewarded early investors in companies like De Grey Mining and WA1 Resources. Explore what major discoveries can mean for investors on Discovery Alert's dedicated discoveries page, and start your 14-day free trial today to position yourself ahead of the market.