
June 25, 2026
The Hidden Fault Lines Beneath a Booming U.S. Energy Quarter
When commodity markets move violently, the instinct is to focus on the price itself. Yet the more revealing signal often lies beneath the headline number, embedded in the operational decisions, cost structures, and planning behaviours of the people who actually run drilling programs. The Q2 2026 Dallas Fed Energy Survey captures exactly this kind of granular intelligence, and what it reveals is a U.S. upstream sector that is simultaneously accelerating and fracturing along multiple structural pressure points.
The Dallas Fed Energy Survey Iran conflict and rising costs narrative has dominated industry conversations through mid-2026, but the full picture is considerably more nuanced than a simple geopolitical premium story.
When big ASX news breaks, our subscribers know first
U.S. Upstream Momentum: Reading the Real Signal Behind the Index
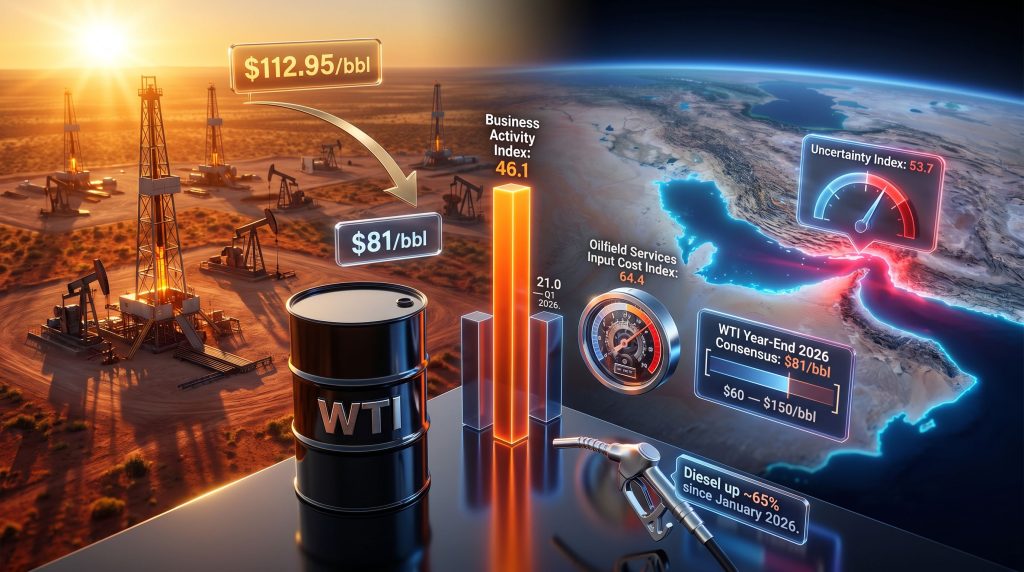
The Dallas Fed Energy Survey's business activity index advanced sharply from 21.0 in Q1 2026 to 46.1 in Q2 2026, representing the strongest reading since mid-2022. On the surface, this suggests a broadly healthy expansion across the U.S. Southwest energy corridor, encompassing Texas, New Mexico, and Louisiana.
However, headline index readings can obscure as much as they illuminate.
Nearly half of all survey respondents reported increasing capital deployment during the quarter, and oil production volumes registered incremental gains. Natural gas output, however, remained effectively unchanged quarter-over-quarter, reflecting domestic supply dynamics that are largely decoupled from the Middle East disruption driving crude price behaviour. Furthermore, the natural gas price forecast for the broader sector remains subdued relative to crude benchmarks.
Several structural divergences complicate the optimistic reading:
- Exploration and production firms reported improving outlooks, while oilfield service companies described a considerably more mixed environment
- The survey's uncertainty index climbed to 53.7, indicating that the activity surge is accompanied by deep hesitation around forward planning
- Capital spending acceleration appears partly reactive to price signals generated by geopolitical disruption, rather than being driven by organic demand growth or improved long-run economics
"A business activity index above 40 has historically correlated with broad-based sectoral expansion, but when that reading arrives alongside a record-high uncertainty index, the expansion itself becomes structurally fragile rather than a foundation for sustained multi-year growth."
The Iran Conflict as a Pricing and Planning Variable
The Strait of Hormuz: Physical Chokepoint, Psychological Multiplier
The Strait of Hormuz is the world's single most consequential petroleum chokepoint. Roughly 20% of global oil supply transits this narrow passage between Iran and Oman, meaning any credible disruption instantly reprices supply risk across every major crude benchmark. When conflict involving Iran intensified in 2026, the Strait moved from background risk to front-and-centre operational concern for U.S. energy executives.
Survey data captures the depth of that concern in concrete terms. According to reporting from E&E News, executives indicated there would be no quick rebound from a Hormuz disruption:
- 39% of respondents expect the Strait to remain closed through August 2026
- Only 20% anticipate a reopening within the month following the survey
- WTI crude traced an extraordinary arc across the conflict period, rising from a pre-conflict baseline near $67 per barrel, spiking to a peak of $112.95/bbl, before settling near $93/bbl at the time of survey
| Scenario | Operator Expectation |
|---|---|
| Strait closed through August 2026 | 39% of respondents |
| Reopening within one month | 20% of respondents |
| Sustained shipping cost elevation post-conflict | 79% of respondents |
| Additional per-barrel shipping cost increase expected | $2 to $4 per barrel |
| Future Strait disruption rated "very likely" within five years | 48% of respondents |
| Future Strait disruption rated "somewhat likely" | 38% of respondents |
The scenario that most concerned respondents involved a sustained closure driving WTI toward $170/bbl, a price level that multiple executives independently identified as sufficient to trigger a broad demand-destroying recession. Most participants expect resolution before that threshold is reached, but the very fact that experienced operators are modelling this pathway reflects how seriously the crude oil volatility risk is being weighted.
Why Real-Time Diplomacy Breaks Conventional Forecasting Models
Traditional commodity pricing frameworks rely on quantifiable supply and demand variables: production volumes, inventory levels, refinery utilisation, and seasonal consumption patterns. These models are well-suited to cyclical volatility. They are, however, poorly equipped to handle diplomatic signalling that can materially alter market expectations within minutes.
Survey respondents across multiple firm types described a compressed planning horizon as the most direct operational consequence of this environment. Programs tentatively scheduled for 2027 are particularly difficult to underwrite when the price assumptions underpinning those programs can shift by $30 to $40 per barrel based on a single diplomatic development.
One E&P executive noted that the unpredictability of diplomacy-by-social-media had become the single most difficult variable to incorporate into any planning framework. This is not merely a forecasting inconvenience — it has material consequences for capital commitment decisions, service contract structures, and long-dated hedging strategies. Consequently, the oil price shock experienced by executives in adjacent markets offers a useful parallel for understanding how rapidly sentiment can deteriorate.
Cost Escalation: The Structural Threat Competing With Price Upside
Oilfield Services Input Costs Hit Record Levels
While elevated crude prices generate revenue upside for producers, the cost side of the ledger is deteriorating at a pace that is partially offsetting those gains. The Dallas Fed's oilfield services input cost index reached 64.4 in Q2 2026, a record high that signals acute and broad-based pressure across the service supply chain.
The primary cost drivers identified by survey respondents:
- Diesel fuel costs have risen approximately 65% since January 2026, creating direct pressure on well site operations, logistics, and equipment deployment
- Pressure pumping services have moved into a seller's market, with service providers in some cases requesting premiums above agreed contract rates in exchange for confirmed completion scheduling
- Skilled labour remains tight across technical and operational roles, sustaining wage pressure that shows no sign of near-term relief
- Supplier delivery times extended during the quarter, compounding schedule reliability challenges for operators managing multiple concurrent programs
The pressure pumping dynamic deserves particular attention. For the first time in recent industry memory, some operators reported that completion contractors approached them requesting above-contract pricing in exchange for securing a confirmed frac date. This represents a fundamental inversion of the traditional buyer-seller relationship in oilfield services and signals just how tight completion capacity has become in active basin areas.
E&P Finding and Development Costs: The Upstream Squeeze
Cost escalation is not confined to the service sector. Among E&P companies, the finding and development cost index rose sharply from 5.7 to 22.3 in Q2 2026, while the lease operating expenses index climbed to 30.0. These metrics indicate that per-barrel economics at the development stage are deteriorating even as wellhead prices remain elevated.
"The industry faces a paradox in which higher crude prices, historically the primary catalyst for accelerated drilling, are being substantively offset by cost inflation that erodes the economic return on each incremental well."
In addition, broader commodity price impacts on capital-intensive industries suggest this cost-versus-revenue squeeze is not unique to upstream oil and gas. For operators evaluating 2027 development commitments, the combination of compressed planning visibility and rising per-well costs creates a structural disincentive to expand activity, even where commodity prices nominally justify investment.
U.S. Production Response: Capacity, Constraints, and the Permian
Despite the dual headwinds of cost inflation and planning uncertainty, the majority of survey participants anticipate domestic oil output will increase in response to the supply disruption created by the Iran conflict. The consensus projection centres on growth of more than zero but not more than 0.25 million barrels per day for full-year 2026, with 43% of respondents aligning around this range.
The Permian Basin remains the central driver of any U.S. production response. Oilfield service companies operating in the Permian reported improved business volumes during Q2 2026, consistent with the broader activity uptick. However, the same inflationary pressures documented at the national level are compressing service-sector margins in the basin.
The US shale slowdown documented in prior periods remains a relevant backdrop here. The Permian's long-term expansion potential is increasingly constrained not by reservoir quality but by service availability and input cost economics, a structural limitation that is unlikely to resolve quickly regardless of where crude prices settle.
Price Forecasting in a High-Uncertainty Environment
Where Executive Consensus Sits for Year-End 2026
| Commodity | Consensus Forecast | Low-End Estimate | High-End Estimate |
|---|---|---|---|
| WTI Crude Oil | $81/bbl | $60/bbl | $150/bbl |
| Henry Hub Natural Gas | $3.36/MMBtu | Varied | Varied |
The $90/bbl range separating the lowest and highest individual WTI forecasts is among the widest dispersion recorded in recent Dallas Fed survey history. According to analysis from Politico, this extraordinary spread reflects genuine epistemic uncertainty among experienced professionals who are effectively operating without a reliable reference scenario for the back half of 2026.
The consensus WTI estimate of $81/bbl implies meaningful price normalisation from the conflict-period peak of $112.95/bbl. Yet even executives who expect normalisation acknowledge that a post-ceasefire price reset will be slower and shallower than historical precedent suggests, given the accumulated disruption to supply chains and the structural elevation of Persian Gulf shipping costs.
Natural gas pricing remains subdued relative to crude, with the $3.36/MMBtu Henry Hub consensus reflecting domestic production dynamics that are largely insulated from Middle East supply disruption. The Dallas Fed Energy Survey Iran conflict and rising costs dynamic, therefore, affects crude and gas markets in materially different ways.
The next major ASX story will hit our subscribers first
Strategic Decision Frameworks for Operators Through Year-End
Three Scenarios Shaping 2026-2027 Capital Planning
Scenario 1: Strait Reopens Within 60 Days
Crude prices normalise toward $75-$85/bbl. Service cost pressures ease as supply chain anxiety recedes. Operators proceed with 2027 development programs under moderate price assumptions, with hedging strategies prioritising downside protection.
Scenario 2: Prolonged Closure Through Q3 2026
WTI sustains above $100/bbl, creating strong economic incentive for accelerated U.S. drilling. However, service cost inflation accelerates further under increased demand pressure, eroding per-well economics and limiting how much of the price signal translates into actual production growth.
Scenario 3: Escalation or Secondary Disruption
Price trajectory moves toward $130-$170/bbl. Recession risk increases materially, creating a paradox where extreme prices simultaneously incentivise supply and destroy demand. Capital spending decisions freeze sector-wide pending clarity on the conflict trajectory.
Operational Priorities for the Current Environment
- Hedging reassessment: The current price range and volatility structure create both risk and opportunity in derivatives markets; single-point price assumptions in capital budgets are no longer defensible
- Contract structure review: Oilfield service agreements should incorporate cost escalation provisions and scheduling protections, given the demonstrated willingness of service providers to seek above-contract pricing
- Supply chain diversification: Reducing dependency on single-source providers for critical completion operations, particularly pressure pumping, has become a material operational risk management priority
- Scenario-based capital allocation: Range-based capital budgeting frameworks now offer more decision-relevant guidance than traditional single-scenario models
Frequently Asked Questions
What is the Dallas Fed Energy Survey?
The Dallas Fed Energy Survey is a quarterly publication from the Federal Reserve Bank of Dallas that captures operational conditions, cost trends, capital spending intentions, and price expectations from oil and gas executives across the U.S. Southwest, primarily Texas, New Mexico, and Louisiana. It is widely regarded as one of the most reliable leading indicators of U.S. upstream sector health.
How has the Iran conflict affected U.S. upstream operators?
The conflict has created a multi-layered impact: temporarily elevated crude prices provide revenue upside, but simultaneously rising input costs, compressed planning visibility, and structural uncertainty around Persian Gulf shipping routes mean the net operational effect reported by the majority of survey respondents has been harmful to overall business conditions. The Dallas Fed Energy Survey Iran conflict and rising costs data makes this tension explicit.
What would a sustained Strait of Hormuz closure mean for oil prices?
Survey respondents modelled a scenario in which prolonged Strait closure pushes WTI toward $170/bbl, a threshold considered sufficient to trigger a demand-destroying global recession. Most executives expect some form of resolution before that level is reached, but the scenario is being actively incorporated into planning frameworks rather than dismissed as remote.
Why are oilfield service costs rising so sharply?
Diesel fuel costs have risen approximately 65% since January 2026, labour markets remain tight across skilled technical roles, and completion service demand, particularly pressure pumping, has tightened to the point where service providers hold meaningful pricing leverage. The Dallas Fed's oilfield services input cost index reaching 64.4 in Q2 2026 represents a record level for that series.
What is the industry's consensus oil price forecast for year-end 2026?
Survey respondents project an average WTI price of $81/bbl by year-end 2026, with individual estimates spanning from $60 to $150/bbl, one of the widest forecast ranges in recent survey history and a direct reflection of the unprecedented uncertainty defining the current operating environment.
This article is based on publicly available survey data and industry reporting. All forward-looking statements, price forecasts, and scenario projections discussed herein reflect survey respondent views and should not be interpreted as investment advice. Commodity markets are subject to rapid and unpredictable change; readers should conduct independent due diligence before making any financial or operational decisions.
Want to Spot the Next Major Mineral Discovery Before the Broader Market Does?
While geopolitical shocks reshape commodity price expectations across oil and gas, the same volatile environment is creating significant re-rating opportunities across ASX-listed mineral explorers — and Discovery Alert's proprietary Discovery IQ model scans every ASX announcement in real time, instantly identifying significant mineral discoveries and turning complex data into actionable insights for both short-term traders and long-term investors. Explore historic examples of major discovery returns to understand the scale of opportunity, then start your 14-day free trial at Discovery Alert to position yourself ahead of the market.