
May 15, 2026
The Hidden Architecture of a Synchronized Global Selloff
Most market participants instinctively treat equity indices, currency pairs, and commodity prices as separate conversations. They follow different analysts, different data feeds, and different fundamental drivers. Yet periodically, a single macro shock cuts across all of these asset classes simultaneously, revealing the deep structural connections that link them beneath the surface.
That is precisely what is unfolding across the DAX 40, AUD/USD, and copper price under pressure right now. These three instruments, each representing a fundamentally different asset class, are experiencing coordinated selling pressure that traces back to a common source. Understanding why they move together during stress events is not just academically interesting. It is operationally critical for anyone managing cross-asset exposure or trying to anticipate where the next break will come from.
This article is based on technical and macro analysis published by IG Markets on May 15, 2026. The information presented is for educational purposes and does not constitute financial advice. CFDs are complex instruments and 69% of retail client accounts lose money when trading CFDs with this provider. Past performance is not a reliable indicator of future results.
When big ASX news breaks, our subscribers know first
One Macro Shock, Three Transmission Channels
The current episode of risk-off selling did not emerge from three separate catalysts. It emerged from one, transmitted through three distinct but interconnected market systems.
US President Trump's comments suggesting there was no urgency to reopen the Strait of Hormuz triggered the initial shock. The Strait of Hormuz is the narrow maritime chokepoint connecting the Persian Gulf to the Gulf of Oman, and approximately 20% of the world's traded oil supply moves through it. When access to that corridor is threatened, the consequences are not confined to the energy market. They ripple outward through inflation expectations, interest rate pricing, currency markets, and industrial demand forecasts in a cascading sequence that is both predictable and rapid.
The sequence runs roughly as follows:
- Oil price spike triggers immediate inflation re-acceleration fears
- Inflation fears push US Treasury yields higher across the curve
- Higher yields attract capital into USD-denominated assets, strengthening the dollar
- A stronger dollar mechanically depresses commodities priced in USD, including copper
- Growth deceleration fears weigh on export-dependent equity indices like the DAX 40
- Reduced risk appetite compounds selling in commodity-linked currencies like the Australian dollar
- Broader risk-off sentiment reinforces each of the above channels in a self-sustaining loop
This is not coincidence. It is architecture.
Oil, Yields, and the Dollar: The Triple-Threat Setup
At the core of the current pressure lies a convergence of three macro forces hitting simultaneously. Furthermore, the tariff impact on supply chains continues to add complexity to an already stressed global trade environment.
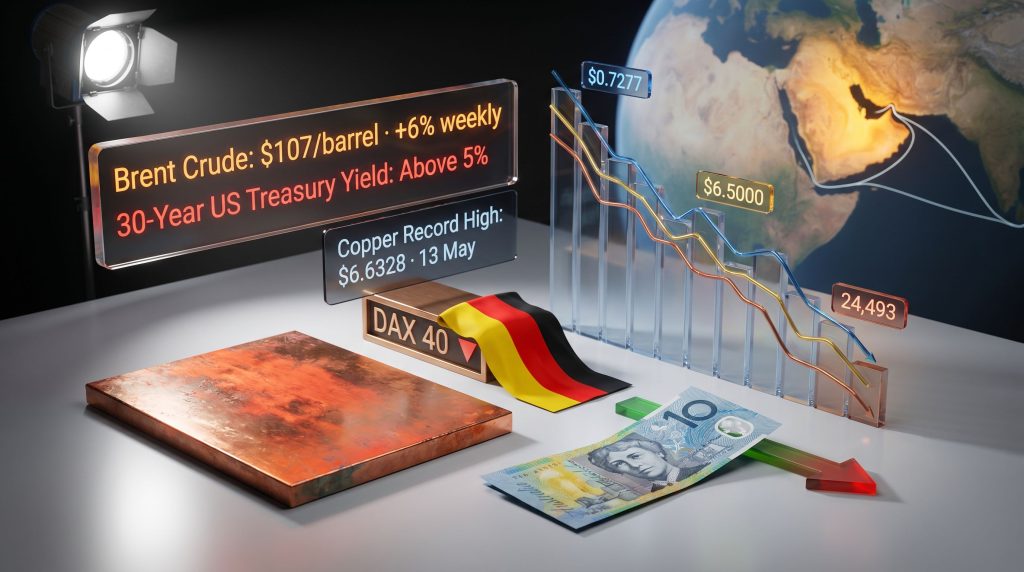
Brent crude climbed above $107 per barrel, representing a weekly gain of nearly 6%, driven by fresh shipping disruptions, the absence of any US-Iran diplomatic progress, and the absence of reassurance from Washington about restoring normal Strait of Hormuz access. Oil at this level does not simply raise fuel costs. It functions as a forward signal to bond markets that inflation is not yet resolved.
The response in US Treasury markets was immediate and significant:
| Indicator | Level / Movement | Market Significance |
|---|---|---|
| 30-Year US Treasury Yield | Rose above 5% | Multi-month high; signals structural inflation concern |
| 2-Year US Treasury Yield | Highest level since 2025 | Pricing in probability of Fed rate hike |
| Brent Crude | Above $107/barrel | ~6% weekly gain; primary inflation catalyst |
| USD Index | Heading for strongest week in two months | Safe-haven demand reinforced by yield differential |
When the 30-year yield moves above 5%, it does something specific to equity valuations that is not always immediately visible in price action. The discount rate applied to long-duration earnings streams rises, compressing the present value of future cash flows. For growth-heavy indices trading at elevated multiples after a strong run-up, this valuation headwind can trigger rapid de-rating, particularly when institutional risk models simultaneously flag macro deterioration.
The short end of the curve tells a different story. A 2-year yield reaching its highest point since 2025 reflects market participants actively repricing Federal Reserve rate hike probability. This yield differential expansion pulls capital into USD assets from around the world, creating mechanical selling pressure on currencies like the Australian dollar that had recently reached multi-year highs.
DAX 40 Under Pressure: Technical Levels That Define the Near-Term Outcome
Germany's benchmark equity index carries a specific set of macro vulnerabilities that make it disproportionately exposed to an oil-driven risk-off episode. The country's industrial and chemical sectors face direct and immediate cost pressure when energy prices spike. Its heavy manufacturing base and automotive constituents depend on global demand forecasts that deteriorate when growth expectations contract.
After a significant multi-month rally that pushed the index to elevated levels, the conditions for accelerated profit-taking were already in place before the current shock arrived. The tariff-driven market volatility that has characterised much of 2025 and 2026 has only added to the fragility of sentiment across European equities.
The DAX 40 is now pulling back from its 14 May high of 24,493, and the near-term technical structure reveals a clear set of decision zones:
Resistance levels:
- 24,298 to 24,330: The zone defined by Friday's intraday high and the 14 May low. This band must be reclaimed to neutralise short-term selling pressure and signal a potential resumption of the prior uptrend.
Support levels:
- 24,118 to 24,047: The primary technical confluence zone where the 200-day simple moving average and the March-to-May ascending trendline intersect. This is the most structurally significant area to watch.
- 23,921: The 12 May swing low. A sustained break below this level would shift the narrative from a healthy correction within an uptrend toward something more structurally concerning.
- 23,716: The 30 April low and the anchor of the medium-term bullish structure. While price holds above this level, the broader uptrend remains technically intact.
Short-term outlook: Bearish while the DAX 40 trades below the 14 May high of 24,493. Medium-term outlook: Constructive while price holds above the 30 April low of 23,716.
Why the 200-Day SMA Matters More Than It Appears
The 200-day simple moving average is not simply a lagging indicator. It functions as an institutional reference point used by trend-following systems, quantitative funds, and discretionary portfolio managers alike to define long-term directional bias. When a major index approaches this level from above during a period of macro stress, the stakes elevate considerably.
A sustained close below the 200-day SMA on the DAX 40 would likely trigger three distinct consequences:
- Systematic trend-following models would begin reducing long exposure, adding mechanical selling pressure
- The probability of a deeper retracement toward the 23,716 structural anchor would increase substantially
- The prevailing narrative of a bull market in European equities would face a credibility test that could shift institutional positioning for weeks
The 24,118 to 24,047 zone is therefore not just a technical line. It is a decision point for institutional capital.
AUD/USD: When Commodity Strength Cannot Compete With Dollar Demand
The Australian dollar recently achieved a four-year high of $0.7277, a level that reflected genuine fundamental support from Australia's commodity-export economy and an improving domestic rate outlook. The subsequent retreat from that high illustrates a critical principle of cross-asset trading: even strong fundamentals can be overwhelmed by superior macro forces operating in the opposite direction.
Two forces are currently working in tandem against the AUD. According to recent IG Markets analysis, these dynamics have been building over several weeks, with the dollar's safe-haven appeal repeatedly overriding commodity-currency strength:
Force 1 — Safe-haven USD demand: Geopolitical uncertainty accelerates capital rotation toward the US dollar regardless of relative domestic economic conditions. When investors globally are reducing risk, they do not distinguish between strong and weak commodity exporters. They sell risk and buy safety.
Force 2 — Interest rate differential expansion: Rising US Treasury yields widen the return advantage of holding USD-denominated assets relative to Australian dollar assets. This attracts yield-seeking capital flows and mechanically reduces demand for the AUD, independent of what the Reserve Bank of Australia is doing domestically.
The result is that domestic Australian rate expectations, while supportive in isolation, are being overwhelmed by the broader macro deterioration originating in the Middle East and Washington.
AUD/USD Technical Structure: The Levels That Define the Trade
| Zone Type | Price Level | Technical Significance |
|---|---|---|
| Four-year high (recent peak) | $0.7277 | Major resistance and reversal origin |
| March to May support trendline | ~$0.7180 | Currently being tested; a break is significant |
| Primary support zone | $0.7150 | Near-term downside target if trendline fails |
| Late February high | $0.7136 | Secondary support where buyers emerged previously |
| Immediate resistance | $0.7186 to $0.7187 | Former support now acting as resistance |
| Late April high resistance | $0.7200 | Resistance above the immediate zone |
| Medium-term pivot | $0.71002 | 29 April low; bullish structure intact above this level |
Short-term outlook: Bearish while AUD/USD remains below the 15 May high of $0.7223. Medium-term outlook: Constructive while price holds above the 29 April low of $0.71002.
The operative question for AUD/USD traders is whether the March-to-May trendline at approximately $0.7180 holds on a closing basis. If it does not, the $0.7150 support zone becomes the primary target. A break through $0.7150 would technically invalidate the near-term uptrend and potentially accelerate the move toward $0.7136, where buyers previously demonstrated willingness to re-engage during late February.
What makes this configuration particularly important is the structural implication of the medium-term anchor at $0.71002. As long as that level holds, the broader bullish structure built from the April lows remains technically valid. The current selling is a test of conviction, not yet a confirmed trend reversal.
Copper's Fall From Record Highs: Correction or Something More Serious?
Copper achieved a historic milestone on 13 May 2026, recording an all-time high of $6.6328 per pound. The subsequent swift retracement raises a question that matters enormously for industrial demand forecasts, commodity currency valuations, and emerging market growth narratives: is this a healthy correction within a secular bull market, or does it signal something more structurally concerning?
The copper price rally that preceded this record high was fuelled by a confluence of supply concerns, tariff-driven demand pull-forward, and structural electrification tailwinds. However, the metal has earned the informal title of the world's most reliable economic barometer precisely because of its pervasive role across the global economy. Copper moves through construction materials, electrical wiring, industrial machinery, electric vehicles, grid infrastructure, semiconductor equipment, and data centre cooling systems.
When its price falls sharply from a record high, the market is typically pricing one or more of the following:
- Slower Chinese industrial output: China accounts for roughly 50 to 55% of global copper consumption, making it the single most important demand variable in the world copper market
- Reduced global manufacturing activity: Purchasing Managers' Index deterioration typically precedes copper demand softness by several weeks, giving the metal a genuine leading-indicator quality
- USD appreciation: As a dollar-denominated commodity, copper faces a mechanical price headwind whenever the greenback strengthens, entirely independent of any change in physical demand
- Speculative position unwinding: Record price levels attract momentum-driven positioning from systematic and discretionary traders, which reverses sharply when sentiment shifts
In the current episode, all four of these forces are operating simultaneously.
Copper Technical Landscape: Where Does the Selling Stop?
Key reference levels as of 15 May 2026:
- Record high and reversal origin: $6.6328 (13 May 2026)
- Minor resistance: $6.5000 (psychologically significant round number)
- Primary downside target zone: $6.1543 to $6.1623 (defined by the confluence of mid-January to mid-May prior highs)
- Medium-term structural anchor: $5.7732 (4 May swing low)
Short-term outlook: Bearish while copper trades below $6.5000. Medium-term outlook: Constructive while price holds above the 4 May low of $5.7732.
The $6.1543 to $6.1623 zone is the most technically significant area to monitor. It represents the confluence of multiple prior resistance levels that previously acted as ceilings, meaning that when price revisits from above, the same levels tend to attract buyers who recognise the structural significance. Whether that zone holds will largely determine whether the current episode is classified as a standard post-record profit-taking correction or the beginning of a more extended retracement.
It is worth noting that the underlying demand drivers for copper over a multi-year horizon remain structurally intact. Electrification infrastructure, EV adoption, grid expansion programmes, and AI data centre buildouts all require substantial and growing copper volumes. Consequently, these factors do not disappear during a short-term risk-off episode. They simply move to the background while macro forces dominate price action.
The next major ASX story will hit our subscribers first
Cross-Asset Correlation: How the Three Markets Amplify Each Other
Understanding the simultaneous pressure across DAX 40, AUD/USD, and copper price under pressure requires mapping the specific macro sensitivity each carries and how those sensitivities interact during stress events. In addition, broader copper market trends highlight how supply constraints and demand dynamics compound the picture for commodity-linked assets.
| Asset | Primary Stress Driver | Secondary Driver | USD Sensitivity |
|---|---|---|---|
| DAX 40 | Energy cost shock via oil | Global growth deceleration | Indirect, via EUR/USD |
| AUD/USD | Safe-haven USD demand | Risk appetite deterioration | Direct and inverse |
| Copper | Industrial demand contraction | China growth outlook | Direct and inverse |
The feedback loop sustaining the current selling pressure operates across these interconnections continuously. Oil disruption drives inflation fears, which push yields higher, which strengthens the dollar, which pressures copper and the AUD simultaneously, while energy cost shocks and growth concerns weigh on European industrial equities through a separate but parallel channel.
The result is a self-reinforcing system where weakness in one market provides additional confirmation of the macro narrative that drives weakness in the others.
Early Warning Signals From Asian Markets
Two developments in Asian equity markets deserve attention as leading indicators of the broader risk environment.
Japan's Nikkei 225 fell as much as 1.8% after wholesale inflation accelerated to 4.9% in April, compounding concerns about cost pressures in an already fragile consumer environment. Technology sector profit-taking added further weight, with semiconductor-related names among the hardest hit.
The KOSPI provided perhaps the most striking illustration of current sentiment fragility. The index briefly surpassed 8,000 for the first time in its history before plunging more than 5% in the same session. This kind of milestone-then-reversal sequence is a textbook pattern of exhaustion behaviour. When a widely anticipated milestone is achieved and the market immediately reverses, it typically signals that the buyers who drove the advance have been fully absorbed.
The remaining marginal demand is insufficient to sustain the level, leaving the market structurally vulnerable to aggressive mean-reversion. This pattern is worth internalising as a broader lesson about risk appetite. When even record-breaking milestones trigger sharp reversals rather than continuation, the underlying sentiment environment is considerably thinner than headline price levels suggest.
What Could Change the Outlook: Catalysts in Both Directions
Potential reversal catalysts for risk assets:
- De-escalation of Middle East tensions and restored confidence in Strait of Hormuz access
- Softer-than-expected US inflation data reducing the probability of Fed rate hike action
- Stabilisation in oil prices removing the inflation re-acceleration narrative from Treasury markets
- Stronger-than-anticipated China commodity demand supporting copper and commodity-linked currencies
Potential acceleration catalysts for further selling:
- Brent crude sustaining above $110 per barrel, deepening inflation concern
- The US 30-year yield holding above 5% for multiple sessions, signalling structural rather than transient inflation
- Further UK political deterioration spilling into broader European sentiment and weighing on the euro
- Continued weakness across Asian equity markets confirming a global rather than regional risk-off episode
The sequencing matters here. Reversal catalysts tend to operate with a delay because geopolitical de-escalation is rarely sudden. Acceleration catalysts can materialise overnight through a single headline. This asymmetry in timing means that risk management discipline in the near term is more important than directional conviction.
Frequently Asked Questions
What is causing the DAX 40 to sell off?
The DAX 40 is retreating from its 14 May high due to a combination of rising oil prices driven by Middle East supply disruption, higher US Treasury yields reigniting inflation concerns, and broader risk-off sentiment reducing appetite for growth-sensitive European equities. Germany's structural reliance on energy imports makes it particularly exposed to sustained oil price shocks.
Why is AUD/USD falling despite Australia's commodity sector strength?
While Australia's commodity-export profile typically provides structural support for the Australian dollar during commodity price rallies, the current environment features a powerful countervailing force in safe-haven demand for the US dollar. Rising yields and geopolitical uncertainty are directing capital toward USD assets, overwhelming the positive domestic support the AUD would normally receive. For further context on how global fears weigh on AUD/USD, this dynamic has been building consistently across recent months.
Is the copper pullback from record highs the start of a trend reversal?
Not necessarily based on current technical evidence. The medium-term structure remains constructive while copper holds above the 4 May low of $5.7732. The retreat from $6.6328 is consistent with normal post-record profit-taking behaviour, particularly during a period of USD strength. The critical test will be whether the $6.1543 to $6.1623 confluence support zone absorbs the selling pressure or yields to further downside.
What is the Strait of Hormuz and why does it move financial markets?
The Strait of Hormuz is a narrow maritime passage between the Persian Gulf and the Gulf of Oman through which approximately 20% of the world's traded oil supply transits daily. Any disruption to navigation through this corridor produces immediate upward pressure on global oil prices, which cascades into inflation expectations, interest rate pricing, currency markets, and equity valuations in a rapid and interconnected sequence.
How do US Treasury yields affect the AUD/USD exchange rate?
When US Treasury yields rise, the return on USD-denominated assets increases relative to those in other currencies, attracting global capital flows into the dollar. This raises demand for USD and reduces demand for currencies like the Australian dollar. The resulting interest rate differential creates downward pressure on AUD/USD that operates independently of Australian domestic economic conditions. The DAX 40, AUD/USD, and copper price under pressure all ultimately trace their current difficulties back to this yield-driven mechanism.
The technical levels and market analysis referenced throughout this article are drawn from IG Markets research published on 15 May 2026. This content is intended for informational and educational purposes only. It does not constitute investment advice. Trading leveraged products including CFDs carries significant risk and may not be suitable for all investors. You should seek independent financial advice before making any trading decisions.
Want to Know Which ASX Mineral Discoveries Are Moving Markets Right Now?
When macro shocks ripple across copper, currencies, and equities simultaneously, identifying high-conviction commodity opportunities becomes both more urgent and more complex — Discovery Alert's proprietary Discovery IQ model cuts through that noise by delivering real-time alerts on significant ASX mineral discoveries the moment they are announced, transforming complex data into actionable insights. Explore historic discoveries and the substantial returns they generated to understand what's possible, then start your 14-day free trial at Discovery Alert and position yourself ahead of the broader market.