
July 31, 2026
The Refinery Margin Problem That Crude Oil Prices Cannot Solve
Most commodity investors instinctively reach for crude oil charts when assessing fuel cost risk in the mining sector. It is a logical reflex, and for most of the past four decades, it produced reasonable results. However, the relationship between crude benchmarks and diesel prices and mining fuel costs that actually flow through profit and loss statements has fractured in ways that demand a different analytical framework entirely.
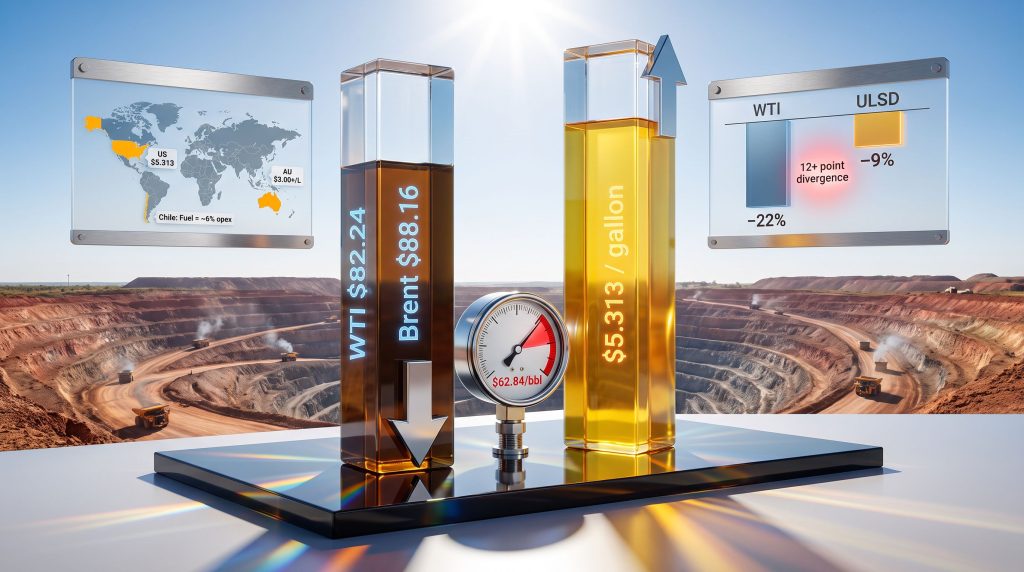
The divergence is not subtle. Since June 1, 2026, WTI futures have declined approximately 22%, yet ultra-low sulfur diesel futures have retreated just over 9% over the same period. That gap of more than 12 percentage points represents something far more consequential than a temporary pricing anomaly. It reflects a structural breakdown in the supply chain connecting crude feedstocks to refined middle distillates, with direct, measurable consequences across every major producing jurisdiction.
Understanding why this gap exists, how wide it could grow, and when it might close is now among the most material questions facing mining sector analysts and investors. Furthermore, the crude oil price trends currently visible in futures markets tell only part of the story.
When big ASX news breaks, our subscribers know first
Why Crude and Diesel Prices Are No Longer Moving Together
The Refinery Layer That Investors Routinely Underestimate
Crude oil is a raw material. Diesel is a manufactured product. Between the wellhead and the fuel tank of a haul truck sits a refinery, and it is within that refinery system where the current pricing dislocation is being generated.
When WTI settled at $82.24 per barrel (down 1.62%) and Brent at $88.16 per barrel (down 0.98%) in late July 2026, the market was responding to improving Strait of Hormuz shipping flows. Commonwealth Bank of Australia reported that Hormuz traffic had recovered to approximately 30% to 35% of pre-conflict normal levels, sufficient to reduce near-term crude disruption fears and pull benchmarks lower.
However, US retail on-highway diesel simultaneously sat at $5.313 per gallon, representing a 39.6% increase year-over-year. The crude price was declining; the diesel price was not. The reason lies in the architecture of the refined product supply chain, not in crude availability.
Three Structural Reasons Diesel Ignores Crude Price Declines
-
Refinery capacity is effectively maxed out. US refineries were operating at 97.2% of nameplate capacity as of late July 2026, leaving only approximately 497,000 barrels per day of spare processing capacity across the entire country. When refineries are already running at that intensity, higher margins cannot attract additional output because there is no additional capacity available in the short term.
-
Distillate inventories remain structurally depleted. US distillate stocks stood at approximately 110.6 million barrels, roughly 10% below the five-year seasonal average. When buffer stocks are thin, any demand increase or supply shortfall has a disproportionate price impact because there is no inventory cushion to absorb the shock.
-
Refined product export infrastructure is separately impaired. Gulf crude exports recovered by 6.5 million barrels per day in June 2026 to reach 16.1 million barrels per day, but refined product and LPG exports from the same region remained below 50% of pre-conflict levels. Major Gulf export refineries had not resumed operations as of the IEA's July 10, 2026 reporting date, with no published restart timeline available.
The US diesel crack spread reaching $62.84 per barrel, its highest level since early June 2026, is the financial expression of these three constraints converging simultaneously. The crack spread measures the margin refiners earn between buying crude and selling diesel. When it is this elevated, it signals that diesel supply cannot respond to higher prices through increased output, which is the textbook definition of inelastic supply. In addition, oil market disruptions at the geopolitical level have compounded these structural supply-side pressures considerably.
The Global Diesel Price Landscape for Mining Operations
What Mining Companies Are Actually Paying in 2026
The price pressures facing mining operations are not confined to the United States. The following table captures the pricing environment across key mining jurisdictions as of July 2026.
| Region / Benchmark | Diesel Price (July 2026) | Year-on-Year Change |
|---|---|---|
| US National Average (on-highway) | $5.313/gallon | +39.6% |
| US West Coast | $6.067/gallon | Elevated |
| California | $6.670/gallon | Elevated |
| Australia (retail diesel) | AUD $3.00+/litre (some regions) | +47% YoY (IEA, May 2026) |
| Singapore benchmark diesel swaps | ~$180/barrel | ~+95% vs. pre-conflict |
| Chile fuel cost (% of copper opex) | ~6% under normal conditions | Rising materially |
Australia is a particularly instructive case. Gasoil accounts for approximately 50% of the country's total oil demand, making it the dominant refined fuel across mining, agriculture, and long-haul freight simultaneously. Australia's energy export challenges have compounded this exposure, as the country's heavy reliance on imported refined products leaves it vulnerable to global supply disruptions.
When IEA data showed Australian retail diesel prices running 47% higher year-over-year in early May 2026, the ripple effect across the cost structures of ASX-listed mining companies was significant. Some operators reported paying more than double their original fuel cost guidance assumptions, with prices exceeding AUD $3.00 per litre in certain remote regions. According to reporting on rising fuel costs, these increases are flowing well beyond mining into transport, farming, and broader industry.
The Singapore benchmark, where diesel swaps were trading near $180 per barrel compared to approximately $92.50 per barrel pre-conflict, confirms this is not a US-specific phenomenon. The Asian refined product market is experiencing its own version of the same structural dislocation.
Quantifying the Financial Damage to Mining Margins
How Much Diesel Costs Are Actually Moving the Numbers
For open-pit mining operations, diesel is not a marginal cost line. It is a primary operating cost driver, typically estimated to represent 15% to 25% of all-in sustaining costs (AISC), depending on haul distance, equipment fleet size, and the availability of grid power.
The financial exposure is not linear. A sustained $1.50 per gallon increase in diesel costs, which is broadly consistent with the year-over-year movement recorded in mid-2026, can convert a marginally profitable open-pit operation into an economically unviable one, particularly for remote or off-grid projects where diesel powers both mobile equipment and electricity generation simultaneously.
The sensitivity mathematics are stark:
| Diesel Price Scenario | Estimated Sector Impact |
|---|---|
| +$0.10/gallon sustained increase | ~$70 million additional cost per major diversified miner (illustrative) |
| +$1.50/gallon sustained increase | Potential multi-billion dollar additional annual expenditure across the sector |
| Fuel costs at 2x original guidance | Material AISC blowout; feasibility review risk for marginal projects |
Consequently, the commodity price impact on mining company performance is being felt most acutely through this diesel channel rather than through metals price volatility alone.
Critically, the supply imbalance producing these outcomes is highly specific to middle distillates. Propane and propylene inventories in the US were running 34% above the five-year seasonal average in mid-2026, with Mont Belvieu propane trading near $0.710 per gallon, essentially unchanged from $0.711 per gallon a year earlier. The contrast with diesel could not be starker.
When lighter hydrocarbon fractions are in surplus while middle distillates are in acute deficit, the market is communicating something precise: refinery configuration and product-specific supply chains are the governing variables, not crude availability. Miners are structurally exposed to the wrong side of this split.
Geopolitical Amplifiers: Why the Pressure Could Intensify
The Russian Refinery Variable and Sanctions Risk
Two geopolitical dynamics have amplified the diesel supply constraint beyond what Middle East shipping disruptions alone would have produced.
Ukrainian strikes on Russian refinery infrastructure have reduced Russian refined fuel export volumes meaningfully, removing a supply source that European and Asian markets had historically relied upon to balance distillate shortfalls. This occurred independently of the Hormuz situation, creating a compounding effect on global diesel availability.
Separately, proposed additions to a bipartisan US sanctions bill would target countries purchasing Russian energy, with the legislation primarily affecting third-party buyers of Russian oil and gas. The practical effect would be additional pressure on diesel markets rather than crude supply. The US Strategic Petroleum Reserve standing at 307.7 million barrels as of late July 2026, approximately 95.1 million barrels below year-earlier levels, also limits the government's capacity to execute another large emergency release to cap fuel prices. Analysts tracking the broader mining commodity outlook have flagged this geopolitical layer as a key risk multiplier for cost forecasting.
Furthermore, the Australian Institute of Petroleum's analysis of the diesel market underscores that Australia's import dependence for refined fuels leaves it particularly vulnerable when global refinery capacity is constrained.
Scenario Analysis: When Could Diesel Prices Ease for Miners?
Three Pathways and Their Implications for Mining Cost Structures
Base case: Partial Hormuz recovery, persistent product constraints
Commonwealth Bank of Australia identified the 50% to 60% of normal traffic threshold as the level at which Hormuz recovery would restore crude oversupply conditions and pull Brent toward its June 2026 average of approximately $85.40 per barrel. However, Gulf refined product exports remaining below 50% of pre-conflict levels would prevent this crude softening from translating into diesel price relief. For miners, AISC pressure persists.
Bear case: Shipping recovery stalls
Hormuz traffic remains at 30% to 35% of normal flows, sustaining crude tightness alongside diesel scarcity. National retail diesel holds above $5.313 per gallon, with West Coast and California prices remaining above $6.00 to $6.67 per gallon. The SPR buffer is limited. Margin compression intensifies for high diesel-intensity operations.
Bull case: Refinery and export recovery
Gulf refined product exports recover above 50% of pre-war levels, distillate inventories rebuild toward the five-year seasonal average of approximately 123 million barrels, and crack spreads narrow from the $62.84 per barrel peak. Retail diesel retreats toward the $4.00 to $4.50 per gallon range. Operations with lower diesel intensity benefit first; open-pit and remote operations follow with a lag.
The next major ASX story will hit our subscribers first
Operational Design as the Real Fuel Cost Differentiator
Why Mine Architecture Now Determines Fuel Cost Exposure
In a market where crude can fall 22% while diesel retreats only 9%, the traditional assumption that lower oil prices reduce diesel prices and mining fuel costs in any straightforward way has been invalidated. The competitive differentiation in the current environment has shifted to operational structure.
| Screening Factor | Lower Fuel Cost Risk | Higher Fuel Cost Risk |
|---|---|---|
| Mining method | Underground | Open-pit, long-haul |
| Power source | Grid-connected | Diesel generation |
| Location | Infrastructure-rich | Remote, off-grid |
| Fuel hedge coverage | Hedged 12+ months forward | Unhedged or short-dated |
| Haul distance | Short | Long |
Underground operations consume less diesel per tonne of ore processed than open-pit equivalents because haul distances are shorter and electric haulage systems are more readily deployable. Grid-connected mines can substitute diesel generation entirely for grid electricity, dramatically reducing fuel exposure.
Remote, off-grid, long-haul open-pit operations, however, face a compounding burden: diesel powers both their mobile equipment fleet and their power generation simultaneously. Mine design is therefore not simply a capital efficiency variable. In the current fuel cost environment, it is a structural determinant of whether an operation remains economically viable.
The Indicators That Signal When Relief Is Coming
A Monitoring Framework for Tracking Diesel Price Trajectories
Given the structural nature of the current dislocation, investors and analysts should focus on a specific set of forward-looking indicators rather than crude price movements alone.
Primary indicators:
-
EIA Weekly Petroleum Status Report: Tracks US crude and distillate inventory levels. The distillate number, currently near 110.6 million barrels, is the most direct measure of refined fuel supply tightness.
-
EIA Weekly Retail Diesel Price Data: The national and regional on-highway series. The $5.313 per gallon national average and $6.670 per gallon California price are the baseline benchmarks from which improvement should be measured.
-
IEA Oil Market Report (monthly): Covers global refinery output, product trade flows, and export refinery restart timelines. The July 10, 2026 report confirmed Gulf export refinery loadings had not resumed, with no published restart schedule.
-
US Diesel Crack Spread: Currently at $62.84 per barrel. Sustained levels above $50 per barrel signal that diesel supply constraints remain structural. A meaningful decline toward the $30 to $35 per barrel range would indicate product market normalisation is underway.
Secondary indicators:
-
Strait of Hormuz traffic data: The 50% to 60% recovery threshold is the key trigger for crude oversupply restoration.
-
Gulf refined product export volumes: Recovery above 50% of pre-conflict levels is the threshold associated with meaningful diesel price relief.
-
Propane versus diesel price spread: The current propane surplus alongside diesel deficit is a structural signal. When this spread begins to narrow, it may indicate refinery configurations are adjusting toward greater middle distillate output.
For investors assessing individual mining company exposure, company filings remain the most direct source of fuel cost intelligence. Fuel hedge book summaries, hedge expiry profiles, AISC sensitivity disclosures, and diesel intensity metrics per tonne should be the primary screening tools. Fuel costs could rise further from current levels, and mining equities remain subject to full capital loss. This analysis is provided for informational purposes only and does not constitute financial or investment advice.
Frequently Asked Questions: Diesel Prices and Mining Fuel Costs
Why does diesel stay expensive when crude oil prices fall?
Crude and diesel respond to different supply variables. Crude benchmarks reflect the availability of unrefined oil. Diesel prices reflect refinery utilisation rates, distillate inventory levels, and regional product trade flows. At 97.2% refinery utilisation with distillate stocks 10% below the five-year average and major export refineries offline, diesel supply cannot increase quickly enough to respond to higher margins. The price stays elevated regardless of what crude does.
What share of mining costs does diesel represent?
For open-pit operations, diesel typically accounts for an estimated 15% to 25% of AISC. The exact proportion varies by mining method, haul distance, and power source. Underground and grid-connected operations carry materially lower diesel intensity, which is now a meaningful competitive cost advantage in an environment where diesel prices and mining fuel costs remain structurally elevated.
What is the diesel crack spread and why should miners watch it?
The crack spread measures the margin between crude input costs and diesel output prices at the refinery level. The current $62.84 per barrel crack spread indicates that refiners are capturing exceptional margins, which also means diesel buyers, including mining companies, are paying a substantial premium above crude costs. When the crack spread normalises toward historical ranges, diesel prices tend to follow.
When could diesel prices realistically ease?
Meaningful diesel price relief for miners requires Gulf export refinery operations to resume, refined product exports to recover above 50% of pre-conflict levels, and US distillate inventories to rebuild toward the five-year seasonal average of approximately 123 million barrels. No Gulf refinery restart schedule had been published as of July 2026. The timing remains genuinely uncertain.
Want to Stay Ahead of ASX Mining Opportunities Despite Rising Cost Pressures?
As fuel cost structures reshape mining margins across every major jurisdiction, identifying the right discoveries at the right time has never been more critical — Discovery Alert's proprietary Discovery IQ model delivers real-time alerts on significant ASX mineral discoveries, turning complex market data into actionable insights the moment they hit the exchange. Explore how historic discoveries have generated substantial returns by visiting Discovery Alert's dedicated discoveries page, and begin your 14-day free trial today to position yourself ahead of the broader market.