
July 14, 2026
The Hidden Cost Nobody Talks About: Why Cheap Crude Doesn't Mean Cheap Diesel
Most commodity market observers focus on crude oil benchmarks as a reliable guide to energy costs across the economy. When Brent falls, the assumption is that fuel bills follow. This assumption is one of the most consequential misreadings in commodity markets today, and it is costing mining operators millions in unexpected operating expenditure.
The reality is that crude oil and diesel are connected by refinery infrastructure, not by a fixed price relationship. When that infrastructure is constrained, the two can move in entirely opposite directions. In mid-2026, that divergence reached levels that cannot be dismissed as temporary noise. It signals a structural problem in the global refining system that has direct and measurable consequences for energy-intensive industries, particularly mining.
Understanding why diesel prices and refinery constraints are the real story behind fuel costs in 2026 requires looking well beyond the crude oil price trends that dominate financial headlines.
When big ASX news breaks, our subscribers know first
Crude Fell Sharply. Diesel Didn't Follow. Here's Why
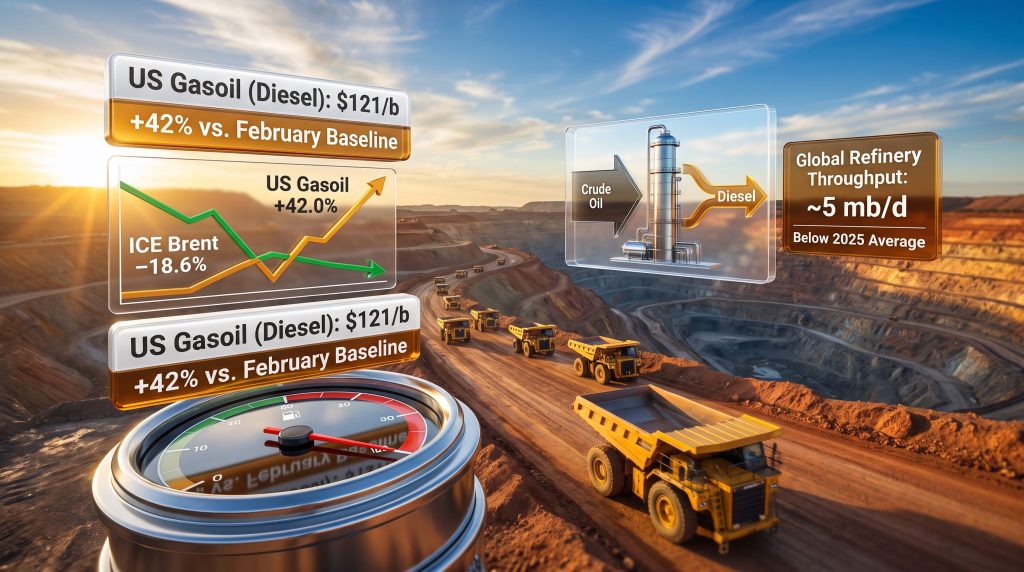
Between February and June 2026, ICE Brent declined from approximately $103.71 per barrel to an average of $84.43 per barrel, a drop of around 18.6%, according to OPEC Monthly Oil Market Report data. NYMEX WTI fell a similar 17% over the same period, settling at $81.79 per barrel in June.
On paper, that looks like meaningful relief for fuel buyers. In practice, it delivered almost none.
US gasoil, the benchmark for wholesale diesel, averaged $121 per barrel in June 2026, which is 42% above February levels. Jet fuel averaged $127 per barrel, running 29% above February. These are not marginal premiums. They represent a fundamental decoupling between the crude input cost and the refined product output price.
| Metric | February Baseline | June 2026 | % Change |
|---|---|---|---|
| ICE Brent (avg) | ~$103.71/b | $84.43/b | -18.6% |
| NYMEX WTI (avg) | ~$98.51/b | $81.79/b | -17.0% |
| US Gasoil (Diesel) | ~$85.21/b | $121.00/b | +42.0% |
| Jet Fuel | ~$98.45/b | $127.00/b | +29.0% |
Sources: OPEC Monthly Oil Market Report; EIA Weekly Petroleum Status Report; Crux Investor Analysis
The explanation sits entirely in the refinery, not in the oilfield. Crude was available. The capacity to convert it into diesel at the volumes required by global markets was not.
Crack Spreads and the Refinery Bottleneck
The concept of a crack spread is central to understanding this dynamic. A crack spread measures the margin between crude oil input costs and refined product output prices. It is, in effect, the refinery's profitability signal, and when it widens sharply it means the market is under-supplying refined products relative to demand.
In June 2026, European diesel crack spreads exceeded $60 per barrel and US spreads reached $62.84 per barrel. These are historically extreme levels. Under normal refinery operating conditions, crack spreads in the $15 to $25 per barrel range are considered healthy. A spread above $60 per barrel is an unambiguous signal that physical diesel supply is critically short relative to consumption requirements.
The underlying cause is a global refinery throughput shortfall. By June 2026, global refinery intakes were running approximately 5 million barrels per day below the 2025 average, according to OPEC's analysis. No crude price decline can compensate for a throughput gap of that magnitude. The barrel in the ground cannot reach the consumer if the processing capacity between them is offline. Furthermore, the oil market trade war impact has added further complexity to an already strained global supply chain.
"Crack spreads above $60 per barrel do not reflect demand surges. They reflect refinery system failures. The market is rationing supply through price because it cannot ration through volume."
What Actually Disrupted Global Refining Capacity
Geopolitical Damage to Processing Infrastructure
The throughput shortfall did not happen in isolation. It was produced by a cascade of geopolitical events that directly targeted or disrupted refining infrastructure across multiple regions simultaneously.
Ukrainian strikes on Russian refining assets removed a significant volume of European-grade diesel from export markets. Russia's temporary diesel export ban compounded this by restricting non-sanctioned barrel availability to markets that had grown dependent on Russian product flows. Middle Eastern refinery damage in Kuwait, Bahrain, and Saudi Arabia reduced regional output precisely when Asian refineries were already struggling with reduced crude arrivals.
The Strait of Hormuz closure in early 2026 was the single most damaging event. By cutting Middle Eastern crude deliveries to Asian refineries, it caused global refinery intakes to fall by 7.3 million barrels per day from pre-crisis levels in April 2026, the sharpest single-month decline of the year. As reporting from the Wall Street Journal noted, the Strait's return to normal operations cannot be assumed, a conclusion consistent with OPEC data showing persistently lower East-West product flows and VLCC freight rates on alternative routes running 160% above year-ago levels in June as alternative supply chains were activated at much higher cost.
Structural Western Refinery Closures
Overlaid on these acute geopolitical disruptions is a longer-running structural problem: the permanent reduction of refining capacity in North America and Europe. Refinery closures accelerated during the 2020 to 2023 period as operators faced margin pressure, regulatory costs, and uncertainty over long-term demand. That capacity is not coming back.
Two additional US refinery closures were pending as of mid-2026, further reducing the refined product pool. Kuwait's Al Zour refinery, one of the most significant new additions to global capacity, was experiencing an outage, with estimates suggesting between 600,000 and 1,000,000 barrels per day of capacity held offline by a combination of maintenance and disruption. When new capacity is offline and old capacity has been permanently retired, the system has very little margin for error.
Inventory Buffers Have Disappeared
The final amplifier of this constraint is the depletion of storage buffers that would normally absorb short-term supply shocks. OECD commercial oil inventories fell by 21.8 million barrels to 2,770 million barrels in May 2026, placing stocks 48.6 million barrels below the five-year average and a striking 185.8 million barrels below the 2015 to 2019 average. US distillate stockpiles alone were running 37.7 million barrels below the five-year average.
The Amsterdam-Rotterdam-Antwerp hub, Europe's primary diesel trading and storage centre, has maintained below-normal diesel inventories since 2023. When storage is thin and refinery throughput falls, price volatility is not merely possible — it is the mechanical outcome. Indeed, diesel price volatility has become one of the defining economic challenges of 2026 for energy-intensive industries.
Why Hedge Fund Selling Masked the Physical Reality
The June 2026 crude price decline was not primarily driven by a change in physical supply fundamentals. It was driven by paper market repositioning. Money managers and hedge funds sold a combined 245 million barrels of Brent and WTI futures and options, reducing ICE Brent net long positions by approximately 80%, the sharpest repositioning since the geopolitical risk premium emerged in early 2026.
This created a deeply misleading signal. Futures prices fell dramatically. Physical diesel prices did not, because physical diesel markets are governed by refinery output capacity, not by the directional bets of financial participants in crude futures markets.
The forward curve structure confirmed the physical reality. Brent, WTI, and Oman contracts all remained in backwardation through June 2026, meaning prompt delivery barrels commanded higher prices than forward delivery barrels. Backwardation is a reliable signal that physical inventories are insufficient to meet near-term demand. The fact that backwardation persisted even as futures prices fell sharply revealed that financial positioning and physical market conditions were telling entirely different stories.
"Futures markets are exceptionally good at pricing in sentiment, expectations, and positioning. They are considerably less reliable as guides to physical supply conditions when financial actors are repositioning rapidly in response to geopolitical developments."
It is also worth noting the broader context of where oil prices sat even after June's selloff. The OPEC Reference Basket fell $24.80 per barrel to $89.75 per barrel in June 2026, but its year-to-date average remained at $93.67 per barrel versus $72.04 per barrel for the full year 2025. The selloff reversed only a portion of 2026's geopolitical premium.
The Direct Hit to Mining Operating Costs
Open-Pit Operations Face Full Exposure
Diesel is not a secondary cost input for mining. In open-pit operations, it is frequently the single largest variable operating expense, powering haul trucks, excavators, drill rigs, auxiliary equipment, and camp facilities at remote sites. A 42% increase in wholesale gasoil prices over a five-month period translates directly into higher cost per tonne of material moved.
The exposure is not uniform across all mining operations. Haulage-intensive producers in copper and iron ore, where ore bodies require moving large volumes of waste material to access ore, carry the highest fuel cost sensitivity. Furthermore, the relationship between commodity prices and mining performance means that operators without fuel hedging strategies in place before January 2026 are positioned to report materially higher Q3 2026 operating costs as the full impact flows through to reported financials.
| Producer Category | Fuel Cost Exposure | Mitigation Options |
|---|---|---|
| Unhedged open-pit miners (Australia, Americas) | Full exposure to $121/b gasoil | Grid electrification, hedging |
| State-subsidised producers (Middle East, parts of Africa) | Partially offset by subsidies | Structural advantage |
| Grid-connected underground operations | Reduced diesel dependency | Lower vulnerability |
| Haulage-intensive bulk commodity producers | Maximum exposure | Limited near-term alternatives |
The Electrification Hedge: A Structural Solution to a Structural Problem
For operations with access to cost-competitive grid electricity, progressive electrification of surface equipment offers a credible path to reducing diesel price exposure structurally rather than just managing it financially. Underground operations in jurisdictions with reliable grid access already carry meaningfully lower diesel dependency than comparable open-pit operations.
The challenge is timeline. Mining fleet electrification at a major open-pit mine is a multi-year capital programme. It provides no relief for operators facing diesel prices at $121 per barrel in mid-2026. However, the longer-term investment case for electrification as a diesel price risk management strategy has strengthened considerably as the structural fragility of global refinery throughput has become undeniable. In addition, renewable energy in mining is increasingly being adopted as a complementary strategy to reduce overall energy cost exposure across site operations.
The next major ASX story will hit our subscribers first
Scenario Analysis: Pathways to Diesel Price Relief
| Scenario | US Gasoil (Diesel) | vs. February Baseline | Timeline for Relief |
|---|---|---|---|
| Base Case | ~$100-$107/b | +15% to +25% | October 2026 |
| Bear Case | ~$148/b | +73% | No near-term relief |
| Bull Case | ~$90-$95/b | +5% to +12% | Within 60 days of restart |
Base Case: Strait tensions remain at current elevated levels through Q3 2026, refinery throughput gradually recovers as maintenance schedules are completed and alternative supply routes normalise, and diesel prices decline toward 15% to 25% above February levels by October 2026. Unhedged mining producers begin seeing operating cost relief in Q4 2026.
Bear Case: A renewed Strait closure or further escalation of regional conflict pushes US jet fuel above $170 per barrel, approximately 78% above February levels, and US gasoil toward $148 per barrel, approximately 73% above February. Mining and airline fuel costs return to April 2026 peak levels within 30 to 60 days.
Bull Case: A confirmed diplomatic resolution and Strait reopening, combined with the Al Zour refinery and other offline capacity returning to full service, enables refinery throughput recovery above 2025 average levels. Diesel crack spreads compress toward historical norms and fuel cost relief arrives faster than the base case, potentially within 60 days of confirmed restart.
Key Indicators Every Fuel Cost Watcher Should Track
Rather than monitoring crude benchmarks, operators and investors seeking genuine signals about diesel prices and refinery constraints should focus on the following indicators:
- EIA Weekly Petroleum Status Report: Three consecutive weekly US distillate inventory draws indicate tightening diesel supply. Three consecutive builds signal refinery throughput recovery.
- ICE Gasoil Crack Spread: Compression toward the $20 to $30 per barrel range signals improving refinery economics and downstream supply recovery.
- VLCC Freight Rates (West Africa to East): These proxy rates measure the cost and severity of alternative routing around Strait disruptions. Declining rates signal normalisation.
- OECD Commercial Inventory Levels: The 48.6 million barrel deficit below the five-year average must close before structural price pressure abates.
- OPEC Monthly Oil Market Report: Tracks refinery throughput, product balances, and forward curve structure across all major producing regions.
Frequently Asked Questions: Diesel Prices and Refinery Constraints
Why do diesel prices stay high when crude oil prices fall?
Diesel is a refined product. Its price depends on how much conversion capacity is processing crude into diesel, not on how much crude is available. A 5 million barrel per day shortfall in global refinery throughput relative to 2025 averages is preventing crude price declines from translating into diesel cost relief.
What exactly is a crack spread?
A crack spread is the price differential between crude oil and a refined product, typically diesel or gasoline. It measures the refinery margin. When European diesel crack spreads exceed $60 per barrel, it means refineries are capturing extraordinary margins because physical diesel supply is critically short relative to demand.
How does a Strait of Hormuz closure affect diesel prices globally?
The Strait handles approximately 20% of global oil trade. A blockade reduces crude arrivals at Asian refineries, cutting their output and reducing global diesel supply simultaneously. Alternative supply routes are longer and significantly more expensive, which is reflected in freight rates running 160% above year-ago levels. The Australian fuel market is particularly exposed given its reliance on imported refined products from the Asia-Pacific region.
Which industries feel diesel price increases most acutely?
Open-pit mining, long-haul freight, aviation through jet fuel, and large-scale agricultural operations carry the highest diesel cost sensitivity. Within mining, haulage-intensive copper and iron ore producers operating in unsubsidised markets absorb the largest impact on a per-tonne-of-material-moved basis.
What would accelerate diesel price relief?
A confirmed and sustained Strait of Hormuz reopening combined with the restart of major offline refinery capacity, particularly Kuwait's Al Zour facility and other units held back by maintenance, would allow refinery throughput to recover and inventory buffers to rebuild. Under these conditions, crack spread compression and diesel price normalisation could occur within 60 to 90 days.
The Structural Takeaway for Miners and Market Watchers
The core lesson from mid-2026 is that diesel prices and refinery constraints operate as a system that is largely independent of crude benchmarks once throughput falls below critical thresholds. The 42% premium of US gasoil over February 2026 levels persisted through one of the sharpest crude selloffs of the year, driven by speculative repositioning rather than any improvement in physical supply.
For mining operators, the practical implication is straightforward: diesel cost exposure must be assessed against refinery throughput data and crack spread levels, not against Brent or WTI headlines. With OECD inventories sitting 48.6 million barrels below the five-year average and throughput running 5 million barrels per day below the 2025 average, the structural conditions for elevated diesel prices and refinery constraints remain firmly in place regardless of where crude trades on any given day.
This article contains forward-looking scenario analysis based on publicly available data from the OPEC Monthly Oil Market Report and EIA Weekly Petroleum Status Report as of July 2026. Fuel price scenarios involve inherent uncertainty and should not be interpreted as forecasts or financial advice. Readers should consult primary data sources and independent advisers before making operational or investment decisions based on fuel cost projections.
Want to Know Which ASX Mining Companies Are Best Positioned for Major Discoveries?
While diesel cost pressures squeeze mining margins, the greatest returns in the sector have historically come from identifying transformative mineral discoveries at the moment of announcement. Discovery Alert's proprietary Discovery IQ model scans ASX announcements in real time, delivering instant alerts on significant mineral discoveries — explore historic examples of exceptional discovery returns and begin a 14-day free trial to position yourself ahead of the broader market.