July 17, 2026
The Refinery Is the Bottleneck: Why Diesel Markets Are Breaking Down Faster Than Crude
Few frameworks in energy economics are more misunderstood than the relationship between crude oil and the fuels that actually power civilisation. The world does not run on crude. It runs on diesel, gasoline, jet fuel, and heating oil. Crude is merely the raw input. Refineries are the conversion infrastructure that transforms it into something usable. And right now, that conversion layer is where the global energy system is fracturing most visibly.
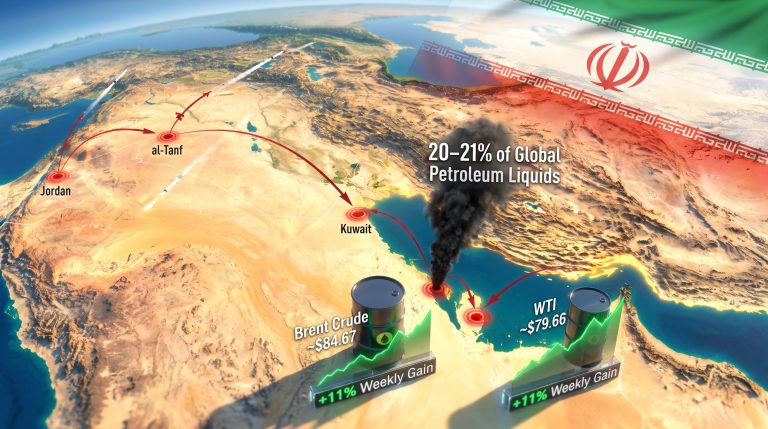
The Hormuz closure and diesel shortages it has generated represent something qualitatively different from a standard upstream supply disruption. This is not simply a problem of too little crude reaching markets. It is a multi-layer rupture that strikes simultaneously at crude flows, refining capacity, and finished product inventories, each layer compounding the damage of the last.
When big ASX news breaks, our subscribers know first
Understanding the Hormuz Closure: More Than an Oil Supply Problem
The Chokepoint in Numbers
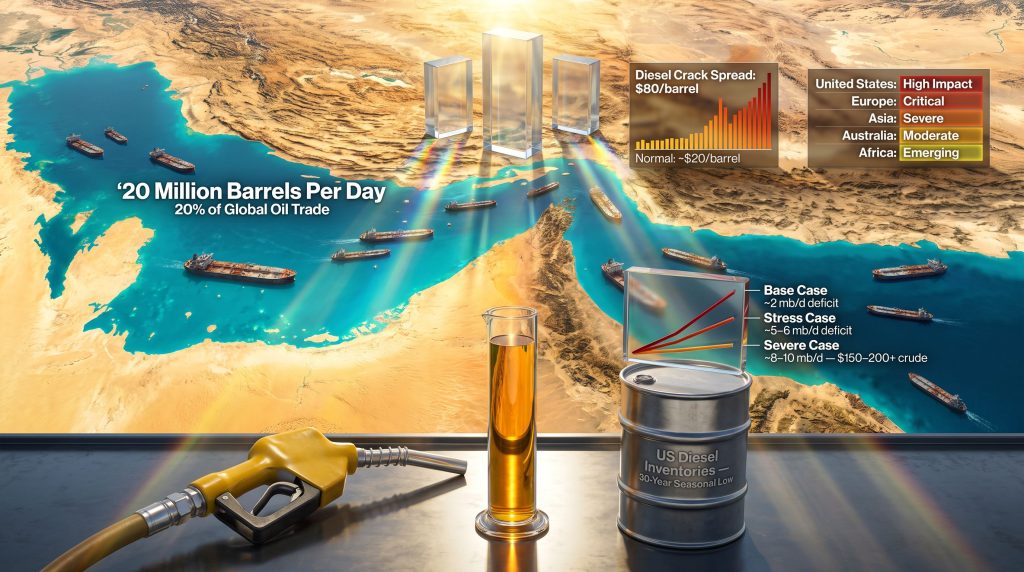
The Strait of Hormuz channels roughly 20 million barrels per day of energy commodities under normal operating conditions. Of that daily flow, approximately 15 mb/d is crude oil and 5 mb/d is refined petroleum products including diesel, jet fuel, and other middle distillates. What makes a Hormuz disruption uniquely destructive is that it severs not just upstream supply but the finished-product pipeline simultaneously.
Unlike crude oil, which can theoretically be rerouted through alternative pipelines over weeks and months, refined product flows cannot be rerouted with equivalent speed or volume. The offset pipelines that have compensated for some of the crude supply loss, including Red Sea routes and Gulf of Oman alternatives, carry crude only. Not a single barrel of refined product has moved through those alternatives at meaningful scale.
The consequence is a structural imbalance that looks like this:
| Market Layer | Current Condition |
|---|---|
| Upstream Crude Production | Partially disrupted; pipeline alternatives partially compensating |
| Refining Capacity (Global ex-China/Russia) | Running at maximum physical capacity |
| Diesel and Jet Fuel Inventories | At multi-decade seasonal lows across most OECD nations |
| Gasoline Inventories (US) | Lowest seasonal level in approximately 12 years |
| Diesel Inventories (US) | Lowest seasonal level in approximately 30 years |
The Three Forces Compressing Refined Product Markets
The diesel shortage is not the result of a single shock. Three separate forces have converged simultaneously, eliminating the market's ability to absorb any one of them in isolation. As analysts tracking crude oil price trends have noted, understanding these layered pressures is essential to grasping why markets have responded so violently.
Force 1: Gulf Refinery Damage
While upstream crude production in the Persian Gulf has faced disruption, confirmed refinery damage across the region has been disproportionately severe. Refineries are large, immovable, and highly flammable. They represent strategically attractive targets during conflict escalation, a dynamic that Iran demonstrated clearly through repeated strikes on regional refining infrastructure, including Kuwaiti facilities. Even in scenarios where crude has partially resumed flowing via alternative export routes, refined product exports have not recovered proportionally, because the facilities that produce those products are offline.
Force 2: Russian Refining Collapse
Ukraine's sustained drone campaign against Russian energy infrastructure has taken somewhere between one-third and one-half of Russian refining capacity offline. Russia was previously the world's second-largest seaborne supplier of diesel, exporting well over 1 million barrels per day of middle distillates into global markets. That supply has effectively vanished. Russia has sequentially banned exports of gasoline, jet fuel, and diesel.
In a remarkable reversal, Russia is now importing refined products from India, a country that itself depends heavily on Russian crude as a feedstock. The loop is as disorienting as it sounds: Russian crude exports to India, Indian refined products imported back into Russia.
Fuel queues inside Russia have reached proportions not seen since the Soviet era. Prices in some regions have reportedly peaked at the equivalent of $10 per gallon for gasoline. The scale of Russian refinery destruction is perhaps best illustrated by a single data point: Ukraine struck Russia's largest refinery, a facility processing over 400,000 barrels per day, located more than 2,700 kilometres from the Ukrainian front line, deep in Siberia.
Force 3: China's Refined Product Export Suspension
China holds the world's largest spare refining capacity. Under normal market conditions, Chinese refined product exports serve as a critical pressure valve for tight global markets. That valve has been closed. China has simultaneously slashed its crude imports and its refined product exports, removing the only meaningful source of swing refining capacity from the global market at precisely the moment it is most needed. Furthermore, the oil market disruptions created by these simultaneous shocks have compounded into something without modern precedent.
The Crack Spread Signal That Markets Cannot Ignore
A crack spread measures the price differential between a barrel of crude oil and the refined product derived from it. Under normal summer market conditions in the United States, the diesel crack spread averages approximately $20 per barrel. Gasoline crack spreads typically run in a similar range.
What Does a Crack Spread Actually Tell Us?
What is a diesel crack spread? A crack spread is the profit margin a refiner earns between the cost of crude oil and the sale price of refined fuel. A normal US diesel crack spread sits around $20 per barrel. When that figure exceeds $80 per barrel, as it has in mid-2026, it signals extreme scarcity in refined product supply relative to crude availability. Diesel crack spreads at current levels are more than four times the historical seasonal norm.
Gasoline crack spreads have reached approximately $50 per barrel, roughly 2.5 times normal levels. But the diesel figure is where the structural breakdown is most acute. According to analysis from the Bipartisan Policy Center, diesel and jet fuel markets have been disproportionately affected compared to gasoline, a pattern consistent with the refinery damage profile across the Gulf region. Diesel is currently trading at approximately twice the price of crude oil, a ratio with no modern precedent in global energy markets.
The implication for demand destruction modelling is significant and underappreciated. Historically, analysts modelled demand destruction scenarios at the crude price level, projecting thresholds like $150 or $200 per barrel for crude. But demand destruction does not occur at the crude level. It occurs at the product price level.
A scenario involving $100 crude plus an $180 diesel crack spread produces equivalent demand destruction to $200 crude under normal crack conditions, but at a crude price that would register as relatively contained in traditional market analysis. This decoupling makes standard price forecasting frameworks unreliable in the current environment.
The China Variable: A Shock Absorption Story with No Historical Parallel
How China Swung 5 Million Barrels Per Day
Between February and June 2026, China reduced its crude oil imports by approximately 5 million barrels per day, representing roughly 45% of its pre-war import volumes. To put that figure in context, it represents a larger balance adjustment than the entire collective IEA Strategic Petroleum Reserve release programme, the largest coordinated SPR release in IEA history, which totalled approximately 400 million barrels.
What makes this more analytically puzzling is that China achieved this demand contraction without the visible economic paralysis that would be expected from a shock of this magnitude. Urban congestion remained relatively stable. Air traffic continued. Truck movements across major logistics corridors held up. Critically, petroleum prices in major Chinese cities rose only around 30% at their peak, far below the levels that would typically be required to generate that scale of demand contraction through price rationing alone.
Three Competing Hypotheses for China's Resilience
No single explanation fully accounts for China's behaviour. Three hypotheses, each speculative to varying degrees, are worth examining.
Hypothesis 1: Economic Self-Interest Dressed as Altruism
China is an export-dependent economy. The regions most threatened by a severe energy price catastrophe, Europe and Asia, are also China's most important growth markets for export diversification away from the United States. Preventing a global economic collapse driven by $150-200 crude may have been a calculated act of self-preservation rather than geopolitical generosity. The weakness in this theory is that China has said nothing publicly to claim credit for absorbing the shock, which it likely would if this were a deliberate soft-power play.
Hypothesis 2: A Backroom Arrangement
Circumstantial evidence points to a possible undisclosed arrangement between the Trump administration and Beijing. Senior US officials visited China in early 2026 in discussions that appeared inconclusive at the time. One speculative reading suggests an implicit trade: China manages its energy imports and releases strategic stocks to stabilise global markets, while the US reduces its Pacific military posture, addressing Beijing's longstanding concern about strategic encirclement. This remains unconfirmed but is consistent with observable outcomes. The broader interplay between oil trade and geopolitics makes such arrangements strategically plausible.
Hypothesis 3: A Taiwan Contingency Dry Run
China has long feared what strategists call the Malacca Dilemma: the vulnerability created by dependence on seaborne energy imports routed through maritime chokepoints that adversaries could blockade in a conflict scenario. Building large strategic petroleum reserves has been a documented Chinese priority for years. The Hormuz closure may have functioned as an unplanned but highly informative stress test of China's ability to sustain economic function under an energy import blockade, precisely the scenario that would accompany a Taiwan conflict.
If this hypothesis is correct, the results are deeply concerning from a Western strategic planning perspective. China demonstrated a capacity to weather an energy blockade well beyond what external analysts had modelled as feasible.
The Inventory Gap No One Can Fully Explain
Satellite imagery of Chinese crude storage, which uses floating-roof tanks whose inventory levels can be estimated through remote sensing, shows a drawdown of only approximately 40 to 50 million barrels from April 2026 peaks. But China's cumulative import deficit over the crisis period represents roughly 500 million barrels of foregone crude purchases.
The gap between observable crude stock drawdowns and the total import deficit is enormous. The most plausible explanation is large-scale releases of refined product inventories, a category with minimal external visibility. China does not publish official refined product stock data, and port-side observations capture only a fraction of total holdings.
Tanker Market Dynamics and the Binding Constraint Ahead
The Stranded Vessel Surge
At the height of post-ceasefire optimism in late June 2026, Hormuz exit flows peaked at approximately 15 mb/d. This surge was substantially driven by stranded vessels, ships trapped inside the Gulf for four or more months, racing to exit once missile activity paused. An estimated 150 to 160 million barrels of oil had been held aboard vessels inside the Gulf during the closure period. That inventory overhang has now largely cleared.
With stranded vessels now departed, future Hormuz exit volumes must be sustained entirely by fresh loadings from Gulf producers. Fresh loading volumes have declined from a peak of around 10 mb/d back toward 7 mb/d. Hormuz exit flows have correspondingly fallen from the 15 mb/d peak to approximately 7.5 mb/d, and on a nominal daily basis, some readings have fallen back below 5 mb/d, consistent with pre-closure levels.
Why Inbound Tankers Are the Real Bottleneck
The operators most willing to re-enter the Gulf did so immediately following the ceasefire. They were self-selected for risk tolerance. As those operators loaded and departed, the pool of willing inbound tankers has naturally contracted. Re-entering the Gulf now means accepting not only the risk of attack but the risk of being trapped again if hostilities resume.
Very large crude carriers have been trading at rates around $250,000 per day during this period. Being stuck inside Hormuz for four months represents a staggering opportunity cost for vessel owners. The result is a natural ceiling on Gulf loading capacity driven not by crude production limits but by the availability of vessels willing to accept the entry risk. This dynamic creates a structural constraint that will tighten progressively as the most risk-tolerant operators are exhausted.
Time Spread Volatility as a Real-Time Market Signal
Backwardation in oil futures, where spot prices command a premium over forward prices, signals supply tightness. Contango, where forward prices exceed spot, signals oversupply. Over a single month in mid-2026, Brent, WTI, and Dubai crude all cycled from $2 to $3 per barrel backwardation into outright contango and then back to $2 per barrel backwardation. This degree of term structure volatility across all three major crude benchmarks simultaneously has no modern precedent.
Physical market premia confirmed the same signal. Saudi Arabia cut its official selling prices from double-digit premiums to discounts approaching $1.50 below Brent during the oversupply window. Western Canadian Select differentials in Houston moved from a $3 discount to WTI to a $9 discount over the same period, reflecting the pressure of heavy sour crude grades flooding markets while product markets remained structurally short.
The US Strategic Petroleum Reserve: Capacity, Constraints, and Common Misconceptions
What the 252.4 Million Barrel Threshold Actually Means
Current US SPR holdings stand at approximately 320 million barrels. A figure of 252.4 million barrels is frequently cited in public commentary as a hard floor below which the reserve cannot be drawn. This is a mischaracterisation. That threshold is a statutory restriction on non-emergency releases only. It prohibits routine, logistical, or non-crisis drawdowns below that level. It places no constraint on emergency releases, which is the legal basis under which current drawdowns are being conducted.
Common Misconception Corrected: The 252.4 million barrel SPR threshold does not mean the reserve cannot be drawn below that level during an emergency. It restricts only routine, non-emergency releases. In the context of the current crisis, this statutory limit is effectively irrelevant.
The EIA's own published forecast projects SPR levels falling to approximately 282 million barrels by year-end 2026, itself below thresholds that some analysts have incorrectly cited as hard floors. The US Department of Energy's published plans implicitly confirm that drawdowns well below 300 million barrels are operationally feasible.
Salt Cavern Mechanics and the Real Constraint
US SPR oil is stored in dissolved salt caverns, not above-ground tanks. Extraction works by injecting high-salinity brine to displace oil upward, where it can be pumped out through surface infrastructure. The key technical constraint is not a minimum oil level but the number of draw-and-refill cycles a cavern can sustain before its walls degrade materially. Repeated cycling dissolves more of the salt structure than maintaining a stable inventory level.
From a current level of approximately 320 million barrels, a realistic crisis drawdown could extract around 300 million barrels without causing irreversible cavern damage. The logic of withholding SPR releases to preserve cavern integrity for a future crisis is self-defeating when the current situation represents one of the most severe energy supply disruptions in modern history.
Commercial vs. Strategic Stocks: A Critical Distinction
| Category | Mechanism | Current Status |
|---|---|---|
| Commercial Stocks | Market-driven; fill during contango, draw during backwardation | At multi-decade seasonal lows across most products |
| Strategic Reserves (SPR) | Policy-driven; fill and draw only by government directive | Drawing at approximately 5 million barrels per week |
| Cushing Hub (WTI pricing point) | Pipeline crossroads inventory | Fell below 20 million barrels, the operational minimum threshold |
An SPR release is not an inventory drawdown in the conventional market sense. It is a supply injection. Conventional inventory models that regress price against stock levels do not apply to strategic reserves, because SPR levels reflect discretionary policy choices rather than market residuals. When Cushing fell below operational minimums, the effect was not an immediate price spike to extreme levels. Instead, it changed regional price differentials, redirecting US crude away from export markets and back into domestic consumption, effectively turning off the export signal that had been partially compensating for Hormuz supply losses elsewhere.
The next major ASX story will hit our subscribers first
Deficit Arithmetic: How Long Can Compensating Mechanisms Hold?
Even with every available offset operating simultaneously, the global supply balance remains in deficit. The approximate contributions are as follows:
- Middle East net loadings remain approximately 10 mb/d below pre-war levels
- China demand offset: approximately 5 mb/d reduction in import demand
- US SPR releases: approximately 1 to 1.5 mb/d contribution
- IEA member SPR releases, Japanese SPR, oil-on-water drawdowns: partial additional offsets
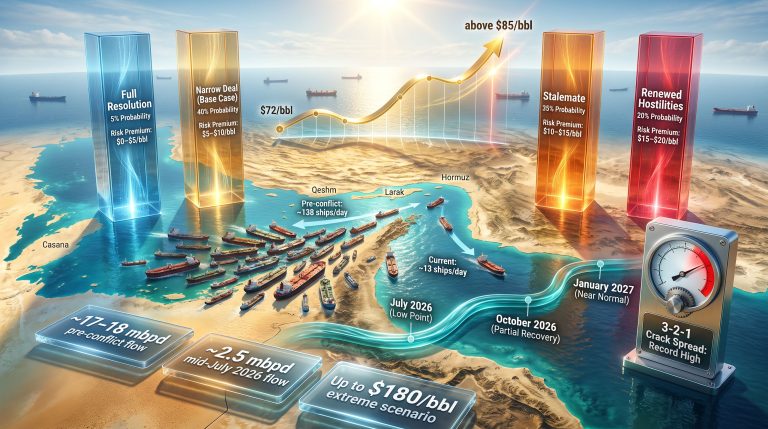
The net result is an estimated 2 mb/d persistent global supply deficit, even with every compensating mechanism running at maximum capacity. At sub-5 mb/d Hormuz exit flows sustained over weeks, serious supply stress is projected to emerge by September 2026. If China re-enters crude import markets at scale while Hormuz disruption persists, the deficit could widen to 8 to 10 mb/d, recreating conditions capable of driving crude toward $150 to $200 per barrel.
| Scenario | Hormuz Flow | China Imports | Estimated Deficit | Price Implication |
|---|---|---|---|---|
| Base Case (Current) | ~7.5 mb/d | Still suppressed | ~2 mb/d | Elevated but contained |
| Stress Case | Below 5 mb/d | Partial recovery | ~5 to 6 mb/d | Significant price spike |
| Severe Case | Below 3 mb/d | Full recovery | ~8 to 10 mb/d | $150 to 200+ crude; approximately $280 diesel equivalent |
Disclaimer: The above scenarios represent analytical projections based on current market dynamics and are not investment advice. Energy market outcomes are subject to rapid change and significant uncertainty.
Who Bears the Burden: Price Crisis vs. Supply Crisis
The Geography of Energy Pain
The distributional consequences of this crisis follow the contours of wealth. Advanced economies with domestic refining capacity, primarily the United States, Canada, and parts of Europe, will likely experience severe price pain but avoid physical shortages. High prices function as a demand rationing mechanism. Painful, but effective at preventing complete supply failure.
Nations across the Global South lack the financial capacity to outbid wealthier importers for scarce cargoes. The result is not price pain but physical shortage. Ethiopia has seen its daily diesel supply fall from approximately 9.2 million to 4.5 million litres, a reduction of roughly half. Monitoring current crude oil prices reveals how these headline figures translate into acute scarcity for import-dependent economies with limited purchasing power. In Australia, around 410 service stations have reported running dry, reflecting the Australia-specific fuel vulnerability that analysts have flagged as a structural weakness for some time.
A regional snapshot of diesel supply disruption:
| Region | Key Impact | Scale of Disruption |
|---|---|---|
| United States | Diesel peaked above $5.80 per gallon; 30-year seasonal low inventories | Severe |
| Europe | Scarcity pricing; risk of localised shortages | High |
| Asia | Diesel exports collapsed to approximately 2.2 mb/d; gasoil prices up roughly 55% | Extreme |
| Australia | Approximately 410 service stations reported running dry | Significant |
| Ethiopia | Daily supply halved from 9.2 million to 4.5 million litres | Critical |
| China | Peak price increase of approximately 30% in major metros; managed via stock releases | Contained |
If the United States restricts refined product exports, a scenario under active discussion, it would protect domestic supply while accelerating shortages in import-dependent developing nations, raising significant humanitarian and geopolitical concerns that extend well beyond energy market mechanics.
Drone Warfare and the New Vulnerability of Fixed Energy Infrastructure
Why Large Physical Assets Are Now Strategic Liabilities
The Ukraine-Russia conflict has demonstrated in real time something that energy market analysts had theorised but never observed at this scale: large, fixed energy infrastructure assets are acutely vulnerable to precision strike capabilities at ranges previously considered implausible for attritional warfare. A refinery processing over 400,000 barrels per day was struck in deep Siberia, more than 2,700 kilometres from the Ukrainian front. That single facility represents approximately 0.4% of total global refining supply.
Refineries are particularly attractive targets. They are large and immovable. They process highly flammable materials under significant pressure. They are expensive and slow to rebuild. And they represent a single point of failure in the conversion chain between crude oil and usable fuel. Striking a refinery does not just reduce supply. It creates a product-specific supply hole that cannot be filled by rerouting crude.
The broader historical pattern here has strategic significance beyond energy markets. Military history follows cycles between offensive and defensive technological advantage. Castle fortifications once made sieges prohibitively expensive. Cannons made those same walls obsolete. Trench warfare defined World War One. Blitzkrieg reversed that calculus in World War Two. Nuclear deterrence created a decades-long stalemate through mutually assured destruction. Drone technology represents the current inflection point, one where the offensive advantage is pronounced and the defensive countermeasures remain immature.
The Investment Implication of Infrastructure Vulnerability
This technological context has practical implications for energy investment. Refining assets located outside the current reach of adversarial drone campaigns, primarily in North America, represent a relative strategic advantage. Every refinery outside China, Russia, and the Gulf is currently running at maximum physical capacity. Deferred maintenance across the sector creates additional upside risk to product markets if unplanned outages emerge.
The structural case for tighter refining margins going forward rests on a simple observation: even if crude oil moves back into surplus in 2027, as crude market dynamics and current non-crisis production trajectory data suggest is plausible, refined product markets may remain structurally tight. Russian refining capacity will not return to pre-war levels quickly. The Moscow refinery struck earlier in the conflict is offline until at least next year at minimum. Gulf refining infrastructure requires significant reconstruction. And China's willingness to re-open its refined product export tap remains uncertain.
This article is for informational purposes only and does not constitute financial or investment advice. All projections and scenario analyses involve significant uncertainty. Readers should conduct independent research and consult a licensed financial adviser before making any investment decisions.
Want to Stay Ahead of the Next Major Commodity Market Shift?
When energy disruptions ripple into mining and resources sectors, timing becomes everything — Discovery Alert's proprietary Discovery IQ model scans ASX announcements in real time, delivering instant alerts on significant mineral discoveries before the broader market catches on. Explore how historic discoveries have translated into extraordinary returns and begin your 14-day free trial today to position yourself ahead of the next major market move.