July 17, 2026
The Strait of Hormuz as a Pricing Mechanism: Understanding Geopolitical Risk in Oil Markets
Few concepts in commodity markets are as misunderstood as geopolitical risk pricing. Most casual observers assume that oil prices move in response to actual supply disruptions. In reality, prices often reprice before physical barrels are ever affected, driven by probability-weighted expectations of future supply states rather than confirmed present-day shortfalls. This distinction matters enormously when interpreting what has happened to Brent crude in July 2026, and what the Rystad U.S.-Iran oil scenarios framework is actually telling markets about the months ahead.
The Strait of Hormuz is not merely a shipping lane. It is, in functional terms, the world's most consequential oil pricing variable. Approximately 17 to 18 million barrels per day of crude oil and petroleum products transited the strait under pre-conflict conditions, representing roughly 20% of global oil consumption. No alternative route can absorb that volume without significant cost, delay, and logistical friction. When the strait is threatened, global oil markets do not wait for confirmation of supply loss. They price the probability distribution of future disruption immediately.
That mechanism, rapid and non-linear repricing driven by expectation rather than realised shortage, is precisely what unfolded in the opening weeks of July 2026.
When big ASX news breaks, our subscribers know first
How the Strait of Hormuz Transmits Risk to Global Oil Prices
The Anatomy of a Supply Shock
A Hormuz disruption does not travel through global energy markets as a simple volume subtraction. It cascades through multiple layers simultaneously. Furthermore, the geopolitical oil market dynamics at play here are far more complex than standard supply-demand models suggest:
- Physical throughput collapses as commercial operators re-route or suspend transit
- Insurance premiums spike for vessels operating in the region, adding a secondary cost layer entirely separate from crude pricing
- Refinery feedstock availability tightens in downstream markets dependent on Middle Eastern crude grades
- Strategic reserve deployment decisions accelerate in consumer nations, introducing a competing supply source
- Demand compression begins, particularly in price-sensitive Asian markets, partially absorbing the shock
Each of these transmission channels operates at a different speed. Physical rerouting takes days to weeks. Insurance repricing happens within hours. Demand compression in Asia unfolds over weeks as import decisions adjust. Strategic reserve deployment requires political decisions that introduce their own uncertainty. The result is a market that simultaneously prices multiple dynamics across different time horizons, often producing apparently contradictory signals in spot versus futures curves.
From $70 to $85 Per Barrel in Weeks
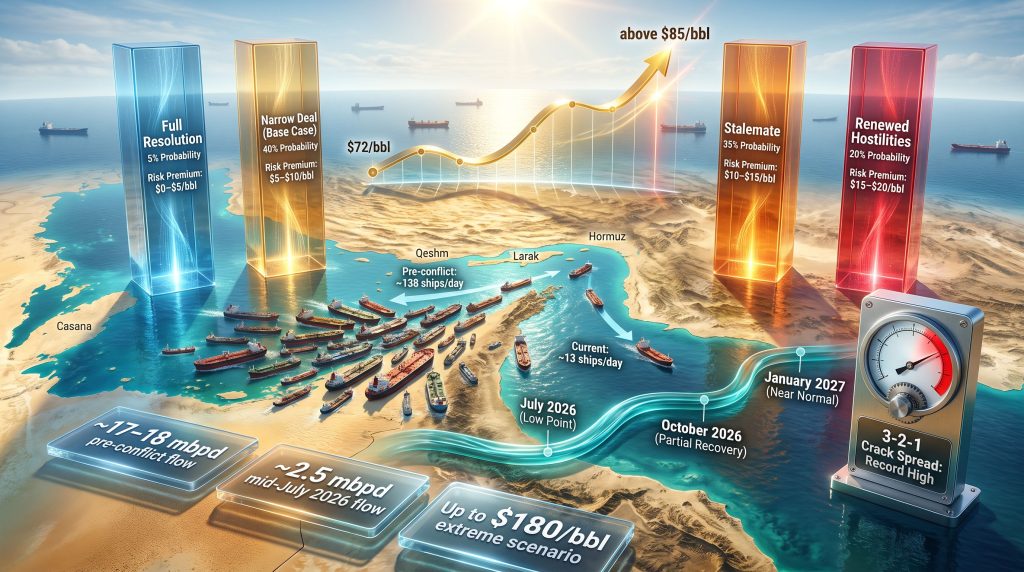
The speed of the recent repricing illustrates this mechanism precisely. Brent crude traded at approximately $70 per barrel in early July 2026 before climbing sharply to above $85 per barrel within weeks. This 21% move was not driven by a confirmed aggregate supply shortfall in global inventories. It was driven by the resumption of maritime attacks and Washington's reimposition of a naval blockade on Iranian ports, two events that altered the probability distribution of future supply states without immediately removing barrels from the market.
| Metric | Pre-Conflict Normal | Early July 2026 | Mid-July 2026 |
|---|---|---|---|
| Daily ship transits through Hormuz | ~138 ships/day | ~29 ships/day | ~13 ships/day |
| Brent crude price | Below $72/bbl | ~$70/bbl | ~$85/bbl |
| Strait oil throughput | ~17-18 mbpd | Severely curtailed | ~2.5 mbpd estimated |
The collapse in daily transit counts is among the most striking data points available. The drop from 138 vessels per day under pre-war conditions to 13 per day in mid-July 2026 represents a reduction of more than 90%. That is not a gradual tightening. It is a near-complete functional shutdown of the world's most critical oil transit corridor.
HSBC analysts, including Chief Economist Paul Bloxham, noted in a research note published in July 2026 that a return to the pre-war transit normal appears unlikely, even under positive diplomatic outcomes. This framing is analytically important: market participants should not model recovery as a full restoration to prior baselines.
What the Rystad U.S.-Iran Scenario Framework Actually Measures
Building Probabilistic Models Around Geopolitical Events
Probabilistic scenario modelling is standard practice among major energy research houses, but the Rystad U.S.-Iran oil scenarios framework carries particular analytical weight because it explicitly quantifies the geopolitical risk premium embedded in crude prices under each pathway. Rather than simply describing possible diplomatic outcomes, the framework assigns probability weights and maps each scenario to a specific risk premium range, enabling a probability-weighted estimate of the total geopolitical premium currently in the price.
This approach is more rigorous than simple scenario description because it allows analysts to detect when the aggregate risk premium is rising or falling independent of which specific scenario is evolving. Even if the base case remains unchanged at 40% probability, a shift in probability mass from the full resolution scenario (5%) to the renewed hostilities scenario (20%) increases the probability-weighted premium materially. Consequently, understanding OPEC market influence alongside these scenario probabilities provides a more complete picture of global supply dynamics.
The August 16 MoU Expiry: Why This Date Functions as a Market Catalyst
Rystad's revised scenario analysis pivots around a single structural event: the expiry of a 60-day Memorandum of Understanding negotiation window on August 16, 2026. This date functions not merely as a diplomatic deadline but as a market pricing catalyst. Before August 16, the analytical variables are operational in nature:
- Intensity and frequency of maritime and military attacks
- Degree to which the U.S. naval blockade is actively enforced
- Actual Iranian crude export volumes reaching global markets
- Speed of commercial shipping traffic recovery through the strait
After August 16, the analytical frame shifts entirely. The question becomes whether any diplomatic arrangement, however narrow, holds over a multi-month horizon, and how far shipping market participants can adapt their operational models to a persistently threatening environment. This temporal pivot is crucial for understanding how risk pricing will evolve through the second half of 2026.
Breaking Down the Four Rystad U.S.-Iran Oil Scenarios
Probability and Risk Premium: A Comparative Overview
| Scenario | Assigned Probability | Geopolitical Risk Premium | Strait Traffic Outlook (Nov 2026) |
|---|---|---|---|
| Full Resolution | 5% | $0-$2/bbl residual | ~14 mbpd (full recovery) |
| Narrow Deal (Base Case) | 40% | $5-$10/bbl | ~14 mbpd by October |
| Stalemate | 35% | $10-$15/bbl | ~8 mbpd |
| Renewed Hostilities | 20% | $15-$20/bbl | ~3.5 mbpd |
A critical observation emerges immediately from this table: the combined probability of the two highest-risk scenarios is 55%, which now exceeds the probability assigned to the two lower-risk scenarios combined at 45%. This inversion of the probability distribution relative to mid-June 2026, when the MoU appeared stable, is the single most important analytical development in the Rystad framework update.
Scenario 1: Full Resolution and the $0-$2 Residual Premium
A comprehensive diplomatic settlement that addressed both Iran's nuclear programme and the question of sovereign control over commercial passage through Hormuz would, in theory, eliminate the acute geopolitical premium entirely. Rystad assigns this outcome only a 5% probability, reflecting the structural difficulty of resolving two simultaneously contentious and politically sensitive issues under a compressed diplomatic timeline.
Under full resolution, Strait throughput could recover toward approximately 14 million barrels per day by January 2027, and Iranian production capacity could expand gradually from around 3.2 to 3.6 million barrels per day over subsequent months. The structural price implication would be a downside of approximately $5 per barrel relative to current levels as geopolitical premium deflates toward a residual $0 to $2 range reflecting only background uncertainty.
The low probability assigned to this scenario reflects a well-established pattern in Middle Eastern diplomatic history: comprehensive agreements that require both parties to make core concessions simultaneously are extraordinarily difficult to achieve under time pressure.
Scenario 2: The Narrow Deal at 40% Probability
Rystad's base case involves a limited, face-saving arrangement that provides Iran with economic relief and the United States with a demonstrable diplomatic outcome, without requiring either party to resolve the underlying nuclear dispute or the question of commercial passage control through Hormuz.
The political logic is straightforward. Washington faces domestic pressure to reduce oil prices before November midterm elections and to demonstrate diplomatic competence. Tehran holds access to a substantial economic package under the 14-point MoU framework, which reportedly includes phased access to frozen assets, oil export waivers, and a pathway toward broader sanctions relief over time.
A narrow deal allows Iran to access meaningful economic benefits without making permanent concessions on its most strategically valuable leverage points. However, the oil market trade war context surrounding these negotiations adds further complexity to an already delicate diplomatic environment.
The narrow deal's political viability rests precisely on what it does not require either side to formally concede. This asymmetry between economic benefit and strategic concession is what keeps the base case alive despite the MoU's failure to progress on its most difficult elements.
Under this scenario, Rystad projects the following traffic and price trajectory:
- Maritime attack intensity declines in the near term following a diplomatic signal
- An interim agreement is reached by or around August 16, 2026
- The U.S. blockade is gradually relaxed rather than strictly enforced
- Strait throughput reaches approximately 10 million barrels per day by mid-August, rising to approximately 14 million barrels per day by October
- A geopolitical risk premium of $5 to $10 per barrel persists, reflecting the deferral of the nuclear question
However, Rystad's senior geopolitical analysis team has noted publicly that the base case has become materially less comfortable than it appeared in June 2026. The MoU has not produced meaningful progress on its two structurally hardest elements: nuclear restrictions and control over commercial passage through Hormuz. With the combined probability of no substantive agreement now at 55%, the probability-weighted risk premium in oil prices is considerably higher than it was when the MoU initially appeared to be holding.
Scenario 3: Stalemate and the Emergence of Adaptive Market Mechanisms
The stalemate scenario, carrying a 35% probability, represents a deeply underappreciated dynamic in geopolitical risk analysis. A stalemate does not mean zero traffic through the Strait of Hormuz indefinitely. It means that over time, the market develops workarounds. Shipowners, underwriters, governments, and commodity traders gradually adapt through a combination of mechanisms:
- Selective enforcement by U.S. naval forces that distinguishes between strategic targets and commercially neutral vessels
- Bilateral passage assurances negotiated between individual flag states and regional parties
- Carefully coordinated convoy systems that reduce individual vessel exposure
- Premium-pricing of passage risk into freight rates and insurance policies, making the cost explicit rather than prohibitive
| Timeframe | Estimated Strait Throughput | Bypass Route Volume |
|---|---|---|
| August 2026 | ~2.5 mbpd | Remainder via alternatives |
| November 2026 | ~8 mbpd | ~7 mbpd via bypass routes |
| Ongoing | Stabilised at partial capacity | Persistent dual-routing |
The structural oil market implications of a prolonged stalemate extend well beyond crude prices. Sanctions remain in place with only ad hoc waivers. A persistent $10 to $15 per barrel risk premium becomes embedded in prices. Shipping insurance costs remain structurally elevated, adding a secondary logistics cost that is not fully captured in crude benchmarks. Diesel crack spreads and refined product markets face continued tightness as Middle Eastern feedstock availability remains constrained. This is not a comfortable equilibrium. It is simply a more bearable form of disruption.
Scenario 4: Renewed Hostilities and the Tail Risk Premium
The renewed fighting scenario now carries a 20% probability, elevated from earlier estimates, reflecting how rapidly a fragile diplomatic framework can unravel through miscalculation. This pathway involves sustained escalation, direct broadening of U.S.-Iran military activity, and materially increased regional spillover risks to Gulf energy infrastructure.
Even under this scenario, Strait throughput is not completely static. Dark fleet movements, selective passage for vessels linked to geopolitically neutral states, and temporary periods of reduced military intensity could push throughput toward approximately 3.5 million barrels per day by November 2026. According to Rystad Energy's analysis, a full re-escalation could drive Brent crude to as high as $180 per barrel by August.
| Price Scenario | Condition | Brent Crude Estimate |
|---|---|---|
| Base bull case | Hostilities resume, partial blockade | $140-$150/bbl |
| Extreme scenario | Full Strait blockade sustained | Up to $180/bbl |
| Macro tail risk | Full-scale war, demand destruction | Potentially above $200/bbl |
Important Disclaimer: Extreme price scenario estimates involve significant uncertainty and depend on assumptions about demand destruction, strategic reserve capacity, and geopolitical escalation trajectories that are inherently difficult to model. These figures represent analytical tail risks, not base case projections.
A full-scale conflict scenario would carry macroeconomic consequences analogous in severity to the 2008 global financial crisis, driven by the simultaneous interaction of a supply shock and demand destruction dynamics that compound rather than offset each other.
Beyond Crude: What Refined Product Markets Are Signalling
Why Diesel Crack Spreads Are at Record Levels
One of the most analytically important, and widely underappreciated, signals in the current market environment is the divergence between crude oil price behaviour and refined product market dynamics. While crude prices have shown some relief around diplomatic signals, diesel markets have not followed.
The 3-2-1 crack spread, a widely monitored measure of refining profitability that tracks the margin between crude oil input costs and the value of gasoline and diesel outputs, recently surged to its highest recorded level. The spread between U.S. diesel and WTI crude has exceeded the elevated levels observed during the acute phase of the Russia-Ukraine war. HSBC analysts highlighted this divergence in a July 2026 research note, describing it as a signal of acute market tightness in refined product supply rather than crude oil supply per se.
This distinction matters because it reveals a structural gap in global refining capacity. With Middle Eastern refinery output constrained and global refining systems operating without meaningful slack, downstream markets are absorbing supply shocks that upstream crude price movements do not fully reflect.
The Cascade Effect Across Energy-Adjacent Commodities
The disruption is not confined to crude oil and diesel. HSBC analysts noted in July 2026 that a cascade of energy-adjacent commodity markets is experiencing simultaneous tightening:
- Jet fuel: Prices have resumed an upward trajectory following a brief period of stabilisation linked to early MoU optimism
- Sulphur: Prices remain near record-high levels, reflecting disruptions to Middle Eastern refinery output and reduced by-product availability
- Helium: Market tightening is underway, with supply chain implications for technology and industrial applications
- Diesel: Crack spreads remain structurally elevated even as crude prices show partial relief
HSBC analysts also noted that part of the recent diesel market tightening reflects dynamics linked to the ongoing Russia-Ukraine war, adding a second, independent source of refined product market stress that compounds rather than substitutes for the Hormuz disruption.
Supply Recovery Follows an S-Curve, Not a Snapback
Why Physical Volumes Recover More Slowly Than Prices Suggest
A persistent cognitive error in energy market analysis is the assumption that physical oil supply recovers as rapidly as prices fall following a diplomatic signal. In practice, supply restoration follows an S-curve trajectory: slow initial recovery as operators cautiously test the security environment, accelerating volume return through the middle period as confidence builds, and then a plateau as remaining logistical and infrastructure constraints bind.
| Recovery Phase | Timeframe | Volume Restored |
|---|---|---|
| Initial recovery | July 2026 | 10-15% of shut-in volumes |
| Meaningful volume return | By mid-2026 | 80-90% of pre-disruption levels |
| Port arrival lag | Ongoing | 4-6 weeks behind flow recovery |
| Near-full restoration | October 2026 | ~85% of lost volumes |
| Complete recovery | January 2027 | Remaining 15% restored |
| Cumulative supply loss | Year-end 2026 | Nearly 2 billion barrels (base case) |
Two structural factors have prevented prices from reaching the extreme levels feared at the onset of the disruption. First, U.S. strategic petroleum reserve releases have enabled approximately 3 million barrels per day in additional U.S. export capacity since February 2026. Second, China has reduced crude imports by approximately 4 million barrels per day, absorbing a significant portion of the supply shock through demand-side compression rather than price escalation alone.
HSBC analysts noted that while crude inventories have declined, their oil and gas research team views a full inventory drawdown to tank-bottom levels as many months away, providing a buffer against the most extreme near-term price scenarios.
The next major ASX story will hit our subscribers first
Rystad Oil Price Projections Across the Scenario Spectrum
Bear, Base, and Bull Cases for 2026 to 2028
| Scenario | 2026 Average Brent | 2027 Projection | 2028 Projection |
|---|---|---|---|
| De-escalation / Full Resolution | $70-$80/bbl | Below $75/bbl | Normalising |
| Narrow Deal (Base Case) | ~$102/bbl | ~$80/bbl | ~$70/bbl |
| Stalemate | $100-$115/bbl | Elevated | Gradual decline |
| Renewed Hostilities | $140-$150/bbl | Highly uncertain | Highly uncertain |
| Full Strait Blockade | Up to $180/bbl | Not modelled | Not modelled |
Important Disclaimer: All price projections represent analytical scenario estimates produced under specific geopolitical and market assumptions. Actual outcomes will depend on diplomatic developments, military activity, demand dynamics, and policy responses that cannot be reliably predicted. These figures should not be interpreted as investment advice or guarantees of future market conditions.
Three Strategic Lenses for Reading the Rystad Framework
How Energy Market Participants Should Interpret Probability Shifts
Understanding the Rystad U.S.-Iran oil scenarios framework as an ongoing signal, rather than a static forecast, requires three analytical lenses. In addition, tracking oil price volatility trends alongside these scenario shifts provides valuable context for interpreting market movements:
- Probability distribution shifts carry more information than individual scenario outcomes. The movement of probability mass from low-risk to high-risk scenarios is itself a market signal. When the combined probability of stalemate and renewed hostilities rises from below 50% to 55%, that shift is analytically significant even if no scenario changes its fundamental character.
- The August 16 date functions as a market repricing catalyst. Regardless of the specific diplomatic outcome, the expiry of the MoU window forces a recalibration of uncertainty. Markets cannot sustain existing probability distributions indefinitely when a structural decision point is approaching.
- Downstream product markets are leading indicators of upstream crude market stress. When diesel crack spreads exceed Russia-Ukraine war peaks and sulphur prices sit near record levels, refined product markets are telling a different and more severe story than crude benchmarks alone.
Key Indicators to Monitor Through August 2026
- Daily ship transit counts through the Strait of Hormuz, with a current baseline of approximately 13 per day versus a pre-war normal of approximately 138 per day
- Iranian crude export volumes as a proxy for de facto sanctions enforcement intensity
- U.S. strategic petroleum reserve inventory levels and the pace of drawdown
- Diesel and jet fuel crack spread movements as refined product market stress indicators
- Any formal diplomatic communication between U.S. and Iranian negotiating parties ahead of August 16
- Shipping insurance premium trends in the Arabian Gulf as a real-time market confidence signal
The Rystad U.S.-Iran oil scenarios framework is ultimately a tool for understanding how much geopolitical uncertainty is currently embedded in the price of oil, and how that uncertainty is likely to evolve across a defined set of pathways. Furthermore, the crude oil trade geopolitics surrounding this conflict illustrate just how interconnected diplomatic and energy market outcomes have become. According to Rystad Energy's five-scenario analysis, in a market where the combined probability of no meaningful diplomatic resolution now exceeds 50%, the embedded risk premium is not a distortion to be dismissed. It is the price of navigating one of the most consequential geopolitical fault lines in global energy markets.
Want to Stay Ahead of the Next Major Commodity Market Shift?
Discovery Alert's proprietary Discovery IQ model scans ASX announcements in real time, instantly identifying significant mineral discoveries across over 30 commodities — turning complex market data into clear, actionable investment insights for traders and long-term investors alike. Explore how historic mineral discoveries have generated extraordinary returns and begin your 14-day free trial today to secure a market-leading edge before the broader market catches on.