May 13, 2026
When the World's Reserve Currency Falters, History Shows Only Two Assets Benefit
Every monetary system in recorded history has eventually been replaced by another. Not reformed, not adjusted at the margins, but fundamentally restructured. The transitions between systems have rarely been orderly, and the investors who fared best were almost never the ones who waited for official confirmation before acting. Understanding what happens to gold and silver when the dollar loses its reserve status requires looking backward before looking forward, because the mechanism is not new, and the playbook has not changed.
When big ASX news breaks, our subscribers know first
The Dollar's Reserve Role Is Eroding on a Measurable Trajectory
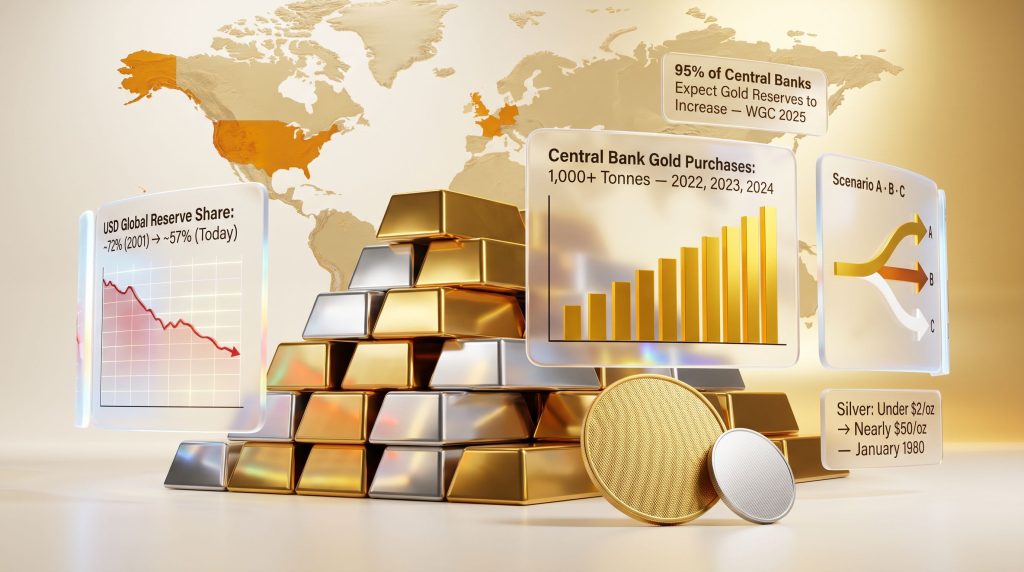
The scale of the dollar's current dominance obscures how far it has already declined. According to IMF COFER data, the dollar accounted for approximately 72% of global foreign exchange reserves in 2001. By 2025, that figure had declined to roughly 57% — a contraction of 15 percentage points across two decades, representing the most sustained period of reserve share erosion since sterling's post-war collapse. The euro, the closest rival currency, holds approximately 20% of global reserves, meaning the displaced dollar share has not migrated cleanly into any single alternative.
This distinction matters enormously. When no successor absorbs the vacated share, the displacement flows instead into a fragmented basket of currencies, special drawing rights, and hard assets. That fragmentation is not random — it is structurally significant for understanding what happens to gold and silver when the dollar loses its reserve status.
The Four Monetary Systems of the Past Century
To frame where we are, it helps to situate the current system within its historical context:
| Monetary Era | Approximate Period | Anchor Mechanism | Transition Trigger |
|---|---|---|---|
| Gold Standard | Pre-1922 | Physical gold convertibility | WWI fiscal pressures |
| Genoa Conference System | 1922–1944 | Gold plus sterling/dollar co-anchors | Great Depression instability |
| Bretton Woods | 1944–1971 | USD pegged to gold at $35/oz | Nixon closes gold window |
| Petrodollar / Fiat Standard | 1971–present | USD backed by government promise only | Ongoing structural erosion |
History suggests these systems cycle approximately every 30 to 40 years. The current dollar-fiat standard is now well past that historical threshold. The Federal Reserve's own analysis of the dollar's international role identifies persistent fiscal deficits, rising competition from alternative reserve assets, and deliberate central bank diversification as structural rather than cyclical pressures on dollar demand. Furthermore, the global monetary role of gold has grown considerably more prominent as these pressures intensify.
Cyclical Weakness vs. Structural Decline: Why the Difference Is Critical
A cyclical dollar decline reverses within a business cycle, typically driven by relative interest rate movements or temporary risk-off capital flows. Structural erosion, by contrast, reflects permanent shifts in economic productivity, institutional trust, and geopolitical positioning. The current trajectory exhibits characteristics of the latter: the decline has persisted across multiple U.S. administrations, multiple Federal Reserve interest rate cycles, and multiple global economic regimes without meaningful reversal of the underlying trend.
Sterling's Fall Provides the Forensic Blueprint
The British pound's displacement from reserve currency dominance represents the most thoroughly documented monetary transition of the modern era, and it carries direct lessons for investors asking what happens to gold and silver when the dollar loses its reserve status.
At the close of World War II in 1945, sterling represented approximately 81% of global foreign exchange reserves, according to IMF historical records and Cambridge Economic History research. By 1950, just five years later, that share had contracted to roughly 58% — a 23-percentage-point decline in a single half-decade. The subsequent erosion unfolded more gradually but relentlessly over the following three decades.
The key milestones of sterling's decline illustrate the pattern:
- 1967: The Bank of England announced a 14% devaluation against the U.S. dollar, reducing sterling's gold parity from £1 = $2.80 to £1 = $2.40
- 1976: Sterling had depreciated to approximately £1 = $1.97, representing a further 18% decline from the post-devaluation level
- 1976: The International Monetary Fund provided an emergency credit facility of approximately $3.9 billion to stabilise British finances, marking the moment a former global hegemon required external rescue
- 1985: Sterling's share of global reserves had declined to below 3%, where it has since remained
For investors holding pound-denominated assets across this period, the destruction of real wealth was substantial. Cumulative inflation exceeding 250% over the 31-year transition period, compounded by currency devaluation and interest rates that repeatedly failed to exceed inflation, produced deeply negative real returns for those who held sterling through the entire cycle.
Why the Current Transition Is Structurally Different
The sterling-to-dollar transition involved moving between two currencies, each with at least partial backing by hard assets. Bretton Woods maintained gold convertibility at $35 per ounce until 1971. The current environment involves something with no historical precedent: a transition away from a fully fiat system without an obvious fiat successor capable of absorbing the displaced reserve function.
Consider the structural barriers facing the most frequently cited alternative:
- The Chinese yuan currently represents approximately 2% of global foreign exchange reserves according to IMF COFER data
- Yuan-denominated bond markets lack the depth and liquidity required for large-scale reserve absorption
- Capital account convertibility restrictions limit institutional access
- Geopolitical neutrality concerns reduce appeal as a universally accepted reserve asset
No single currency possesses the combination of liquidity depth, institutional infrastructure, and geopolitical credibility required to unilaterally absorb dollar displacement. That gap is where gold enters the picture not as a speculative asset, but as a structurally neutral monetary anchor. According to US News, de-dollarisation could accelerate this dynamic considerably, further reinforcing the case for hard assets.
Three Transition Pathways and Their Implications
Rather than predicting a single outcome, scenario analysis provides a more useful framework:
Scenario A: Gradual Multipolar Erosion (Most Probable)
Dollar reserve share continues declining toward 40 to 45% over 10 to 15 years. Reserve diversification accelerates into gold, the euro, the yuan, and SDR-type instruments simultaneously. Gold price appreciation is sustained but non-parabolic, offering steady accumulation opportunities.
Scenario B: Accelerated Institutional Pivot (Moderate Probability)
A geopolitical shock or sovereign debt event triggers rapid central bank reallocation within a 3 to 5 year window. Dollar share contracts sharply. Gold experiences a significant repricing event, with silver following at amplified percentage gains as monetary and industrial demand converge simultaneously.
Scenario C: Emergency Monetary Summit (Lower Probability, Highest Impact)
A formal multilateral agreement restructures the global reserve architecture. Gold is assigned an explicit anchor role in the new framework. Price implications approach extreme institutional revaluation models, discussed below.
Gold's Two-Layer Response Mechanism
Gold's response to dollar reserve erosion operates through two distinct but reinforcing mechanisms. Understanding both is essential to forming a durable view on what happens to gold and silver when the dollar loses its reserve status.
Mechanism One: Dollar-Denominated Pricing
Because gold is globally priced in U.S. dollars, any sustained depreciation of the dollar mechanically increases gold's nominal price for buyers transacting in all other currencies. This creates self-reinforcing demand dynamics: as the dollar weakens, gold becomes more affordable in local currency terms for foreign buyers, stimulating additional purchasing that further supports the price. This mechanism is well-documented and operates regardless of investor sentiment or geopolitical conditions.
Mechanism Two: Monetary Anchor Repositioning
The deeper and more powerful mechanism operates at the level of institutional confidence. Gold is the only widely recognised monetary asset that carries no counterparty liability. No government issues it, no central bank can produce it through policy intervention, and no sovereign can default on it. When confidence in government-backed currencies erodes broadly, capital migrates toward assets that satisfy three criteria simultaneously: finite supply, zero counterparty liability, and universal recognition across sovereign borders.
Central bank gold reserves provide the most credible institutional signal available. According to World Gold Council data, central banks globally purchased more than 1,000 tonnes of gold in each of 2022, 2023, and 2024, representing approximately double the acquisition pace of the prior decade. The World Gold Council's Central Bank Gold Reserves Survey 2025 found that 95% of central banks surveyed expected global official gold reserves to increase further over the following 12 months, with none planning reductions. These institutions are not accumulating gold as a short-term trading position. They are rebuilding hard-asset reserves as a structural hedge against the fiat system they themselves operate within.
What Institutional Revaluation Models Suggest
One institutional modelling framework, developed by VanEck, approaches gold valuation by aligning central bank M0 monetary liabilities against hard reserve assets. Under a scenario in which gold absorbs the dollar's reserve function, this framework implies a theoretical gold price range of $39,000 to $184,000 per ounce, with a baseline figure of approximately $39,210 per ounce derived from major central bank data weighted by foreign exchange turnover share.
Critical Disclaimer: These figures represent scenario modelling outputs under extreme assumptions, not base-case forecasts or investment recommendations. They are presented as analytical context for understanding the theoretical upper bounds of gold's repricing potential under structural reserve transition scenarios. All investment decisions should be made in consultation with a qualified financial adviser.
Silver's Asymmetric Return Profile Within the Same Thesis
Silver occupies a unique position in this analysis. It shares gold's monetary heritage and benefits from the same reserve transition dynamics, but its return profile is materially different in both direction and magnitude. In addition, silver's dual-demand profile — spanning both monetary and industrial applications — means it responds to a wider set of economic catalysts than gold alone.
The Historical Pattern From the Last Major Fiat Stress Cycle
During the stagflation era of the 1970s, the last period of comparable simultaneous dollar weakness and fiat credibility deterioration, silver appreciated from under $2 per ounce to nearly $50 per ounce by January 1980. This advance represented a percentage gain that materially exceeded gold's performance over the same decade, illustrating silver's characteristic behaviour: underperformance in the early and uncertain phases of a monetary stress cycle, followed by outperformance once the trend becomes established.
This pattern has important implications for timing and positioning. Silver tends to lag gold in the initial recognition phase, then accelerate sharply once institutional and retail capital flows converge.
Silver's Industrial Demand Layer Creates a Second Catalyst
Unlike gold, silver carries significant industrial demand that provides an independent growth driver not available to gold investors:
| Demand Driver | Gold | Silver |
|---|---|---|
| Central bank reserve accumulation | Primary driver | Minimal |
| Safe-haven monetary demand | Primary driver | Secondary driver |
| Industrial and technology demand | Minimal | Significant: solar, EVs, electronics |
| Percentage gain amplification in bull markets | Moderate | High |
| Volatility profile | Lower | Higher (amplified in both directions) |
This dual-demand architecture means silver can respond to two independent sets of catalysts simultaneously. In a period of both monetary stress and accelerating industrial transition, these forces can compound rather than merely coexist. Furthermore, how the U.S. dollar influences precious metals prices helps explain why both metals tend to respond so decisively when fiat confidence deteriorates.
The Gold-to-Silver Ratio as a Positioning Signal
The gold-to-silver ratio measures how many ounces of silver are required to purchase one ounce of gold. Historically, this ratio compresses significantly during established precious metals bull markets, as silver closes the performance gap with gold. Investors who monitor this ratio as a relative value indicator have used elevated readings as a signal to increase silver exposure relative to gold, with the expectation that silver will deliver superior percentage returns once the monetary trend is confirmed.
The Systemic Contagion Dimension Most Investors Underweight
There is a dimension of the reserve currency transition thesis that receives insufficient attention in mainstream financial commentary. A dollar crisis would not unfold as a contained American economic problem. Every other major currency, including the euro, the Japanese yen, the British pound, and the Swiss franc, carries the same fundamental backing as the dollar: a government's promise.
If the world's strongest fiat currency experiences a sustained credibility crisis, the credibility question extends to the entire fiat architecture simultaneously. This dynamic transforms a reserve currency transition from a bilateral currency event into a global monetary confidence crisis. Capital does not disappear in such scenarios.
Historical evidence consistently demonstrates that capital migrating out of depreciating fiat systems flows toward assets with finite supply, zero counterparty liability, and universal recognition. The evidence from every documented monetary stress period confirms this pattern:
| Asset Class | 1970s Dollar Weakness | Post-Bretton Woods Adjustment | 2008 Financial Crisis |
|---|---|---|---|
| Gold | Strong outperformance | Significant repricing upward | Safe-haven demand surge |
| Silver | Extreme outperformance, late cycle | Followed gold with amplification | Initial selloff, then recovery |
| Equities | Stagflation-driven underperformance | Mixed | Severe drawdown |
| Government bonds | Real return erosion via inflation | Yield adjustment period | Temporary flight-to-quality |
| Real estate | Inflation hedge but illiquid | Moderate | Crisis epicentre |
The next major ASX story will hit our subscribers first
Positioning Frameworks for a Pre-Crisis Accumulation Environment
The most consistent finding from documented reserve currency transitions is that positioning decisions made during periods of relative monetary stability deliver materially higher returns than reactive decisions made after a crisis becomes broadly recognised. By the time a reserve currency transition is front-page financial news, the early accumulation phase has concluded and prices already reflect a significant portion of the anticipated repricing.
Physical Bullion vs. Paper Proxies: A Structural Distinction
In a scenario where fiat credibility is the central concern, the counterparty risk embedded in paper gold products becomes directly relevant. Exchange-traded products, futures contracts, and gold-backed certificates all carry exposure to the operational integrity of financial intermediaries. Comparing physical gold vs ETFs reveals why central banks accumulate physical gold rather than financial instruments representing a claim on gold — the distinction is not merely theoretical in a reserve transition context.
Illustrative Portfolio Allocation Ranges
Important Note: The following allocation ranges are drawn from institutional and academic research for illustrative purposes only. They do not constitute personalised financial advice. Individual allocations depend on existing portfolio composition, liquidity requirements, investment horizon, and specific risk scenarios being addressed. Consult a qualified financial adviser before making allocation decisions.
- Conservative monetary hedge: 5 to 10% of portfolio in physical gold and silver
- Moderate reserve transition positioning: 10 to 20% allocation with emphasis on physical metal over paper proxies
- Aggressive de-dollarisation positioning: 20% or above with diversification across gold, silver, and related hard assets
Key Questions Addressed: What Investors Most Want to Know
What does reserve currency status actually mean in practice?
A reserve currency is one that foreign governments, central banks, and international institutions accumulate in large quantities to facilitate global trade settlement, debt repayment, and foreign exchange market intervention. The dollar's current 57% share of global reserves, according to IMF COFER data, creates persistent structural demand that partially insulates the U.S. from some conventional consequences of fiscal expansion. Erosion of this status would reduce that structural demand, placing upward pressure on U.S. borrowing costs and downward pressure on the dollar's purchasing power relative to hard assets.
Why does the yuan represent such a small share of global reserves despite China's economic scale?
The yuan's approximately 2% reserve share reflects structural constraints that economic size alone cannot overcome: limited capital account convertibility prevents free capital flow into and out of yuan-denominated assets; yuan bond markets lack the depth required for large-scale institutional reserve management; and geopolitical considerations reduce the yuan's appeal as a neutral reserve asset for non-aligned nations. Reserve currency status requires not just economic scale but institutional infrastructure, legal transparency, and perceived neutrality that the yuan has not yet established at the required depth.
How did silver's performance during the 1970s differ from gold's, and why?
Silver's advance from under $2 per ounce to nearly $50 by January 1980 exceeded gold's percentage gain over the same decade, but the path was different. Silver lagged gold in the early years of dollar weakness and fiat stress as industrial demand contracted with economic slowdown. Once the monetary thesis became entrenched and investor conviction shifted from tentative to committed, silver's smaller market size and dual industrial-monetary demand base caused it to accelerate more sharply than gold. This pattern — lagging early and leading late — has been observed across multiple precious metals cycles and informs how sophisticated investors time their relative allocation between the two metals.
Does the timing of entry into precious metals matter significantly?
The historical evidence strongly suggests it does. In every documented reserve currency transition, the most significant gains accrued to investors who built positions during the pre-recognition accumulation phase. This is partly mechanical: prices during accumulation phases reflect uncertainty discounts that disappear once the trend becomes consensus. It is also psychological — once a monetary transition achieves mainstream recognition, the capital that would have moved in anticipation has largely already moved, reducing the marginal return available to late entrants.
Summary of the Core Evidence Base
| Data Point | Figure | Source |
|---|---|---|
| Dollar's global reserve share, 2001 | ~72% | IMF COFER |
| Dollar's global reserve share, 2025 | ~57% | IMF COFER |
| Euro's current reserve share | ~20% | IMF COFER |
| Yuan's current reserve share | ~2% | IMF COFER |
| Central bank gold purchases, 2022, 2023, 2024 | 1,000+ tonnes annually | World Gold Council |
| Central banks expecting reserve increases, 2025 survey | 95% | World Gold Council Central Bank Survey 2025 |
| Sterling's reserve share, 1945 | ~81% | IMF / Cambridge Economic History |
| Sterling's reserve share, 1950 | ~58% | IMF / Cambridge Economic History |
| Sterling devaluation, 1967 | 14% | Historical monetary record |
| Silver price range, early 1970s to January 1980 | Under $2 to ~$50/oz | Historical price data |
| VanEck institutional gold revaluation range | $39,000 to $184,000/oz | VanEck scenario modelling |
Investment Disclaimer: This article is intended for educational and informational purposes only. It does not constitute financial advice, investment recommendations, or a solicitation to buy or sell any asset. Historical performance data is not indicative of future results. Scenario projections and extreme price models represent analytical frameworks, not forecasts. All investment decisions should be made in consultation with a licensed and qualified financial adviser who can assess your individual circumstances.
Want To Know When The Next Major Mineral Discovery Hits The ASX?
Discovery Alert's proprietary Discovery IQ model delivers real-time alerts the moment significant ASX mineral discoveries are announced, transforming complex geological data into clear, actionable investment insights for both short-term traders and long-term investors. Explore the historic returns major discoveries have generated and begin your 14-day free trial at Discovery Alert to position yourself ahead of the broader market.