
May 14, 2026
When Charts Collide With Macro Reality: Reading the Current Dollar-Metals Crossroads
Commodity markets move in cycles, but they pivot on moments. History is full of inflection points where price action at key technical levels preceded weeks or months of directional commitment in one direction. The challenge for traders and investors is that these moments look identical before and after the break, but feel very different depending on which side of the confirmation they find themselves on. Right now, the dollar and metals make-or-break moment is unfolding at a handful of critical chart levels that will likely determine near-term trajectory across the entire group.
Understanding what is actually at stake requires more than reading a price table. It demands appreciation of both the technical architecture being tested and the macro currents flowing beneath the surface.
When big ASX news breaks, our subscribers know first
The Dollar-Metals Relationship Is More Complex Than It Appears
The textbook version of dollar-metals dynamics is simple: a stronger dollar makes gold and silver more expensive for non-dollar buyers, reducing demand and pushing prices lower. A weaker dollar does the reverse. This inverse relationship holds reasonably well during normal market conditions, but it regularly breaks down at exactly the moments that matter most to investors.
During periods of acute financial stress, liquidity deterioration can force institutional participants to liquidate both dollar-denominated assets and precious metals simultaneously to meet margin calls or reduce gross exposure. In these episodes, the historical inverse correlation inverts temporarily, creating confusion for traders who assumed they had a reliable hedge. Understanding this dynamic prevents costly misreads of short-term price signals.
Three forces amplify or suppress the standard dollar-metals inverse relationship at any given time:
- Real yields (the return on Treasury bonds after inflation): Rising real yields increase the opportunity cost of holding non-yielding metals, strengthening the dollar's relative appeal and pressuring gold prices specifically.
- Global liquidity conditions: When central banks are tightening simultaneously, dollar demand tends to spike as the world's reserve currency becomes scarcer, creating short-term pressure on metals regardless of individual country policy signals.
- Speculative positioning: When large pools of leveraged capital are positioned in the same direction, a positioning unwind can temporarily override the fundamental relationship between the dollar and metals entirely.
Furthermore, the gold and bond dynamics at play across economic cycles add another layer of complexity that traders must account for when positioning around these pivotal junctures.
"The dollar-metals relationship is not a fixed equation. It is a dynamic that shifts based on the dominant market regime, and identifying which regime is currently active is as important as watching price levels themselves."
What the Dollar Index Chart Is Actually Telling Traders
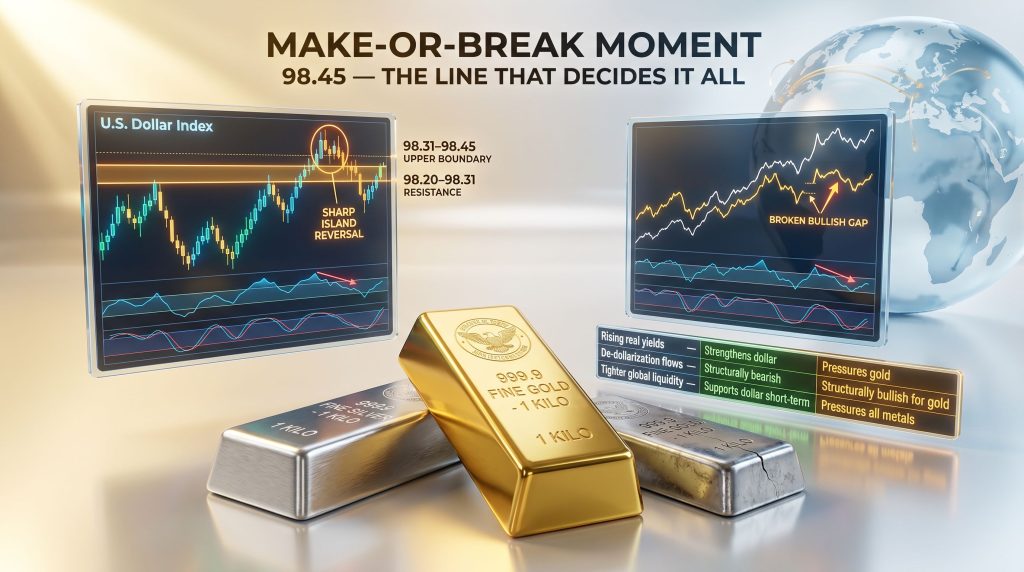
The U.S. Dollar Index is currently navigating a technically layered resistance structure that has important implications for the direction of precious metals. Buyers have pushed the index above the upper boundary of a recent consolidation zone and above the top of last week's bearish gap, but the most significant obstacle remains directly overhead in the form of an active island reversal pattern.
Why Island Reversals Matter
Island reversals are among the more high-conviction patterns in technical analysis precisely because they reflect a sudden and decisive shift in market sentiment. The pattern forms when a price cluster becomes isolated by gaps on either side — a gap up followed by a gap down, or vice versa. When this formation remains technically active, it functions as a resistance or support reference until price action explicitly closes it. The dollar's island reversal has not yet been closed, which means the bullish case is not yet confirmed.
According to analysis from FX Empire, the dollar and metals make-or-break moment is being closely watched by institutional traders, with the resistance cluster at 98.20–98.31 serving as the primary battleground.
Dollar Index Key Technical Levels (as of mid-May 2026):
| Level | Zone | Implication |
|---|---|---|
| 98.20–98.31 | Bearish gap + Island Reversal cluster | Primary resistance; breakout needed for bullish confirmation |
| 98.31–98.45 | Upper resistance boundary | Daily close above this opens path to 98.75–99.68 |
| 98.75–99.68 | Next upside target range | Achievable if bulls secure a confirmed close above resistance |
| Below current range | Gap-trapped zone | Failure to break keeps dollar rangebound between gaps |
The 4-hour chart provides additional nuance. On this timeframe, the same resistance zone is reinforced by the upper boundary of a rising channel that buyers have tested twice without success. Compounding the caution signal, both CCI and Stochastics momentum oscillators are showing negative divergence on shorter timeframes, meaning price is pushing to higher levels while momentum indicators are beginning to fade.
This divergence pattern does not guarantee an immediate reversal, but it does argue strongly against aggressive positioning ahead of confirmation.
"Negative momentum divergence is a warning, not a verdict. Markets can remain divergent for extended periods before resolving. The appropriate response is elevated caution and reduced exposure, not an automatic reversal trade."
The critical implication here is that a confirmed daily close carries far more weight than any intraday move above or below the identified zones. Waiting for the close is not passivity; it is precision.
Gold's Short-Term Weakness and Silver's Relative Strength Create a Polarised Picture
Gold has recently lost an important bullish gap, which represents the first meaningful sign of short-term technical weakness after a period of strength. This gap loss matters because bullish gaps in the direction of an existing trend typically function as support during pullbacks. When price drops back through a bullish gap rather than bouncing from it, it signals that buying momentum is no longer sufficient to defend previously captured territory.
How Silver Is Diverging From Gold
Silver, by contrast, is displaying relative strength compared to gold's current posture. This divergence between the two metals is technically unusual and deserves close attention. Examining silver versus gold performance across historical patterns reveals that such divergences often precede significant directional moves in both metals. Furthermore, a thorough gold-silver ratio analysis suggests that the current spread between the two metals may be at an inflection point of its own.
Hypothetical Scenario Analysis Based on Dollar Outcome:
-
Scenario A: Dollar Breaks Higher (daily close above 98.45)
- Gold faces renewed downside pressure as dollar strength reasserts
- Silver's relative strength may fade if broad commodity sentiment deteriorates
- Palladium's already fragile technical structure becomes more exposed to the downside
-
Scenario B: Dollar Rolls Over (rejection from current resistance)
- Gold and silver both gain short-term support from dollar weakness
- Precious metals positioning could shift back toward accumulation
- Real yield softening would amplify any metals recovery
Note: These are scenario analyses based on technical frameworks and do not constitute financial advice or price predictions. All scenarios carry meaningful uncertainty.
Palladium Presents the Most Vulnerable Technical Setup in the Complex
While gold and silver are navigating uncertainty from a position of relative technical health, palladium's chart has deteriorated to a degree that sets it apart as the most fragile structure in the precious metals group. This distinction carries practical portfolio implications.
A recent failed attempt to close an overhead bearish gap did more than leave the upside capped. It resulted in a test of the key support zone formed by the May 5 bullish gap at 1,481–1,494, and a simultaneous retest of the lower boundary of the broader consolidation structure. The significance of this dual test is that it demonstrates sellers were able to push price deeper than during previous sessions, revealing that buying pressure is thinning at levels where it had previously been sufficient to hold.
What the Dark Cloud Cover Pattern Signals
Adding a further bearish signal, the resulting candle formed a dark cloud cover pattern. This two-candle formation occurs when a bullish candle is followed by a session that opens above the prior high but closes below the midpoint of the previous candle's body. It is widely interpreted as evidence that selling pressure is actively overcoming buying momentum at that price level.
Palladium Key Technical Levels:
| Level | Zone Type | Market Implication |
|---|---|---|
| 1,492–1,523 | Bearish gap (overhead) | Caps upside recovery attempts |
| 1,481–1,494 | Bullish gap (support) | Last meaningful defence for bulls |
| Above 1,523 | Breakout confirmation | Improves technical outlook significantly |
| Below 1,481 | Support breakdown | Opens path to deeper downside; broader consolidation under pressure |
The concept of gap stacking is central to reading palladium's current setup. When bearish gaps sit overhead while bullish gaps sit below, the market becomes compressed between two opposing structural references. Neither bulls nor bears have a clear runway until one of these zones is decisively broken on a daily closing basis.
It is also worth noting that palladium's technical fragility does not exist in isolation. The metal faces longer-term structural headwinds from the gradual shift toward electric vehicle adoption globally, which reduces demand for catalytic converters — the primary industrial end-use for palladium.
The Macro Forces That Determine Which Technical Outcome Prevails
Technical analysis identifies where the battles are being fought. Macro analysis helps determine which side has the structural advantage going into that fight. For the dollar-metals complex right now, several macro variables are worth monitoring alongside price action.
Macro Force Multipliers: How Key Variables Affect the Dollar and Metals:
| Macro Variable | Dollar Impact | Metals Impact |
|---|---|---|
| Rising real yields | Strengthens dollar | Pressures gold specifically |
| Falling real yields | Weakens dollar | Supports gold and silver |
| Risk-off sentiment | Mixed (can be safe-haven bid) | Supports gold selectively |
| De-dollarisation flows | Structurally bearish long-term | Structurally bullish for gold |
| Tighter global liquidity | Supports dollar short-term | Pressures all metals |
| Central bank gold buying | Indirect negative for dollar perception | Direct positive for gold demand |
The global de-dollarisation trend represents perhaps the most structurally significant macro factor for long-term gold investors. Central bank gold demand has been systematically increasing across emerging market economies, partly as a hedge against geopolitical risk and partly in response to the demonstrated use of financial sanctions that affect dollar-denominated assets. This structural demand flow creates a persistent bid underneath the market that makes deep and sustained selloffs progressively harder to achieve.
Furthermore, gold safe-haven dynamics continue to evolve in response to shifting geopolitical risks, adding another dimension to the macro picture that traders must weigh alongside purely technical signals. According to research from Investing.com, the dollar and metals make-or-break moment is being reinforced by the fact that metals are holding near support even as the dollar tests overhead resistance — a dynamic that underscores the tension between competing macro forces.
Federal Reserve policy expectations also shape the dollar's trajectory in ways that directly influence metals. When the market prices in fewer rate cuts or a higher-for-longer stance on policy rates, real yields tend to remain elevated, which disadvantages gold relative to yield-bearing alternatives. Conversely, any shift toward policy easing tends to compress real yields and strengthen the relative appeal of precious metals.
The next major ASX story will hit our subscribers first
A Practical Decision Framework for Navigating the Current Setup
Markets at inflection points require a structured decision-making process rather than intuitive reactions to price movements. The following step-by-step framework applies directly to the current dollar-metals setup:
- Identify the key level precisely and resist the temptation to assume it will break before price action confirms it. The 98.20–98.31 zone for the dollar and the 1,481–1,494 zone for palladium are the primary references.
- Wait for the daily close before drawing conclusions. Intraday moves through key zones are routinely reversed, particularly around technically significant levels where institutional order flows are concentrated.
- Check momentum indicator alignment across timeframes. When CCI and Stochastics are showing divergence while price is testing resistance, the burden of proof for bulls is higher, not lower.
- Validate across related markets by checking whether silver is confirming gold's direction, or whether dollar movement is consistent with interest rate expectations and credit conditions.
- Define your invalidation level before entering any position. Knowing precisely where the trade thesis is wrong is not optional; it is the foundation of capital preservation in high-uncertainty environments.
- Size positions conservatively at pivotal junctures. High-uncertainty inflection points call for smaller initial exposure with the ability to add if and when confirmation materialises, not full-sized positions based on anticipation.
"Markets at inflection points reward patience over prediction. The asymmetric risk in these setups lies in overcommitting to a directional thesis before the market has confirmed it through a meaningful daily close above or below the relevant structural levels."
FAQ: Understanding the Dollar and Metals Make-or-Break Moment
What does a make-or-break moment mean in technical market analysis?
A make-or-break moment describes a market condition where price is testing a critical structural level such as a resistance cluster, an active gap zone, or a reversal pattern. The outcome at this level is likely to determine the next significant directional move, making it a period of elevated uncertainty that demands confirmation before directional commitment.
Why does the U.S. dollar have such a strong influence on gold and silver prices?
Most commodities, including precious metals, are priced globally in U.S. dollars. When the dollar strengthens, metals become more expensive for buyers holding other currencies, which tends to reduce international demand and exert downward pressure on prices. However, structural factors including real yields, central bank reserve demand, geopolitical risk premiums, and liquidity conditions can all override the directional influence of the dollar over varying timeframes.
What makes an island reversal pattern significant for traders?
An island reversal forms when a cluster of price action becomes isolated by gaps on both sides of it. The isolation signals a sudden and decisive shift in sentiment, because it means buyers or sellers were caught off-guard by the speed of the move away from that price zone. This pattern retains technical relevance as a resistance or support reference until price action explicitly closes the gaps on both sides.
What is a dark cloud cover pattern and how should traders interpret it?
A dark cloud cover is a two-candle pattern where a strong bullish candle is followed by a session that opens above the prior candle's high but closes below the midpoint of the previous candle's body. This structure indicates that selling pressure overcame buying momentum during that session and is typically interpreted as a warning that further downside may follow.
Why is palladium considered more structurally fragile than gold or silver?
Palladium's technical weakness is compounded by longer-term fundamental headwinds. Its primary industrial application is in catalytic converters for internal combustion engine vehicles, a market that faces gradual but meaningful structural decline as electric vehicle adoption grows globally. This demand erosion gives technical deterioration in palladium a different fundamental context than similar patterns observed in gold or silver.
How should investors approach negative momentum divergence?
Negative momentum divergence occurs when price reaches a higher level while momentum oscillators such as CCI or Stochastics register a lower reading. This divergence suggests that the price move is losing internal energy, making it potentially unsustainable. The appropriate response is heightened caution and a preference for confirmation before initiating or expanding positions.
Why Confirmation Is the Most Underrated Edge in Volatile Markets
Navigating a dollar and metals make-or-break moment requires more than identifying the right levels. It requires the discipline to wait for those levels to be definitively tested and resolved before committing capital in either direction. The most costly trades in technical analysis are typically those entered in anticipation of a breakout that never fully materialises.
The dollar's current battle with the 98.20–98.31 resistance cluster, the island reversal, and the upper boundary of the 4-hour rising channel represents a genuinely pivotal moment. A confirmed daily close above 98.45 would validate the bullish case and open the door toward the 98.75–99.68 target range, with meaningful implications for precious metals across the board. Failure to achieve that close preserves the dollar's rangebound condition and provides at least temporary support to gold and silver.
Palladium's resolution, however, hinges on the integrity of the May 5 bullish gap at 1,481–1,494. As long as this zone holds, the broader consolidation remains intact. A decisive daily close below 1,481 changes that assessment materially.
Capital preservation during high-uncertainty pivots is not a passive strategy. It is a deliberate choice to avoid the most expensive mistake in active markets: being right about the direction and wrong about the timing. The next confirmed directional move in the dollar will likely set the tone for precious metals across multiple timeframes, and the traders who wait for that confirmation rather than anticipating it will be best positioned to act on it cleanly.
This article is for informational and educational purposes only. Nothing contained herein constitutes financial, investment, or trading advice. All technical levels and scenario analyses involve uncertainty and should not be relied upon as predictions of future market outcomes. Readers should conduct independent research and consult qualified financial professionals before making investment decisions.
Want to Track the Next Major ASX Mineral Discovery Before the Market Moves?
While macro forces and technical levels shape the broader commodities landscape, Discovery Alert's proprietary Discovery IQ model cuts through the complexity by delivering real-time alerts on significant ASX mineral discoveries — explore the historic returns major discoveries have generated and start your 14-day free trial to ensure you're positioned ahead of the market.