August 5, 2026
The Hidden Architecture of a Nuclear Fuel Crisis Hiding in Plain Sight
Most commodity markets move in cycles driven by price discovery. Uranium is different. Its market dynamics are shaped by a web of geopolitical dependencies, long-term procurement contracts, and physical supply chains that take years, sometimes decades, to reconstitute once disrupted. Understanding why domestic uranium production and uranium prices matter today requires looking not at recent headlines, but at the structural fractures that were quietly forming for more than a decade before the current recovery began.
Between 2012 and 2020, persistently low uranium prices following the Fukushima Daiichi disaster wiped out most of the U.S. mining industry's economic rationale. Domestic producers could not compete with subsidised or lower-cost foreign supply, particularly from Kazakhstan and Russia. Mines were idled, workforces were dissolved, and permitting pipelines were abandoned. The U.S. nuclear fuel sector quietly hollowed itself out while the reactors it was meant to supply continued operating, drawing feed from international sources that are now, under radically changed geopolitical conditions, considerably less reliable.
What followed was one of the most dramatic production collapses in American mining history, and the recovery now underway, while genuine, still has an enormous distance to travel.
When big ASX news breaks, our subscribers know first
From Near-Zero to the Highest Output in a Decade
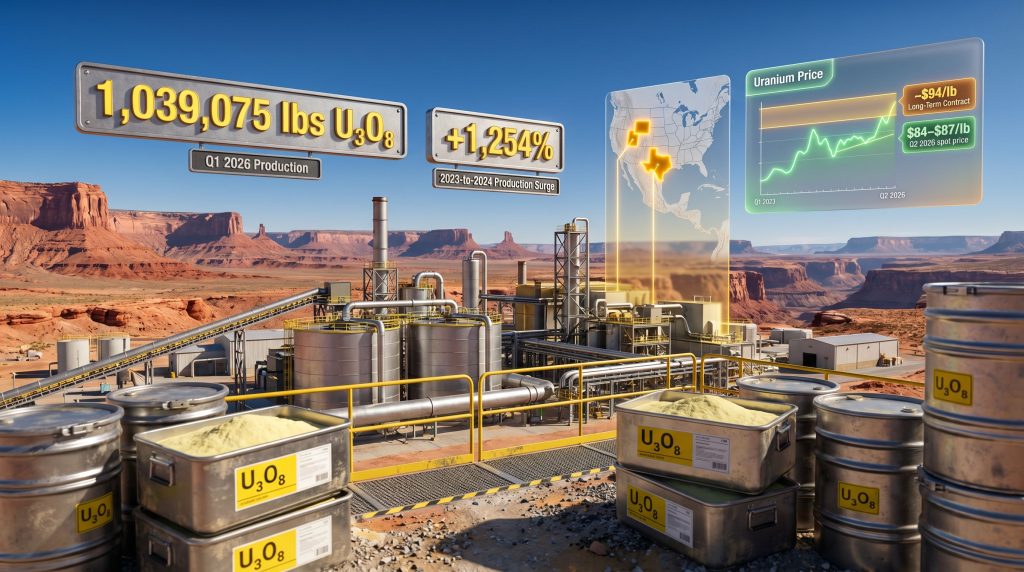
The numbers tell a story that is difficult to overstate. In 2023, U.S. uranium concentrate production fell to approximately 50,000 pounds of U₃O₈, a figure representing near-total industry inactivity. By 2024, that figure had rebounded to roughly 677,000 pounds, a year-on-year increase of more than 1,250%. That sounds extraordinary until you recognise that 677,000 pounds still represents less than 2% of what the U.S. commercial nuclear fleet consumes annually.
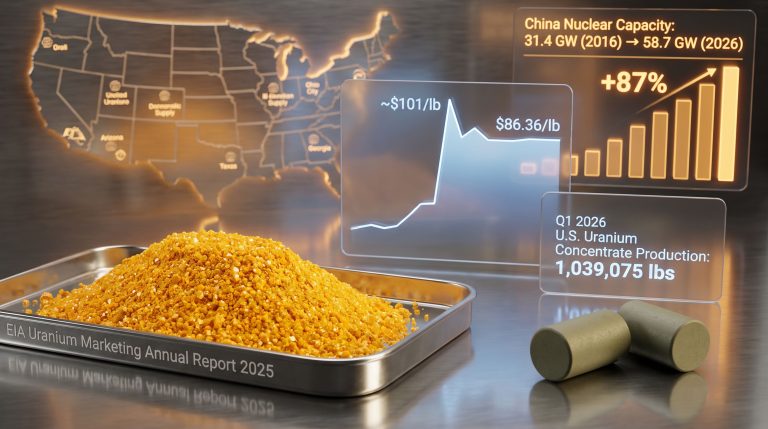
The momentum has continued into 2026. According to the U.S. Energy Information Administration's annual uranium production data, domestic output reached 1,039,075 pounds of U₃O₈ during the first three months of the year. This was marginally lower than Q4 2025's 1,043,474 pounds, a decline of just 0.4%, but represented the highest first-quarter production figure recorded since 2015, when 1,154,408 pounds were produced in the equivalent period.
| Metric | 2023 | 2024 | Q1 2026 (Annualized) |
|---|---|---|---|
| U.S. U₃O₈ Production | ~50,000 lbs | ~677,000 lbs | ~4,000,000 lbs |
| Year-on-Year Change | Baseline | +1,254% | Strong trajectory |
| Share of U.S. Reactor Requirements | Negligible | ~1.4% | ~8% (est.) |
| Industry Employment (Full-Time Person-Years) | ~340 | 506 | Growing |
The workforce dimension of this recovery deserves particular attention. Industry employment reached 506 full-time person-years in 2024, the highest level since 2016 and a 49% increase from 2023. This matters because skilled uranium mining labour cannot be recruited overnight. The human capital pipeline is as much a bottleneck to scaling output as geology or permitting.
The Six Facilities Carrying the Entire U.S. Industry
All of the Q1 2026 production occurred across just six operating facilities. This concentration of output within a handful of sites underscores both the fragility of the current recovery and the leverage that any disruption to one major facility could have on national supply figures.
| Facility | State | Technology |
|---|---|---|
| White Mesa Mill | Utah | Conventional ore processing |
| Smith Ranch-Highland Operation | Wyoming | In-situ recovery (ISR) |
| Lost Creek Project | Wyoming | In-situ recovery (ISR) |
| Ross Central Processing Plant | Wyoming | In-situ recovery (ISR) |
| Willow Creek Project | Wyoming | In-situ recovery (ISR) |
| Alta Mesa Project | Texas | In-situ recovery (ISR) |
One facility stands apart from the rest. White Mesa Mill in Utah produced 788,404 pounds during Q1 2026, representing approximately 75.9% of the nation's entire first-quarter output. This makes White Mesa not just the dominant contributor to domestic supply, but effectively the load-bearing pillar of the entire U.S. uranium production ecosystem. Any operational disruption at that single site would meaningfully set back the national recovery trajectory.
The remaining production came from four ISR operations in Wyoming and one in Texas. Wyoming's prominence reflects its geology: the state hosts large sandstone-hosted uranium roll-front deposits that are well-suited to U.S. ISR uranium production techniques, and it has historically been the most productive uranium-mining state in the country.
Why In-Situ Recovery Dominates U.S. Uranium Mining
The dominance of ISR technology in U.S. uranium production is not accidental. It reflects a rational economic and regulatory adaptation to the specific geological and policy environment of the American West.
ISR works by injecting a lixiviant solution, typically a mildly oxidising, bicarbonate-bearing groundwater, directly into a uranium-bearing sandstone aquifer. The solution dissolves uranium from the ore body in place, and the pregnant solution is then pumped to the surface where uranium is recovered through ion exchange and further processing. The ore body never needs to be physically excavated.
Why ISR has become the preferred method:
- Significantly lower capital costs compared to conventional open-pit or underground mining
- Minimal surface disturbance, reducing environmental review complexity
- Faster deployment once permits are in hand, as surface infrastructure is limited
- Lower operating cost per pound at comparable grades in suitable geological settings
- Ability to restart standby operations more quickly than conventional mines
The U.S. currently has 7 active ISR operations with a combined nameplate capacity of 14.1 million pounds of U₃O₈ per year, alongside 5 standby ISR plants carrying an additional 8.8 million pounds per year of latent capacity. That total potential ISR capacity of 22.9 million pounds per year represents a significant strategic reserve, though activating standby plants requires capital investment, workforce recruitment, and regulatory re-engagement that can take 18 to 36 months under favourable conditions.
A critical and underappreciated constraint on ISR restarts is the availability of licensed and experienced wellfield operators. The technical workforce that understands ISR hydrogeology, wellfield design, and solution chemistry is small, specialised, and cannot be rapidly scaled. This human capital bottleneck may prove to be a more binding constraint than capital availability as the industry attempts to accelerate production.
The Geological Foundation: What the U.S. Actually Has in the Ground
How large are America's recoverable uranium resources?
Economically recoverable uranium resources in the United States were estimated at 468.1 million pounds of U₃O₈ at the end of 2024, placing the country among the top four nations globally by resource endowment. This figure encompasses resources recoverable at prices up to $100 per pound, using conventional and ISR methods. Furthermore, the global uranium reserves picture helps contextualise just how significant the U.S. endowment really is.
The resource base is geographically concentrated:
- Wyoming hosts the largest share of ISR-amenable sandstone roll-front deposits
- Utah contains conventional ore resources processed through White Mesa Mill, including alternate feed materials from mine cleanups and other sources that supplement primary ore
- Texas hosts the Alta Mesa ISR project within the Catahoula Formation
- Colorado, New Mexico, and Arizona contain additional conventional resources, some of which are in various stages of permitting or development
A lesser-known feature of White Mesa Mill's production profile is its ability to process alternate feed materials, meaning uranium-bearing waste streams from legacy mine sites, mill tailings, and other sources. This provides the facility with a feedstock flexibility that pure ISR operations do not possess, partially explaining its outsized contribution to national output during periods when primary ore availability is constrained.
Domestic Uranium Production and Uranium Prices: Where the Market Stands in 2026
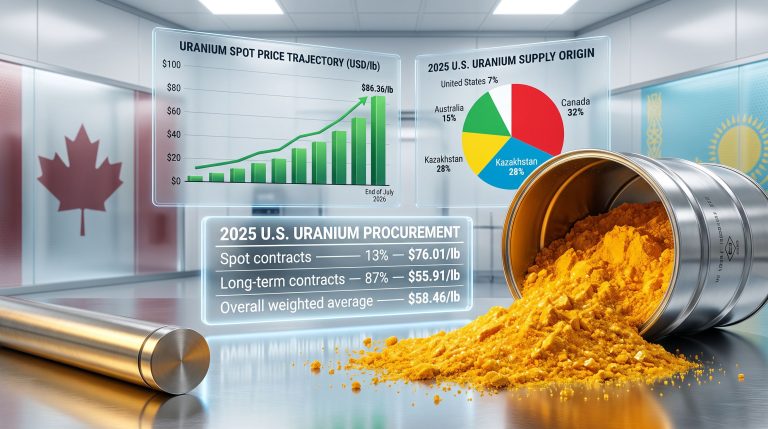
The uranium price story in 2026 is one of consolidation after speculation. After the spot price surged to $94.28 per pound at the end of January 2026, the highest level reported by Cameco's uranium price tracker since February 2024, the market entered a steady pullback through the subsequent months.
Uranium Spot Price Progression (Cameco-Reported):
| Period | Spot Price (USD/lb) |
|---|---|
| September 2025 (Year High) | $82.63 |
| November 2025 | $75.80 |
| January 2026 (End of Month) | $94.28 |
| February 2026 (End of Month) | $86.95 |
| March 2026 (End of Month) | $84.25 |
| April 2026 (End of Month) | $86.35 |
| May 2026 (End of Month) | $84.18 |
| June 2026 (End of Month) | $85.00 |
| July 1, 2026 (Futures) | $86.05 |
The cooldown from the January peak reflects a combination of reduced spot buying by utilities, which have been drawing on pre-arranged long-term contracts rather than competing in the spot market, and the natural dissipation of speculative positioning that contributed to the early-year surge. Analysts have noted that geopolitical tension has driven major economies to reassess power market vulnerability, sparking renewed interest in nuclear power from both governments and technology companies developing power-hungry AI infrastructure.
In addition, the uranium supply-demand volatility of recent years has reinforced the case for utilities to lock in contracted supply rather than rely on spot market access.
The next major ASX story will hit our subscribers first
The Spot-Long-Term Price Gap: A Signal the Market Is Misreading
One of the most structurally revealing features of the current uranium market is the persistent premium that long-term contract prices command over spot prices. While spot uranium trades around $84 to $87 per pound, long-term contract prices are running at approximately $94 per pound, a level not seen since roughly 2008. The dynamics behind spot vs term uranium prices are therefore increasingly important for investors to understand.
This divergence is not a sign of market dysfunction. It is a signal that sophisticated utility buyers are prioritising supply certainty over cost optimisation, a rational response to the supply chain disruptions that followed Russia's invasion of Ukraine and the legislative restrictions on Russian uranium imports that followed.
What the spot-long-term divergence communicates to investors:
- Utilities are no longer comfortable relying on spot market access for fuel procurement
- The premium for contracted, guaranteed supply reflects genuine supply security anxiety
- Spot market softness may be misleading as an indicator of underlying demand strength
- The contracted price level provides a more reliable signal of the market's true equilibrium valuation
Uranium futures are tracking an upward path, with analyst consensus suggesting Q3 2026 prices around $86.92 per pound and 12-month forward estimates reaching approximately $90.78 per pound.
The AI Economy as an Unexpected Uranium Demand Driver
Previous uranium market cycles were shaped almost entirely by the construction and operating profiles of conventional nuclear power plants. The current cycle has introduced a demand driver that did not meaningfully exist in any prior bull market: the power requirements of artificial intelligence infrastructure.
Large-scale AI training and inference operations require continuous, stable electricity at densities that conventional grid infrastructure often cannot reliably provide in the volumes needed. Nuclear power's baseload characteristics, its ability to generate electricity continuously regardless of weather, time of day, or seasonal variation, make it uniquely attractive as a power source for data centre operators committed to carbon-free electricity targets.
Major technology companies have been pursuing power purchase agreements and direct investment in nuclear energy projects at an accelerating pace. This creates a demand layer that is structurally different from traditional utility procurement in several important ways:
- Technology companies are often willing to pay premium prices for guaranteed, low-carbon baseload power, potentially supporting above-market uranium contract pricing
- Their multi-decade data centre investment horizons create correspondingly long demand commitments for nuclear fuel
- AI hyperscalers are increasingly acting as catalysts for new reactor construction, including small modular reactors, rather than merely consuming electricity from existing fleets
- This new buyer class adds competitive pressure on uranium supply that was not factored into pre-2023 market models
Global Supply Concentration and the Case for Domestic Production Growth
The strategic urgency behind rebuilding domestic uranium production and uranium prices that incentivise that rebuilding cannot be understood without examining the structure of global supply. Approximately 39% of global uranium mine production currently comes from Kazakhstan, with Canada contributing around 24% and Namibia approximately 12%. This means roughly three-quarters of global supply is concentrated in three countries, none of which is the United States.
| Country | Approximate Share of Global Uranium Mine Production |
|---|---|
| Kazakhstan | ~39% |
| Canada | ~24% |
| Namibia | ~12% |
| Russia | ~5% |
| Other (Australia, Uzbekistan, etc.) | ~20% |
Despite holding the world's fourth-largest uranium resource base, the U.S. currently produces less than 0.5% of global supply and satisfies approximately 1.4% of its own reactor fuel requirements from domestic mines. The commercial nuclear fleet requires an estimated 40 to 50 million pounds of U₃O₈ equivalent annually, and the gap between domestic output and that requirement is closed almost entirely by imports.
Furthermore, the U.S. ban on Russian uranium has added structural pressure to an already strained import landscape, making the case for domestic expansion even more compelling. Even a scenario in which all standby ISR capacity were reactivated alongside current production would yield an estimated 12 to 14 million pounds per year, covering perhaps 25 to 35% of annual fuel requirements. Full supply chain sovereignty remains a long-term aspiration rather than a near-term achievable outcome.
Production Scenarios to 2030: What Realistic Growth Looks Like
The path from the current annualised run rate of approximately 4 million pounds per year to anything approaching national sufficiency involves overcoming challenges that are as much institutional and human as they are geological.
Three Scenarios for U.S. Uranium Production by 2030:
| Scenario | Key Assumptions | 2030 Output Est. |
|---|---|---|
| Base Case | Active facilities sustain output; limited restarts | ~4 million lbs/year |
| Accelerated Development | Standby ISR partial restarts; new project permitting advances | ~6-7 million lbs/year |
| Strategic Mobilisation | Full standby restart; conventional and ISR expansion; capital influx | 10+ million lbs/year |
The binding constraints on scenarios two and three are less about geology or even capital than about the pace of regulatory review and the availability of trained personnel. ISR wellfield engineers, heap leach metallurgists, and licensed radiation protection professionals represent a workforce pipeline that was substantially depopulated during the years of industry inactivity and cannot be reconstituted on short notice.
The $65 per pound threshold has historically been cited as the minimum incentive price required to justify new uranium mine development. With current spot prices running approximately $85 per pound and long-term contract prices near $94 per pound, the market technically clears that hurdle. However, inflation in steel, construction labour, energy, and regulatory compliance costs has almost certainly pushed the true economic incentive threshold considerably higher for greenfield projects, likely into the $75 to $90 per pound range depending on project type and location.
Investors and analysts who benchmark current prices against the historical $65/lb incentive price threshold may be underestimating the capital intensity of new project development in the current cost environment. The real incentive price for new U.S. mine construction in 2026 is likely materially higher than the figures cited in pre-2022 feasibility studies.
Frequently Asked Questions
What is the current uranium spot price in 2026?
As of the end of June 2026, the uranium spot price was $85.00 per pound as reported by Cameco. Uranium futures were trading at $86.05 per pound on July 1, 2026, representing a 10.60% increase over the prior 12 months.
How much uranium does the U.S. produce domestically?
U.S. domestic uranium production reached approximately 677,000 pounds in 2024, rebounding sharply from roughly 50,000 pounds in 2023. Q1 2026 output totalled 1,039,075 pounds, the highest first-quarter figure since 2015.
Why does the U.S. rely so heavily on imported uranium?
Following the Fukushima disaster in 2011, a prolonged period of low uranium prices made domestic production economically unviable against cheaper foreign supply, particularly from Kazakhstan. Most U.S. mines were idled, and the domestic industry shrank to near-zero output by 2023. The recovery now underway reflects higher prices and renewed focus on supply chain security.
What is in-situ recovery uranium mining?
ISR is a method of extracting uranium without physical excavation. A solution is injected underground to dissolve uranium from the ore body in place, then pumped to surface processing facilities. It offers lower capital costs, reduced surface disturbance, and faster deployment than conventional mining, making it the dominant U.S. uranium extraction method.
Which states produce uranium in the United States?
As of Q1 2026, active production occurs in Wyoming (four ISR operations), Utah (White Mesa Mill), and Texas (Alta Mesa ISR project). Wyoming and Utah account for the overwhelming majority of current national output.
Key Metrics at a Glance
| Indicator | Value |
|---|---|
| U.S. Q1 2026 Production | 1,039,075 lbs U₃O₈ |
| 2024 Annual Production | ~677,000 lbs |
| White Mesa Mill Q1 2026 Share | ~75.9% of total output |
| Active Production Facilities | 6 |
| Spot Price (June 2026) | ~$85.00/lb |
| Long-Term Contract Price (2026) | ~$94/lb |
| 12-Month Futures Estimate | ~$90.78/lb |
| January 2026 Spot Peak | $94.28/lb |
| U.S. In-Ground Resources | 468.1 million lbs U₃O₈ |
| Active ISR Nameplate Capacity | 14.1 million lbs/year |
| Standby ISR Capacity | 8.8 million lbs/year |
| 2030 Production Range | 4 to 10+ million lbs/year |
The fundamental thesis for U.S. domestic uranium production and uranium prices is not contingent on a single policy decision, a speculative price spike, or the outcome of any one project. It rests on a structural mismatch between a nation's reactor fleet requirements and its domestic production capacity that has been building for more than a decade. The recovery underway is real, the resource base is substantial, and the price signals are supportive. What remains is the harder, slower work of rebuilding the industry's physical and human infrastructure at the pace that energy security genuinely requires.
This article contains forward-looking statements and projections based on publicly available data and analyst estimates. Uranium prices, production forecasts, and market conditions are subject to change. This article does not constitute financial or investment advice. Readers should conduct their own independent research and consult qualified advisors before making investment decisions.
Want to Capitalise on the Next Major Uranium Discovery Before the Broader Market Reacts?
Discovery Alert's proprietary Discovery IQ model delivers real-time alerts on significant ASX mineral discoveries — including uranium — instantly converting complex geological data into actionable investment insights for both short-term traders and long-term investors. Explore historic discoveries and their exceptional market returns, then begin your 14-day free trial at Discovery Alert to position yourself ahead of the market.