August 7, 2026
Why the Bond Market Holds the Key to Gold's Next Move
Most conversations about Don Durrett gold and silver mining stocks top picks begin with company fundamentals, management teams, or reserve estimates. However, the more instructive starting point is a structural question: what happens to capital allocation when sovereign debt becomes the primary engine of economic growth, rather than productivity?
That question sits at the core of a long-term investment thesis that has driven one of the more methodical approaches to precious metals equity investing in the current cycle. When governments cannot grow their economies without continuously expanding their debt load, the historical record strongly favours hard assets, particularly gold, as the eventual beneficiary of that structural fragility.
The US bond market, as the deepest and most systemically important debt market in the world, is the instrument worth watching. The US economy currently requires roughly $2 to $4 trillion in annual borrowing just to sustain its existing trajectory. Understanding the gold and bonds dynamics at play helps clarify why, when debt servicing becomes constrained, gold does not simply act as a hedge — it functions as what Porter Stansberry described in The End of America as the literal anchor of the economy.
Layered on top of this are Triffin's dilemma, the structural tension created by the US dollar serving simultaneously as both a domestic currency and the world's reserve currency, geopolitical fragmentation, and a cost-of-living squeeze that has made home ownership inaccessible for most people under 35 in the developed world. These are not peripheral risks. They represent a convergence of pressures that historically precede a significant reallocation toward monetary metals.
The thesis for owning gold and silver mining stocks begins not with the companies themselves, but with a structural view of the global monetary system. When sovereign debt reaches a level where growth becomes debt-dependent rather than productivity-driven, gold historically transitions from a peripheral asset to a central store of value.
When big ASX news breaks, our subscribers know first
Mapping the Current Gold Bull Market: Legs, Levels, and What Comes Next
The Multi-Leg Structure and Where Leg Two Stands
The current gold bull market is best understood as a multi-leg structure rather than a single directional move. Leg One began in August 2024 and ran through to approximately January 2025, pushing gold to around $5,600 per ounce and silver to $120 per ounce. That initial leg has since corrected, with gold pulling back roughly 29% from its peak and silver declining approximately 55% from its high.
The critical question now is whether Leg Two has already begun, or whether a deeper correction remains ahead. The S&P 500 is the key variable. If US equity markets, currently elevated near the 7,700 level, undergo a seasonal correction through August and September — historically the two weakest months for equities — gold could retrace toward a $3,750 target before Leg Two fully confirms.
The gold-bond market relationship provides additional context here. That scenario represents roughly a 50/50 probability at this stage, functioning more like a coin flip than a high-conviction directional call.
The Nasdaq composite offers an additional signal worth monitoring. Having peaked near 9,000 and already declining to the mid-6,000s, with daily swings of 5% in either direction, the index is exhibiting behaviour consistent with a distribution top. If the Nasdaq is front-running the broader S&P 500, the case for one more gold correction before November becomes more credible.
Price Targets Across the Bull Market Cycle
The following framework outlines the projected structure of the current cycle:
| Phase | Gold Price Range | Silver Price Range | Sentiment Condition |
|---|---|---|---|
| Leg One (Completed) | Up to ~$5,600/oz | Up to ~$120/oz | Improving from low base |
| Correction (Active) | Down to ~$3,750/oz possible | Significant drawdown | Poor, uncertainty elevated |
| Leg Two (Anticipated) | New all-time high | New all-time high | Recovering, fair valuation |
| Leg Three (Projected) | $7,000–$10,000/oz | $200/oz+ | Frothy, mania conditions |
| Estimated Timeline for Phase Three | 2028 or later | 2028 or later | Widespread retail participation |
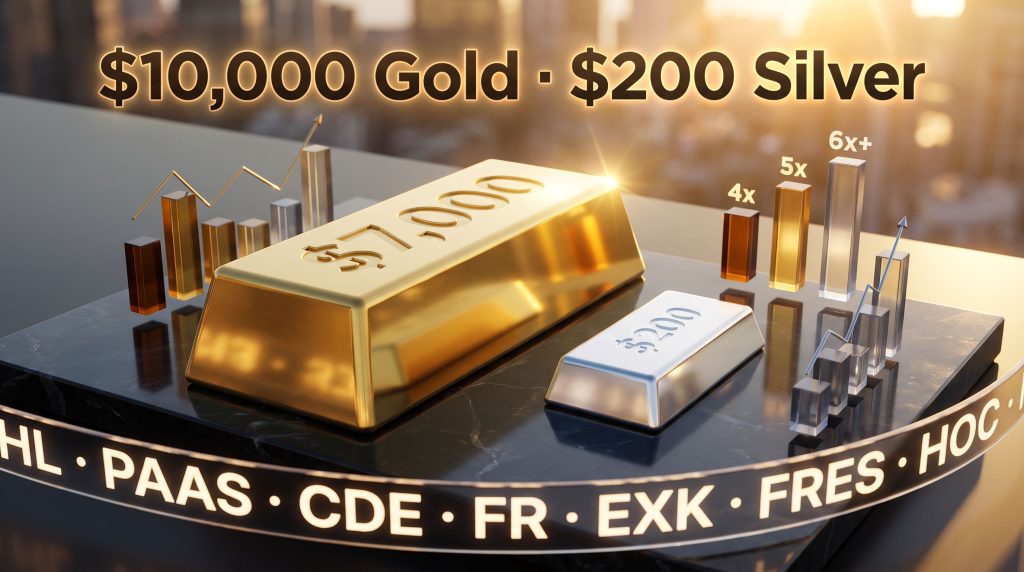
The working conservative price target used for portfolio modelling is $7,000 per ounce for gold and $200 per ounce for silver. Both figures are intentionally revised upward incrementally as spot prices rise.
The longer-term view puts gold at $10,000 per ounce, contingent on the US economy entering what has been described as a doom loop — a condition where rising debt service costs crowd out productive investment, limiting the Federal Reserve's ability to engineer a recovery in the way it has historically done.
The Japan 1989 parallel is instructive here. Japan's central bank was ultimately unable to restore sustained growth after its asset bubble collapsed, even with decades of unconventional monetary policy. A comparable outcome in the US, where debt levels are now structurally higher relative to GDP, would represent a fundamentally bullish backdrop for gold and silver that could persist well beyond 2028.
ETFs Versus Individual Mining Stocks: An Honest Risk-Return Comparison
Why ETFs Are the Right Starting Point for Most Investors
For the majority of retail investors, silver and gold miner ETFs offer a genuinely compelling risk-adjusted opportunity without requiring deep sector expertise. At conservative price targets of $7,000 gold and $200 silver, the projected return profile looks like this:
| ETF Category | Example Tickers | Projected Return Potential | Risk Profile |
|---|---|---|---|
| Silver Miner ETFs | SIL, SILJ, SLVR, SLVP | ~5x (500%) | Moderate-High |
| Gold Miner ETFs | GDX and equivalents | ~4x (400%) | Moderate |
| Physical Gold/Silver | N/A | Baseline reference | Lower |
A 300% to 500% return is an outcome most investors would find extraordinary. ETFs achieve this without requiring the investor to develop fluency in mine geology, capital structure analysis, permitting timelines, or management assessment. For those not prepared to commit the estimated two years of learning required to competently analyse individual mining companies, ETF exposure provides most of the upside with significantly less execution risk.
The recommended maximum allocation per ETF position is 2% to 5%, reflecting the meaningful volatility these instruments carry. Furthermore, silver declined 55% from its January 2025 peak — a drawdown that would be psychologically catastrophic for an investor carrying oversized exposure in a concentrated position.
The Case for Individual Stock Selection
Investors pursuing individual mining stocks are making two simultaneous speculative bets: first, that gold and silver prices will rise substantially; and second, that the US economy will weaken enough to validate the fear trade. Neither bet works in isolation. A strong economy removes the macro catalyst. Rising gold prices without economic deterioration tend to be shorter-lived and more easily reversed.
Those who accept both premises and pursue individual stocks are not investors in the conventional sense. They are speculators seeking what practitioners call big alpha — the kind of compounding returns that arrive when a developer-stage company transitions to production inside a bull market for the underlying metal. The leverage embedded in that transition can generate 10x to 30x returns that no ETF can replicate.
The critical insight from a seasoned practitioner's perspective is simple: you make your money when you buy, not when you sell. Buying at the 200-day moving average or below during dips maximises the compounding potential of any position. Chasing stocks after they have already doubled means you have already surrendered half of your available upside.
How to Analyse and Select Gold and Silver Mining Stocks
The Database Methodology and Realistic Expectations
Systematic coverage of approximately 870 gold and silver companies globally provides a foundation that most retail investors cannot replicate. Resources such as Gold Stock Data are invaluable tools for tracking this universe efficiently. From that broader universe, a portfolio of 168 positions has been assembled through gradual accumulation over roughly two decades, using small individual allocations designed to remove emotional decision-making from the process.
The most important calibration for any mining stock speculator is realistic expectation-setting. The seven out of ten framework establishes that roughly 70% of positions should perform as expected, while 30% will disappoint in some material way. This is not a failure rate. It is an acceptance that the sector carries inherent execution risk that cannot be fully diversified away.
Why Mining Is Unlike Any Other Business
Gold and silver mining companies have a set of structural characteristics that distinguish them from virtually every other investable business:
- They have no customers in the traditional sense. Gold can be sold to any buyer globally at the prevailing spot price.
- They have no competitors in the conventional sense. Barrick and Newmont do not compete against each other for market share. They compete against their own cost structures and their ability to find or acquire new deposits.
- Their core asset is depleting by design. Every tonne of ore extracted reduces the life of the mine. Constant reinvestment in exploration or acquisition is required just to maintain production, making capital discipline a perpetual challenge.
- What they mine is money. Gold is the anchor of the global monetary system. Mining companies producing gold are, in effect, producing the asset that benefits most from the very conditions that create economic stress.
The Six-Item Checklist for Developer Selection
Before a developer-stage company qualifies for inclusion in a portfolio, it should pass a structured checklist covering the following criteria:
- Insider ownership above 25% as a minimum threshold for management alignment with shareholder interests.
- Feasibility-stage resource definition sufficient to support construction financing discussions.
- Jurisdiction quality that supports realistic permitting timelines and contract enforcement.
- Capital expenditure estimates within a range that existing or accessible financing can credibly cover.
- Management track record of prior construction or operational experience.
- Absence of near-term dilution risk from convertible instruments or expiring credit facilities.
Insider ownership deserves particular emphasis. When founders and management teams hold less than 25% of outstanding shares, the incentive to accept an acquisition offer at a modest premium becomes structurally elevated. Premature acquisition — where a developer is sold before reaching production and full cash flow realisation — is the single most common way speculative upside is destroyed in this sector.
One of the most consistent portfolio risks in junior developer investing is premature acquisition. When a developer is taken out at a modest premium before reaching full production potential, shareholders lose the compounding upside they were positioned for. Insider ownership above 25% reduces, but does not eliminate, this risk.
Don Durrett's Top Silver Stock Picks: The Mormons List
Origins and Composition of the List
In late 2023, a curated group of elite silver mining companies was assembled under the informal label the Mormons list, reflecting their status as the most reliable and high-quality names in the silver mining universe. The list was constructed as a direct counterpoint to the tendency among speculative investors to prioritise cheap, high-risk names over quality businesses with genuine leverage to rising silver prices.
The seven names that form the core of this list are:
| Company | Classification | Projected Return at $200 Silver |
|---|---|---|
| Hecla Mining | Senior Producer | 6x+ |
| Pan American Silver | Senior Producer | 6x+ |
| Coeur Mining | Producer/Developer | 6x+ |
| First Majestic Silver | Mid-Tier Producer | 6x+ |
| Endeavour Silver | Mid-Tier Producer | 6x+ |
| Fresnillo | Senior Producer | 6x+ |
| Hochschild Mining | Mid-Tier Producer | 6x+ |
Every name in this list is projected to deliver returns exceeding 6x from current levels at a $200 silver price target. At current levels, the list as a whole is estimated to average approximately 8x returns, reflecting the fact that prices have not yet recovered to their January 2025 peaks.
Coeur Mining: The Market Mispricing Worth Understanding
Coeur Mining (CDE) is arguably the most instructive example of how institutional short-termism creates opportunity for long-term speculators. The company recently reported a quarter in which it generated $1.1 billion in revenue, $388 million in free cash flow, and was producing approximately $4 million per day in cash.
However, the stock was sold off roughly 8% on the day of the report because adjusted earnings per share missed consensus estimates by over 60%, driven by a slower-than-expected ramp-up at a newly acquired Canadian asset. The market's reaction illustrates a fundamental disconnect. The current free cash flow run rate for Coeur stands at approximately $1.5 billion annually, with a path to $2 billion if gold and silver prices increase modestly from current levels. At a purchase price in the low-to-mid teens, Coeur's modelled return at full cycle pricing prints as an 8-bagger, making it one of the highest-conviction names in the silver producer universe.
Hecla Mining as a Category Unicorn
Hecla Mining occupies a structurally unique position in the silver mining universe. It holds three quality silver mines in North American jurisdictions — a combination that does not exist anywhere else among listed silver producers. This scarcity value is not yet reflected in its valuation, largely because institutional capital has not yet rotated meaningfully into the sector. When broader Wall Street attention eventually arrives, Hecla is positioned as one of the first and most obvious purchases precisely because it offers quality, jurisdiction, and liquidity in a sector where all three simultaneously are genuinely rare.
Don Durrett's Top Gold Stock Picks: The Elite Eight
The Eight Senior Producers and Their Leverage Profile
The Elite Eight represents the top tier of global gold producers, comprising the names most likely to anchor institutional portfolios when precious metals sentiment recovers. At a $7,000 gold price target, each of these names is projected to deliver approximately 5x returns from current levels. For further detail, Don Durrett gold and silver mining stocks top picks are discussed in depth across various analyst forecasts and interviews.
| Company | Classification | Estimated Return at $7,000 Gold |
|---|---|---|
| Barrick Gold | Major Producer | ~5x |
| Newmont Corporation | Major Producer | ~5x |
| Gold Fields | Major Producer | ~5x |
| Kinross Gold | Major Producer | ~5x |
| Agnico Eagle | Major Producer | ~5x |
| AngloGold Ashanti | Major Producer | ~5x |
| Lundin Gold | Senior Producer | ~5x |
| B2Gold | Mid-Tier Producer | ~5x |
The significance of this data point is often underappreciated. These are the largest, most liquid, most analysed gold companies in the world. They have sell-side coverage, institutional ownership, and index inclusion. Yet even these names, under a conservative price scenario, are projected to deliver five times investors' money. If the largest and safest names in the sector return 5x, the leverage available in mid-tier producers, developers approaching construction, and near-term producers becomes extraordinary by comparison.
The next major ASX story will hit our subscribers first
The Broader Silver Stock Universe: From Producers to Developers
Undervalued Producers Currently on the Radar
Beyond the Mormons list, a wider universe of silver producers offers meaningful upside at lower absolute valuations:
- Avino Silver & Gold Mines
- Americas Gold and Silver
- Santacruz Silver Mining
- Guanajuato Silver
- Aya Gold & Silver
- Andean Precious Metals
Near-Term Producers With Emerging Cash Flow Profiles
- Silverco Mining
- Silver Mountain Mines
- Silver Storm Mining
- Andean Silver
Developer-Stage Companies With Significant Optionality
- Discovery Silver
- GoGold Resources
- Aftermath Silver
- Blackrock Silver
- Silver Tiger Metals
- Vizsla Silver
Developer-stage companies carry the highest execution risk but also the greatest leverage to rising silver prices. The key variables to monitor include construction financing timelines, permitting progress, capital expenditure estimates versus actuals, and the level of insider ownership relative to dilution risk.
Portfolio Architecture: Building a Gold and Silver Mining Stock Portfolio
The Pyramid Model
A disciplined portfolio structure for precious metals equity investing can be visualised as a pyramid, with stability at the base and speculative leverage at the apex:
| Portfolio Layer | Asset Type | Suggested Allocation |
|---|---|---|
| Base Layer | Physical metals, ETFs, mutual funds | Diversification anchor |
| Core Layer | Senior and mid-tier producers | 40-50% |
| Growth Layer | Developers (near-term and construction-stage) | 20-30% |
| Speculative Layer | Early-stage developers | 0-10% |
| Cash | Tactical reserve | ~2-3% maximum |
Explorers can be excluded entirely during a bull market. Exploration-stage companies exhibit inelastic behaviour relative to gold prices, meaning their stock performance is driven primarily by discovery news rather than metal price leverage. In a bear market, this inelasticity is an advantage. In a bull market, it is an opportunity cost. Producers and developers carry far higher elasticity to gold and silver prices, which is exactly the property investors should want maximum exposure to during the current cycle.
Optimal Portfolio Size and Emotional Discipline
A portfolio of 40 to 80 individual positions is the range that most effectively balances diversification against concentration risk while removing emotional decision-making from the process. Holding fewer than 40 positions creates large individual weightings that amplify the psychological impact of any single stock's underperformance. Holding more than 80 positions introduces complexity that most investors cannot manage practically.
The ride the train, buy the dips accumulation strategy involves maintaining minimal cash balances — a 3% cash position is considered the upper threshold of comfort — and systematically deploying capital during dips below the 200-day moving average in gold and silver. This approach applies a mechanical signal to entry timing, reducing the temptation to either chase momentum or panic during corrections.
The Biggest Risks in Junior Mining Stocks
Top Failure Modes for Developer-Stage Companies
- Premature acquisition at a low premium before full value realisation strips shareholders of their compounding upside.
- Construction financing failure, where an inability to secure project debt at viable terms prevents the transition from developer to producer.
- Capital expenditure overruns that erode net present value before first production, often triggered by commodity price inflation in steel, labour, and energy.
- Permitting delays in increasingly complex regulatory environments, particularly in jurisdictions with evolving environmental frameworks.
- Operational disruptions including equipment failure, flooding, mudslides, underground fires, or labour disputes.
- Management misalignment, most commonly expressed through low insider ownership, which creates an environment where management is incentivised to accept acquisition offers rather than build long-term shareholder value.
Consequently, one particularly striking observation from current market conditions: not a single silver developer has been acquired despite silver prices trading above $50 per ounce for approximately one year. This absence of M&A activity in developer-stage silver companies suggests either that acquirers do not believe current silver prices are sustainable, or that financing conditions are making construction commitments difficult to justify.
M&A Dynamics and the Consolidation Landscape
Who Is Buying and What It Means for Portfolio Construction
Mid-tier producers are the most active acquirers in the current cycle, driven by the need to replace depleting reserves and grow production ahead of an anticipated price environment that rewards scale. Owning both the buyer and the seller in any given transaction is an effective strategy for capturing the combined upside of consolidation, since the acquiring company typically gains operational and financial synergies that the market rewards over time.
Recent transactions illustrate the trend: Equinox Gold's acquisition of Orla Mining, First Majestic's acquisition of Gatos Silver, and Coeur Mining's acquisition of SilverCrest Metals all represent cases where the combined entity created more value than either component independently.
Australia stands out as an emerging consolidation hotspot, with a cluster of mid-tier producers that are increasingly acquiring one another as the sector matures. Canada, by contrast, has very few single-asset mid-tier producers, which creates a scarcity premium for names like Artemis Gold, Himmlow (carved out from Newmont), and West Coast Gold. When institutional capital eventually seeks Canadian gold exposure in quality jurisdictions, the limited supply of investable names at the mid-tier level should drive meaningful valuation re-ratings.
China's partial retreat from large-scale mining M&A — illustrated by Zijin Mining's withdrawal from a proposed multi-billion dollar acquisition after Beijing declined to approve the transaction — removes one category of strategic buyer from the market. This reduces near-term acquisition risk for developers that might otherwise have been targeted, while also limiting the price discovery that major cross-border deals typically generate.
Gold Versus Copper and Oil: The Fear Trade Versus the Growth Trade
Why Precious Metals Have the Better Setup in a Slowing Economy
The investment thesis for gold and silver relative to copper and oil is not a commentary on the long-term fundamentals of base metals. It is a positioning argument tied to a specific macro scenario. Understanding the gold-stock market relationship helps clarify why precious metals tend to outperform growth-sensitive commodities during periods of economic contraction.
Copper's demand story is tightly correlated with global GDP growth. Sustained global expansion at or above 2% annually is required for copper's industrial consumption to grow fast enough to drive the kind of structural price appreciation that mid-tier copper producers need to generate superior returns. If the macro thesis calls for economic deterioration, copper demand projections built on electrification and data centre build-out must be discounted substantially.
Oil faces a similar constraint. Energy demand in a recessionary environment declines, and oil's price correlation with global industrial activity makes it a poor hedge against the kind of economic deterioration that gold is specifically positioned to benefit from.
The core argument for overweighting gold and silver over copper and oil is not that base metals lack long-term merit. It is that their performance is tightly correlated with economic expansion. If the macro thesis calls for a slowing or recessionary environment, the fear trade in precious metals historically delivers superior risk-adjusted returns compared to growth-sensitive commodities.
The housing affordability crisis — where many people between the ages of 20 and 35 cannot afford home ownership without parental assistance — is not simply a social problem. It is a leading indicator of an economy whose productive capacity has been hollowed out by debt accumulation and the resulting misallocation of capital. These conditions do not resolve quickly. They tend to persist and deepen, which is precisely the environment in which the gold and silver thesis compounds most powerfully.
The Three Market Phases: Knowing When to Build, Hold, and Exit
Phase One: Maximum Opportunity, Minimum Sentiment
The current market environment represents Phase One, characterised by depressed valuations, poor sentiment, and widespread institutional indifference to the sector. This is the phase where the foundation of a multi-year portfolio is built. Stocks that will eventually be purchased aggressively by institutional money are available at prices that reflect scepticism rather than conviction.
Phase Two: Recovery and Leg Two
Phase Two corresponds to Leg Two of the bull market, during which sentiment begins to recover, valuations approach fair value, and returns accelerate. This phase is not the exit point. It is where the earlier foundation begins to compound visibly, and where the portfolio's structure proves its value. The key risk during Phase Two is chasing momentum in names that have already doubled, which compresses remaining upside rather than adding to it.
Phase Three: The Exit Signal
Phase Three is the mania phase, defined by high valuations, widespread retail participation, frothy free cash flow multiples, and the kind of sentiment that pushes even mediocre companies to elevated prices. This phase is projected to arrive around 2028. It is the exit window. The liquidity to sell junior mining positions at that stage will come from exactly the investors who are currently ignoring the sector: the retail capital that follows momentum and arrives late.
Frequently Asked Questions: Don Durrett Gold and Silver Mining Stocks Top Picks
How many gold and silver mining stocks does Don Durrett own?
Don Durrett holds approximately 168 positions across gold and silver mining companies, drawn from a personally constructed database covering around 870 companies globally.
What are Don Durrett's gold price targets?
Durrett uses $7,000 per ounce as a working conservative target for portfolio modelling, with a longer-term view that gold could reach $10,000 per ounce as monetary and economic conditions deteriorate further.
What is Don Durrett's silver price target?
His current modelling uses $200 per ounce as a conservative silver price target, which he incrementally revises upward as prices rise.
Is it better to buy gold mining ETFs or individual stocks?
For most retail investors, ETFs offer a simpler path to 4x to 5x returns without requiring deep analytical expertise. Individual stock selection is suited to speculators willing to build diversified portfolios of 40 to 80 names and accept higher volatility in pursuit of 10x to 20x returns.
What is the Mormons list in Don Durrett's strategy?
The Mormons list refers to a curated group of elite silver mining companies — including Hecla, Coeur, Pan American Silver, First Majestic, Endeavour Silver, Fresnillo, and Hochschild — selected for their quality, jurisdiction, and leverage to rising silver prices. Every name in the list is projected to return over 6x at $200 silver.
How should investors approach interpreting drill results for developer stocks?
Interpreting drill results is a critical skill for anyone evaluating developer-stage companies. Understanding grade, width, and continuity helps determine whether a discovery has genuine economic merit before committing capital.
What role does a definitive feasibility study play in developer selection?
A definitive feasibility study is a key milestone for any developer approaching construction-readiness. It provides detailed cost estimates, resource confidence, and the financing foundation that transitions a project from speculative to bankable.
When should investors sell their gold and silver mining stocks?
According to this framework, the exit signal comes during Phase Three, characterised by high valuations, widespread retail participation, and mania-like sentiment conditions. This phase is not expected to materialise until approximately 2028.
Key Statistics Reference Table
| Metric | Data Point |
|---|---|
| Gold Leg One Peak | ~$5,600/oz (January 2025) |
| Gold Correction Magnitude | ~29% from peak |
| Silver Correction Magnitude | ~55% from peak |
| Gold Correction Target Before Leg Two | ~$3,750/oz |
| Conservative Gold Price Target | $7,000/oz |
| Long-Term Gold Price Target | $10,000/oz |
| Silver Price Target | $200/oz |
| Projected ETF Returns (Gold Miners) | ~4x from current levels |
| Projected ETF Returns (Silver Miners) | ~5x from current levels |
| Mormons List Projected Return | 6x+ per stock at $200 silver |
| Elite Eight Projected Return | ~5x per stock at $7,000 gold |
| Recommended Portfolio Size | 40-80 individual positions |
| Recommended ETF Allocation Per Position | 2-5% maximum |
| Producer Allocation Target | 40-50% of portfolio |
| Developer Allocation Target | 20-30% of portfolio |
| Coeur Mining Free Cash Flow Run Rate | ~$1.5 billion annually |
Disclaimer: This article is for informational and educational purposes only and does not constitute financial advice. All price targets, return projections, and market forecasts referenced represent the views of the investor discussed and are speculative in nature. Past performance of any investment strategy or asset class does not guarantee future results. Precious metals investments, including mining equities, carry significant volatility and risk of capital loss. Readers should conduct their own research and consult a licensed financial adviser before making any investment decisions.
Want to Know When the Next Major Mineral Discovery Hits the ASX?
Discovery Alert's proprietary Discovery IQ model delivers real-time alerts on significant ASX mineral discoveries, turning complex mineral data into actionable insights for both short-term traders and long-term investors — explore the historic returns major discoveries have generated and begin your 14-day free trial to position yourself ahead of the market.