June 20, 2026
Why Sovereign Debt Cycles Have Always Preceded the Greatest Precious Metals Bull Markets
Throughout monetary history, the periods of most dramatic appreciation in gold and silver have not emerged from isolated geopolitical shocks or short-term inflation spikes. They have emerged from the slow, structural erosion of confidence in sovereign debt sustainability. The 1970s bull market in gold did not begin with Nixon closing the gold window in 1971. Today, a structurally similar dynamic is unfolding at a far greater scale, and understanding it is the essential foundation for evaluating the Don Durrett gold and silver price outlook.
When big ASX news breaks, our subscribers know first
Why the Structural Debt Crisis Is the Real Driver Behind Gold's Bull Market
The Doom Loop Defined: When Sovereign Debt Becomes Self-Reinforcing
The concept of a fiscal doom loop is not widely understood outside specialist economics circles, yet it is arguably the single most important framework for interpreting gold's long-term trajectory. When sovereign debt reaches a critical mass relative to GDP, interest servicing begins consuming an expanding share of government revenues. This is not a linear problem. It compounds, because higher debt levels require more borrowing, which generates more interest obligations, which require still more borrowing.
Furthermore, the data from the past two decades illustrates the acceleration of this dynamic with uncomfortable clarity:
| Country/Region | Debt-to-GDP (2005) | Debt-to-GDP (2025) | Change |
|---|---|---|---|
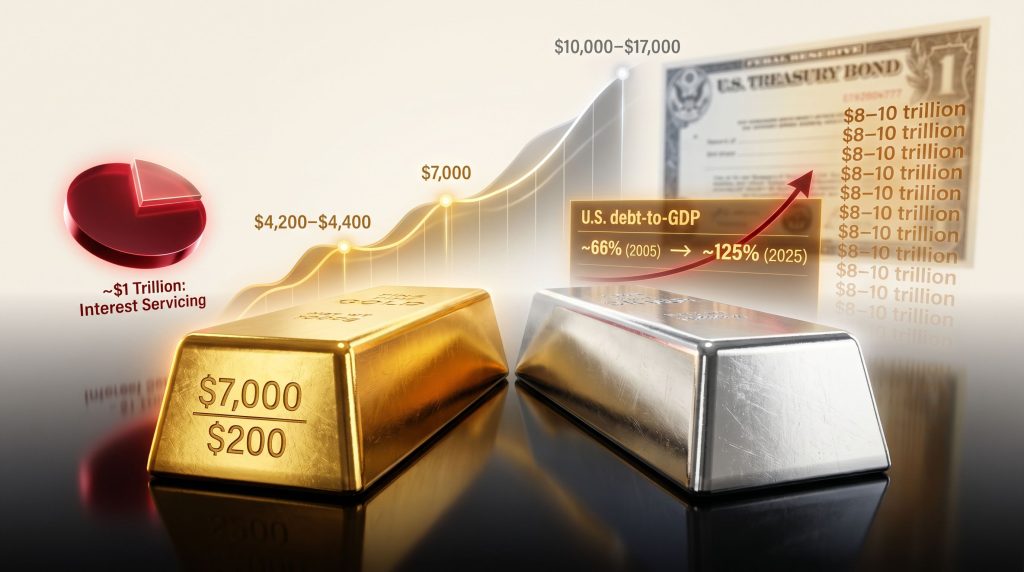
| United States | ~66% | ~125% | +59 pts |
| Japan | ~180% | ~200%+ | +20+ pts |
| Global Average | ~68% | ~95% | +27 pts |
Japan's experience after 1989 is frequently cited as the structural template for what advanced economies face once debt spirals past a critical threshold. Japan entered a prolonged period of suppressed growth because servicing obligations crowded out productive investment. It never fully escaped. Durrett's thesis is that the United States is now entering an analogous, if not more severe, version of that trap — a classic sovereign debt crisis unfolding in slow motion.
The arithmetic is already stark. The U.S. federal government is currently spending approximately $7 trillion annually, while collecting roughly $5 trillion in tax revenues. Of that spending, approximately $1 trillion is allocated purely to interest payments on existing debt. That means 20% of every dollar raised in taxes disappears immediately into debt servicing, before a single government service is funded.
"When a sovereign government must roll over $8 to $10 trillion in short-term debt annually while simultaneously running structural deficits, the bond market becomes the primary systemic risk, not inflation alone. The inflation problem is a consequence of the bond problem, not the cause of it."
The relevance of this analysis to precious metals is direct. When governments cannot grow their way out of debt and cannot cut spending without triggering economic contraction, the only remaining lever is monetary expansion. That expansion, over time, structurally degrades fiat currency purchasing power and historically elevates gold as the preferred store of value.
How U.S. Bond Market Fragility Is Reshaping the Gold Investment Case
The Short-End Debt Trap: Why Long-Duration Borrowing Has Become Unviable
With the 10-year Treasury yield approaching 4.6% and the 30-year yield exceeding 5%, the U.S. government faces a structural problem that is rarely discussed plainly in mainstream financial media. At those yield levels, issuing long-duration debt carries an interest cost that simply cannot be sustainably serviced given the existing fiscal trajectory. The interplay between these pressures and broader gold and bond dynamics is a critical dimension of the current investment landscape.
The practical consequence is a forced reliance on short-term debt instruments that must be continuously rolled over. This year alone, approximately $8 trillion in existing debt must be refinanced, on top of new borrowing requirements. Even if net new debt appears manageable on a headline basis, the refinancing process requires extracting enormous sums from capital markets every single quarter. If private investors step back and the government is forced to monetise that rollover demand through money creation, the inflationary consequences accelerate rapidly.
This is precisely the scenario that Durrett identifies as the catalyst for gold's next major leg higher. It is not necessarily a sudden collapse. It is more likely a gradual deterioration of bond market confidence that forces monetary authorities into increasingly aggressive accommodation.
M2 Money Supply Expansion and the Inflation Ceiling Problem
M2 money supply has continued its upward trajectory through 2024 and into 2025. The critical constraint in Durrett's framework is the 5% inflation threshold. Once consumer price inflation breaches that level, the ability to continue monetary expansion becomes severely constrained, because further money printing at 5% inflation risks an uncontrolled acceleration toward 8% and then 10%, at which point currency credibility itself is at risk.
This creates a paradox that sits at the heart of the current macro environment:
- Money printing is the primary lever available to sustain economic growth under heavy debt loads.
- However, money printing is self-limiting once inflation approaches 5%, because beyond that threshold the cure becomes worse than the disease.
- The Fed is therefore managing economic growth, not inflation, as its primary objective. Inflation is, in Durrett's framing, largely an afterthought for policymakers who face a grow-or-die fiscal dynamic.
- Passive investing compounds the instability. In a market dominated by passive flows, a mass exit event has no natural buyer on the other side, creating the conditions for a 1987-style gap-down event.
The implications for gold ownership are significant. If the Fed cannot raise rates to control inflation without triggering a fiscal catastrophe, and cannot print money without risking currency destruction, gold functions as the only asset class that benefits from both failure modes.
What Are Don Durrett's Gold Price Targets for 2025 and Beyond?
Near-Term Price Floor Analysis: Where Gold May Find Its Next Cycle Low
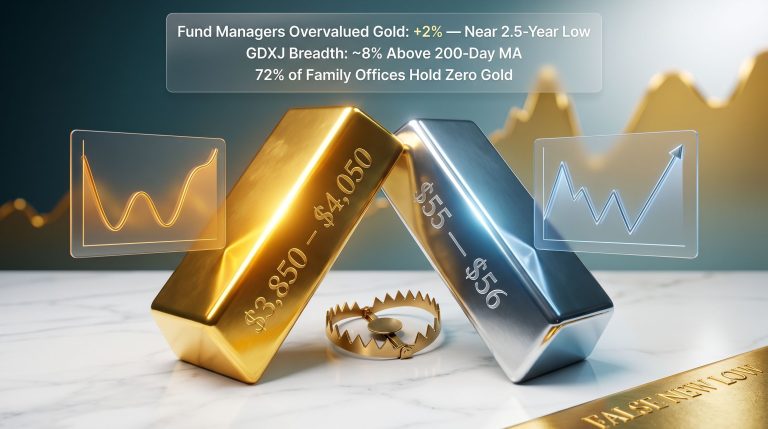
Durrett identifies himself as what observers have called the most bearish bull in the precious metals space. This label captures an important nuance: being structurally bullish over a two to three year horizon while remaining analytically honest about near-term correction risk. Gold safe-haven demand remains a structural constant throughout, regardless of short-term volatility.
Using the 200-day moving average as his primary technical anchor, currently positioned at approximately $4,342, Durrett's expected near-term consolidation range for gold sits between $4,200 and $4,400 per ounce. This range represents his anticipated next cycle low, not a trend reversal. He notes that four consecutive down days in gold are sufficient to drag silver sharply lower, given the structural relationship between the two metals. When gold declined approximately $100 in a single session, silver at $87 rapidly pulled back to $77, illustrating the sensitivity of the relationship.
For investors with a multi-year horizon, these near-term moves are, in Durrett's framing, simply buying opportunities within a larger structural uptrend.
Medium-to-Long-Term Gold Price Projections
The core of the Don Durrett gold and silver price outlook is built around several clearly differentiated price scenarios:
| Time Horizon | Price Range | Key Driver |
|---|---|---|
| Near-term (0–6 months) | $4,200–$4,400 (cycle low) | Technical correction, 200-DMA retest |
| Medium-term (6–18 months) | $5,000–$6,000 | Bond market stress, central bank buying |
| Long-term bull case | $7,000–$8,000 | Debt doom loop, fiat debasement |
| Speculative mania phase | $10,000–$17,000 | Currency reset, systemic confidence loss |
The $7,000 level is characterised not as a spike-and-retreat target but as a structural destination that the market is likely to reach and hold. Durrett describes it as a near-inevitable outcome given current debt dynamics. The more speculative upper bounds, including the $17,000 figure cited by analysts such as Egon von Greyerz and Pierre Lassonde, are acknowledged as possible mania-phase outcomes rather than dismissed as implausible.
"The critical distinction in Durrett's framework is not simply reaching $7,000 gold, but sustaining it. A run to $7,000 followed by a collapse back to $5,000 provides far less compounding benefit to mining equities than a sustained hold above that level, which is what re-rates the entire sector on a durable basis."
What Is Don Durrett's Silver Price Outlook and How Does It Relate to Gold?
Understanding the Gold-Silver Relationship: Why Gold Leads
One of the more counterintuitive elements of the Don Durrett gold and silver price outlook is his insistence that silver cannot and will not lead the precious metals bull market. The reasoning is structural rather than sentimental.
Central banks globally purchase approximately 25% of annual gold supply as part of formal reserve management strategies. Silver is almost entirely excluded from this institutional demand profile, with Russia representing a notable but minor exception. Gold's market is larger, more liquid, and more directly embedded in sovereign monetary frameworks. Silver, by contrast, is primarily an industrial and investment metal with a smaller and more volatile market.
Durrett frames this relationship memorably: gold leads as the primary monetary signal, while silver amplifies gold's directional moves with greater velocity once the trend is established. Silver's short-term moves are therefore best understood as a function of gold's trajectory rather than as independently meaningful signals.
The Silver-to-Gold Ratio Framework for Forecasting Silver Prices
Rather than using the more commonly referenced gold-to-silver ratio, Durrett employs the silver-to-gold ratio (SGR), which expresses silver's price as a simple percentage of gold's price. In addition, this framing makes the mathematics intuitive and scalable across price scenarios. For broader context, a thorough gold-silver ratio analysis provides additional perspective on how these dynamics have evolved historically.
The historical reference point is 2011, when silver reached approximately 3% of gold's price. The current SGR sits at roughly 1.7 to 2% at prevailing prices.
SGR-Based Silver Price Projections at Various Gold Levels:
| Gold Price | SGR 1% | SGR 2% | SGR 3% |
|---|---|---|---|
| $7,000 | $70 | $140–$150 | $210 |
| $8,000 | $80 | $160 | $240 |
| $10,000 | $100 | $200 | $300 |
Using a 2 to 3% SGR applied to a $7,000 gold scenario, Durrett's working base case silver target is $150 to $200 per ounce. He uses $7,000 gold and $200 silver as his conservative working assumptions for valuing mining stocks, describing these inputs as deliberately understated relative to what he considers the more likely outturn. At $8,000 gold with a 3% SGR, silver would reach $240. At $10,000 gold with a 3% SGR, silver reaches $300. The speculative mania-phase scenario of $300 to $500 silver is considered possible but not used as a base case for investment modelling.
Near-Term Silver Price Floor and Consolidation Range
The 200-day moving average for silver sits at approximately $64 per ounce. Durrett's near-term support range spans $58 to $68, with a potential retest of the 200-DMA considered live within the current year. His open order on the silver miners ETF SILJ is positioned at approximately $27, having declined from the $34 range toward $30 within a single session at the time of discussion.
Short-term weakness in silver is framed entirely as an accumulation opportunity rather than a structural warning signal.
What Is Driving China and Global Silver Demand and Why It Matters
China's Strategic Silver Accumulation: A Structural Supply Signal
One of the more significant and underreported data points in the silver market is the scale of China's recent net import activity. China's silver imports have reached their highest volumes in over two decades, while simultaneously the country has reduced its silver exports by approximately 25 to 30%.
The significance of this shift becomes clear when understood in the context of China's role in global silver refining. China processes substantial ore volumes originating from major producing nations including Peru and Mexico, refines the silver, and historically re-exported much of the refined product back into global markets. The reduction in export volumes means that refined silver which previously re-entered the global supply chain is now being retained domestically.
This represents a structural withdrawal from global silver supply at the refining stage, not merely at the consumption stage.
Global Inventory Depletion Trends
The supply-side picture is compounded by deteriorating exchange inventories. Both COMEX silver holdings and LBMA silver stockpiles have been on declining trends. India and Russia represent additional sources of sovereign-level silver demand that are incrementally tightening the available float.
Durrett's assessment is that these inventory dynamics do not independently drive silver prices. They function as a multiplier once gold establishes directional momentum. His expectation is that when gold trends toward $7,000, silver will outperform gold's percentage move by approximately 2 to 1, driven by both the monetary tailwind from gold and the physical tightness in the silver market.
"The divergence between tightening physical silver markets and current paper price levels is a pattern that has historically preceded sharp upside moves. Physical scarcity rarely translates immediately into price action, but when the monetary catalyst arrives in the form of sustained gold strength, the repricing can be rapid and disproportionate."
The next major ASX story will hit our subscribers first
Is the Stock Market in a Bull Market or a Topping Process?
The Case That Equity Markets Are in a Terminal Rally Phase
Durrett's view on equities is unambiguous and worth understanding as context for his precious metals thesis. He characterises the current stock market environment as a melt-up rather than a genuine bull market, describing new highs as representing a final speculative surge before a structural reversal.
Several structural arguments underpin this position:
- The business cycle has not been eliminated. It has been repeatedly deferred through liquidity injections, but its eventual reassertion is treated as a certainty.
- Passive investing creates systemic fragility. When passive flows dominate markets, there is no natural buyer on the other side of a mass exit event. A 1987-style gap-down of 20% in a single day is presented as structurally plausible.
- The K-shaped economy dynamic means that the inflation and asset volatility that accompanies a reset disproportionately impacts middle and lower-income cohorts, while precious metals ownership provides structural protection for those positioned accordingly.
- Geopolitical variables, particularly active conflict scenarios, represent wildcards that could accelerate or temporarily delay the next major directional move in metals.
Gold and silver are explicitly contrasted with equities in this framework. Equities are characterised as a falling knife environment for new buyers. Gold and silver are characterised as buy-the-dip assets within a confirmed structural uptrend.
How Should Investors Evaluate Gold and Silver Mining Stocks Using a Valuation Framework?
The Bagger Framework: Categorising Miners by Return Potential
Durrett applies a disciplined probabilistic framework to mining stock selection that differs significantly from conventional equity analysis. Rather than targeting absolute return multiples without weighting for base rates, he assigns probability-adjusted success rates to each category of mining company. Consequently, identifying undervalued mining stocks becomes a systematic process rather than a speculative exercise.
| Category | Approx. Success Rate | Typical Return Potential | Key Risk |
|---|---|---|---|
| Exploration | ~10% | 20–50x (if successful) | Discovery failure |
| Development | ~25% | 10–15x | Permitting, financing, ramp-up |
| Producer (quality) | ~50% | 4–8x | Operational, jurisdiction |
| Major (Top 8) | Higher | 2–4x | Limited leverage to price |
This framework leads to a clear preference hierarchy. For development plays, he targets a minimum of 10 times upside to compensate for the approximately 25% success rate. For producers, a 50% success rate justifies accepting 4 to 8 times upside if the asset quality and jurisdiction warrant it. For exploration plays, the 10% success rate means only the most asymmetric setups justify position sizing. You can explore his full methodology for valuing gold and silver mining stocks in greater depth.
The Direct Strategy: A Capital Return Framework for Mining Producers
One of the more distinctive and practically applicable elements of Durrett's investment philosophy is what he calls the Direct Strategy, a structured capital return methodology originally derived from observing Kirkland Lake Gold's approach prior to its acquisition. The framework consists of five components executed in sequence and maintained consistently over multiple quarters:
- Clean balance sheet with zero debt and substantial cash reserves, targeting $2 to $5 billion for mid-tier majors.
- High free cash flow generation through low all-in sustaining costs and disciplined development spending.
- Elevated dividend yield targeting 4% or higher.
- 50% free cash flow return distributed quarterly to shareholders via dividends and buybacks.
- Transparent and sustained public commitment to the above policy, maintained visibly for at least three consecutive quarters to build market credibility.
"Companies that execute all five components consistently have demonstrated the ability to expand their free cash flow multiples from single digits to 20 to 25 times, representing a 3 to 5 times re-rating that is independent of the underlying metal price move. The strategy rewards discipline as much as asset quality."
The practical insight here is that many mining companies pay 1% dividends and return 25% of free cash flow, which Durrett argues is insufficient to drive meaningful multiple expansion. The threshold effects of 4% dividends and 50% return ratios appear to be qualitatively different in terms of how the market reprices the equity. Lundine Mining is cited as a company that has publicly moved toward implementing this approach, committing to approximately 50% free cash flow return at a 7% dividend yield.
The Equinox-Orla Merger: A Case Study in Strategic Consolidation
Why Merger-of-Equals Transactions Create Compounding Value in a Rising Gold Market
The merger between Equinox Gold and Orla Mining represents a textbook example of the type of consolidation Durrett actively seeks within his portfolio. Both companies independently modelled as six-times return opportunities at $7,000 gold prior to the combination. The merger creates a combined entity that, in his assessment, has the potential to reach seven to eight times upside with a credible pathway to ten times if the production growth pipeline and acquisition strategy are executed effectively.
The combined production profile is substantial:
- Canada: approximately 700,000 ounces annually across the Greenstone and Valentine mines (450,000 oz) and Orla's Musselwhite contribution (235,000 oz).
- United States: approximately 75,000 ounces.
- Mexico: approximately 115,000 ounces.
- Nicaragua: approximately 225,000 ounces.
- Total: approximately 1.1 million ounces per year.
Proven and probable mineral reserves stand at 22.7 million ounces, with measured and indicated resources of 25.1 million ounces. A near-term production growth pathway toward 800,000 ounces from existing assets alone is identified as achievable without major new capital commitments.
How the Combined Entity Unlocks the Direct Strategy
The merger's most important strategic implication, in Durrett's framework, is that it substantially elevates Equinox's free cash flow profile, which in turn creates the conditions necessary to implement the Direct Strategy at scale. Pre-merger AISC was already below $2,000 per ounce. Post-merger, the integration of Orla's lower-cost assets is projected to drive AISC toward $1,750 to $1,800 per ounce.
The current free cash flow multiple of approximately 7 times is seen as a starting point, with a credible pathway to 25 times under disciplined capital return execution. At $7,000 gold, the combined entity is modelled as a 7 to 8 times return opportunity, with additional upside if the acquisition pipeline, including the Los Filos project and potential Canadian development asset acquisitions, is executed successfully. Durrett notes the management team has demonstrated the characteristics of a consolidator, suggesting the company could grow from its current 1 million ounces toward 2 to 3 million ounces through disciplined cherry-picking of development projects.
Silver Development Plays: Applying the Valuation Tool in Practice
How the Modelling Framework Identifies Asymmetric Opportunities
Durrett's proprietary valuation tool, which he developed to model mining company outcomes across multiple price and cost scenarios, provides a useful illustration of how the bagger framework operates in practice. The tool allows inputs including projected annual production, AISC, diluted share count, price assumptions, and valuation multiples to generate a price target range from conservative to aggressive scenarios. For those wishing to explore data-driven mining analysis further, GoldStockData offers a useful resource for tracking mining company metrics.
Vizla Silver's Panuco project in Mexico provides a compelling illustration of this methodology. The project is characterised by several features that Durrett identifies as rare in the silver development space:
- Annual production capacity of approximately 18 to 20 million ounces of silver.
- An AISC of approximately $11 per ounce at current estimates.
- Projected free cash flow exceeding $1 billion per year at $200 silver, potentially reaching $1.5 to $2 billion as silver prices rise.
- A market capitalisation of approximately $250 million at recent prices, creating extraordinary leverage to production outcomes.
Running the valuation tool at $200 silver with an 18-multiple and costs rising to $30 AISC produces a price target of approximately $137 per share. Under conservative assumptions using a 15-multiple and $35 AISC, the price target declines to approximately $112. Even at $150 silver, the implied price target remains approximately $78, illustrating that the mathematics remain compelling across a wide range of scenario assumptions.
The primary risks are permit timing in Mexico and the possibility of a sale or merger that captures only a fraction of the long-term upside. Durrett considers the probability of permit issuance within the current year to be meaningful, which would represent a substantial catalyst for a stock he characterises as having been abandoned by most investors following a period of operational uncertainty.
Large, high-grade, low-cost silver deposits are described as genuinely rare in the global mining landscape, approximating unicorn status in terms of the combination of scale, economics, and build-readiness. Finding one trading at a market capitalisation of $250 million, against projected annual free cash flow of over $1 billion at conservative silver prices, is the type of asymmetric setup that the bagger framework is specifically designed to identify.
FAQ: Don Durrett Gold and Silver Price Outlook
What is Don Durrett's current gold price target?
Durrett's conservative long-term gold price target is $7,000 per ounce, which he views as a near-certain destination given current debt dynamics. His extended bull case includes $8,000 to $10,000, with a speculative mania-phase ceiling of $17,000 not dismissed as implausible.
What is Don Durrett's silver price forecast?
At $7,000 gold, Durrett's base case silver target is $150 to $200 per ounce, derived from a silver-to-gold ratio of 2 to 3%. He uses $200 silver as his working assumption for mining stock valuations, which he considers conservative relative to the more likely outturn.
Why does Don Durrett think gold will go higher?
His core thesis centres on the U.S. sovereign debt doom loop: interest payments consuming approximately 20% of tax revenues, forced short-term debt rollovers of $8 to $10 trillion annually, and the structural impossibility of resolving this without either monetisation or default. Both outcomes historically support gold as a store of value.
What does Don Durrett think about silver versus gold?
He views gold as the primary driver of the precious metals bull market, with silver as a high-leverage amplifier. Silver is expected to outperform gold by approximately 2 to 1 when gold trends toward $7,000, but it will not lead the move independently.
Is Don Durrett bearish short-term on gold and silver?
He identifies as a self-described most bearish bull, acknowledging near-term correction risk while remaining strongly bullish over a two to three year horizon. Near-term dips toward the 200-day moving average are characterised as accumulation opportunities rather than warning signals.
What mining stock valuation methodology does Don Durrett use?
Durrett applies a bagger-based framework prioritising a minimum of 10 times upside for development plays and 4 to 8 times for quality producers. He uses a proprietary scenario modelling tool that inputs projected ounces, AISC, share counts, and valuation multiples to generate conservative and aggressive price target ranges under his base case metal price assumptions.
This article is for informational and educational purposes only and does not constitute financial or investment advice. All price targets, projections, and scenario analyses discussed represent the views of Don Durrett as expressed through publicly available interview content and should not be interpreted as guarantees of future performance. Precious metals and mining equities involve significant risk, including the potential loss of capital. Readers should conduct their own due diligence and consult a licensed financial advisor before making any investment decisions.
Want to Know When the Next Major Precious Metals Discovery Hits the ASX?
Discovery Alert's proprietary Discovery IQ model scans ASX announcements in real time, delivering instant alerts on significant mineral discoveries — including gold and silver — so investors can act ahead of the broader market, much like early investors in De Grey Mining and WA1 Resources were able to do. Explore Discovery Alert's dedicated discoveries page to see how historic mineral discoveries have generated exceptional returns, and begin your 14-day free trial today to position yourself at the forefront of the next major find.