May 21, 2026
When Two Commodity Cycles Move in Opposite Directions, Integrated Miners Win
The platinum group metals sector spent much of 2024 and early 2025 navigating one of its most challenging stretches in recent memory. Palladium prices weakened sharply as electric vehicle adoption narratives disrupted autocatalyst demand assumptions, while chrome concentrate markets faced an oversupply dynamic that compressed margins across Southern African producers. For any miner reliant on a single revenue stream, that environment would have been punishing. For a dual-commodity producer with a vertically integrated processing model, it created something different: a severely depressed earnings baseline and, by extension, the conditions for a dramatic financial recovery once markets began to rebalance.
That recovery dynamic is precisely what defines the Tharisa first-half net profit increase for the six months ended March 31, 2026, and understanding it fully requires looking beyond the headline percentage figures to examine the commodity mechanics, operational architecture, and capital deployment strategy that made such a turnaround possible.
When big ASX news breaks, our subscribers know first
The Numbers Behind the Recovery: H1 FY2026 Financial Performance
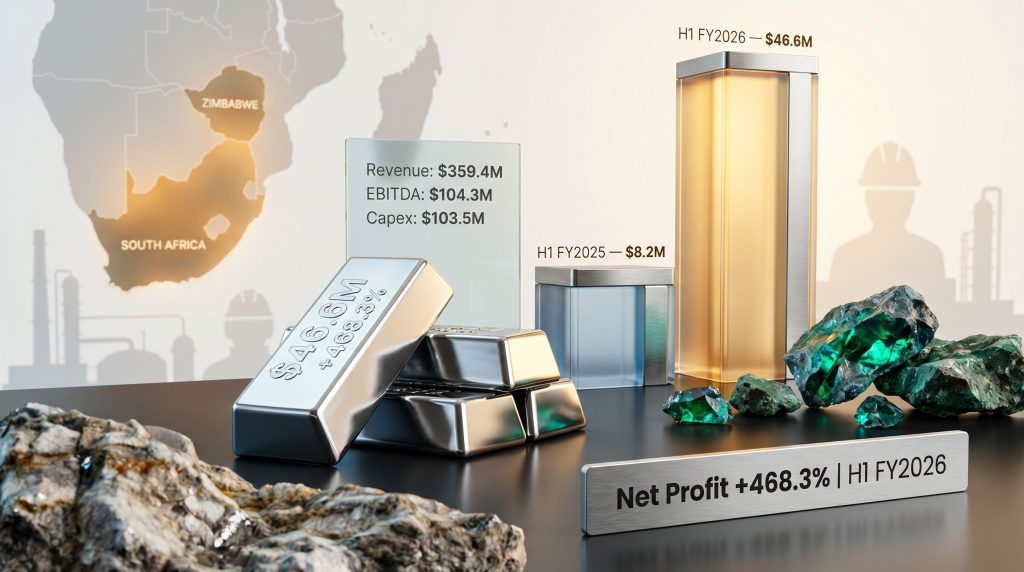
Tharisa's headline result for the first half of FY2026 was a 468.3% year-on-year increase in net profit after tax, rising from $8.2 million in H1 FY2025 to $46.6 million in the current period. Revenue climbed 28% to $359.4 million, while EBITDA expanded 138.1% to $104.3 million. Operating cash generation reached $96.4 million, a 167.8% improvement on the prior corresponding period.
Summary Financial Metrics: H1 FY2026 vs H1 FY2025
| Financial Metric | H1 FY2026 | H1 FY2025 | YoY Change |
|---|---|---|---|
| Revenue | $359.4 million | $280.8 million | +28.0% |
| EBITDA | $104.3 million | ~$43.8 million (est.) | +138.1% |
| Net Profit After Tax | $46.6 million | $8.2 million | +468.3% |
| Net Cash from Operations | $96.4 million | ~$36.0 million (est.) | +167.8% |
| Capital Expenditure | $103.5 million | N/A | — |
Investors and analysts should approach these figures with important context in mind. The prior period was characterised by a 13.6% decline in PGM ounces sold and a 12.2% fall in realised metallurgical chrome prices, both of which combined to produce a near-floor earnings result. The magnitude of the percentage rebound is therefore a mathematical function of that depressed base, as much as it is a reflection of genuine operational improvement.
That said, the absolute profit of $46.6 million on revenues of $359.4 million represents a materially healthier business than the prior-year figures suggest, and the EBITDA margin expansion confirms that the recovery is real, not cosmetic. For a fuller picture of how these results compare against broader sector trends, Tharisa's interim results booklet provides detailed operational and financial commentary.
Disclaimer: Financial comparisons involving high percentage changes over low base periods should be interpreted alongside absolute figures. Past performance is not indicative of future results. This article does not constitute financial advice.
Understanding the Low Base Effect in PGM and Chrome Markets
One of the less commonly understood dynamics in mining sector analysis is the compounding effect of simultaneous multi-commodity downturns on a dual-producer's reported earnings. Most earnings commentary focuses on individual commodity price movements, but Tharisa's H1 FY2025 result was particularly compressed because both of its major revenue streams declined at the same time, and in material quantum.
The chrome concentrate market, which feeds global stainless steel production, experienced pricing pressure through 2024 driven by Chinese demand uncertainty and expanding South African supply. Meanwhile, platinum and palladium dynamics in PGM markets reflected structural questions about palladium's long-term role as battery electric vehicle penetration accelerated in key markets, weighing on forward pricing. These headwinds did not merely reduce revenue; they interacted with fixed cost structures to disproportionately deflate net profit, creating the $8.2 million result that now serves as the comparison point for the current half.
What makes the H1 FY2026 recovery particularly instructive is that it does not appear to rely on a single-commodity rebound. The 28% revenue increase suggests improved pricing or volume across the combined product suite, reinforcing the structural advantage of operating across two distinct commodity markets.
Vertical Integration and Beneficiation: The Margin Architecture That Others Miss
Most mining companies sell ore or basic concentrate. Tharisa's business model is built around a different principle: extracting progressively higher value from each tonne of material processed, through beneficiation, before reaching the market. This distinction matters enormously for margin analysis.
In the PGM and chrome context, beneficiation refers to the physical and chemical upgrading of raw ore into higher-grade concentrates that command premium pricing and attract a broader set of end buyers. For chrome, this can mean producing metallurgical-grade or chemical-grade concentrates rather than run-of-mine ore. For PGMs, it means refining towards higher purity outputs that serve autocatalyst manufacturers, hydrogen technology producers, and electronics applications.
The operational leverage framework created by this approach functions as follows:
| Driver | Mechanism | Margin Impact |
|---|---|---|
| Beneficiation intensity | Higher-value output per tonne processed | Positive |
| Dual-commodity revenue | PGM and chrome price diversification | Risk-reducing |
| Underground development | Resource life and grade extension | Long-term positive |
| Fixed cost absorption | Higher revenue base against stable fixed costs | Positive |
| Integrated processing | Reduced third-party processing dependency | Cost-positive |
The 138.1% EBITDA expansion on a 28% revenue increase is the clearest evidence of this operational leverage in action. When both commodity streams recover simultaneously, the integrated model amplifies the earnings response in a way that a simpler, single-product mining operation cannot replicate.
It is also worth noting that Tharisa operates both products from a single ore body at its flagship Tharisa Mine in South Africa's Bushveld Igneous Complex, the world's most significant PGM-bearing geological formation. This geological co-location means that processing infrastructure costs are shared across two revenue streams, structurally lowering the per-unit cost of production for each commodity relative to a standalone operation. This is a technical advantage that rarely features prominently in mainstream coverage of the company.
Capital Allocation in a High-Investment Phase
Total capital expenditure of $103.5 million for the half-year period places Tharisa in what capital cycle analysts would describe as a high-investment phase, where near-term free cash flow generation is deliberately subordinated to longer-duration asset creation.
The capital deployment breaks into two primary streams:
- Karo Platinum Project (Zimbabwe): $21.4 million allocated during the period, representing continued development investment in Tharisa's most significant geographic diversification initiative.
- Underground development at Tharisa Mine (South Africa): The balance of capex directed toward extending access to deeper ore zones, sustaining production grades, and extending the operational life of the flagship asset.
With $96.4 million in operating cash flow against $103.5 million in capital expenditure, Tharisa is running a slight free cash flow deficit during this phase. This is a deliberate posture, consistent with industry norms during major project development cycles, and should be assessed against the longer-term production and revenue potential being created rather than treated as a near-term financial weakness.
Furthermore, mining industry consolidation trends across the sector suggest that well-capitalised producers investing in asset development during trough periods are better positioned to capture value as market conditions improve.
For investors evaluating mining companies in growth phases, the relevant metric is not free cash flow in isolation, but the ratio of capital deployed to the expected net present value of assets under construction. High capex periods in well-structured mining businesses frequently precede step-changes in production capacity and earnings power.
The Karo Platinum Project: Geographic Diversification Into Zimbabwe
The Karo Platinum Project in Zimbabwe represents Tharisa's expansion beyond South Africa's Bushveld Complex into the Great Dyke, Zimbabwe's principal PGM-hosting geological structure. The Great Dyke is a layered intrusion running approximately 550 kilometres through Zimbabwe, and while it has long been recognised as a significant PGM province, development activity has historically been more limited than in South Africa's Bushveld.
Tharisa's investment in Karo reflects a thesis that the Great Dyke's underdevelopment relative to its geological endowment represents a long-duration opportunity for early movers. The $21.4 million allocated during H1 FY2026 is part of a multi-year development commitment, and the project is positioned as a cornerstone of Tharisa's multi-generational growth narrative, though investors should note that development timelines and capital requirements for greenfield PGM projects of this scale are subject to meaningful uncertainty.
PGMs and Chrome as Critical Minerals: What the Classification Actually Means
Both platinum group metals and chromium appear on critical minerals registers maintained by the European Union, the United States, and several other major economies. Understanding why this classification exists, and what it does and does not mean for producers, is important context for anyone assessing the long-term demand thesis for these commodities.
Critical Mineral Demand Drivers: Comparative Overview
| Commodity | Primary Use Case | Energy Transition Role | Technology Relevance |
|---|---|---|---|
| Platinum | Catalytic converters, hydrogen fuel cells, jewellery | High | Moderate-High |
| Palladium | Autocatalysts, electronics, dental | Moderate | High |
| Rhodium | Emissions control catalysts | High | Low |
| Chrome | Stainless steel, superalloys, tanning | Moderate (renewable infra) | Low-Moderate |
Several demand drivers for PGMs are less widely understood than the conventional autocatalyst narrative. In addition, PGM supply constraints on the production side are compounding the demand picture, making the medium-term outlook increasingly complex for analysts to model. Key demand drivers include:
- Hydrogen electrolysers and fuel cells use platinum as a catalyst in proton exchange membrane (PEM) technology. As green hydrogen production scales globally, platinum demand from this application is projected to grow significantly, though timelines remain debated.
- AI infrastructure creates indirect PGM demand through electronics manufacturing, particularly palladium's role in multilayer ceramic capacitors (MLCCs) used in servers, power management systems, and high-frequency computing hardware. This connection between AI buildout and PGM demand is not widely recognised by generalist investors.
- Chrome's role in renewable energy infrastructure extends beyond stainless steel into superalloys used in wind turbine components and structural materials for solar installations, creating an underappreciated renewable energy linkage for the commodity.
Consequently, critical minerals demand across these categories is increasingly shaped by policy frameworks and strategic supply security considerations, not just conventional end-user purchasing patterns. Critical mineral classification does not, by itself, guarantee price support or demand. What it does signal is that these commodities are subject to supply security considerations by major importers, which can translate into longer-term offtake agreements, strategic stockpiling programmes, and policy frameworks that incentivise domestic or allied-nation production.
However, energy transition minerals policy is evolving rapidly, and producers with reliable, scalable supply capacity in these materials occupy a structurally advantaged position in this environment, though market pricing will continue to be driven by conventional supply-demand dynamics.
The next major ASX story will hit our subscribers first
Safety Performance as an Operational and ESG Metric
Tharisa's management has placed considerable emphasis on the company's safety record during the H1 FY2026 period, describing performance in this area as a core operational value rather than a compliance requirement. In the mining sector, this distinction carries real financial weight.
Safety performance metrics influence several dimensions of mining company valuation:
- Regulatory standing and licence to operate: Jurisdictions including South Africa's Department of Mineral Resources and Energy apply safety performance criteria to operating permit renewals and expansion approvals.
- Institutional capital access: ESG-integrated investment mandates, which now govern a substantial portion of global asset management, explicitly screen safety records as part of social impact assessments.
- Operational continuity: Fatalities and serious injuries trigger mandatory stoppages under South African mining law, with direct production and revenue consequences.
- Insurance and financing costs: Insurers and project financiers increasingly price safety records into risk premiums for mining operations.
A consistent track record of zero-harm performance therefore functions as both a social licence mechanism and a financial efficiency tool, reducing the risk of production interruptions that disproportionately impact fixed-cost-heavy operations like underground mining.
Sector Cyclicality and What the Recovery Signals for the Broader PGM-Chrome Industry
The Tharisa first-half net profit increase does not exist in isolation. The recovery trajectory is broadly consistent with a rebalancing dynamic observed across Southern African PGM and chrome producers following the 2024–2025 compression period. However, several company-specific factors appear to have amplified Tharisa's recovery relative to simpler peers:
- The dual-commodity structure meant both revenue streams benefited from simultaneous market improvements.
- The beneficiation-focused processing model generated stronger per-tonne value than raw concentrate producers.
- The integrated cost structure provided operating leverage as revenue expanded.
Investors should note that the absolute profit of $46.6 million for the half-year period, while dramatically higher than the prior period, remains below the trajectory implied by Tharisa's reported full-year profit before tax of $117.6 million in prior higher-price periods. This positions the current result as a recovery in progress rather than a peak earnings event, though market conditions, commodity prices, and operational outcomes in the second half of FY2026 will determine whether the full-year result continues to build on this trajectory. For broader context on how Tharisa's financials compare across prior cycles, Simply Wall St's historical analysis provides a useful long-term earnings perspective.
Investors should be aware that mining sector earnings are inherently cyclical and subject to commodity price volatility, currency movements, operational disruptions, and geopolitical factors. Forward-looking assessments involve material uncertainty and should not be relied upon as forecasts.
Frequently Asked Questions: Tharisa First-Half Net Profit Increase
What was Tharisa's net profit for the first half of FY2026?
Tharisa reported net profit after tax of $46.6 million for the six months ended March 31, 2026, representing a 468.3% increase year-on-year from $8.2 million in H1 FY2025.
Why did the Tharisa first-half net profit increase so dramatically?
The increase reflects a combination of improved commodity pricing across both PGM and chrome product streams, stronger sales volumes, and the operating leverage inherent in Tharisa's vertically integrated business model, compounded by the severely depressed earnings base established in H1 FY2025.
What caused Tharisa's profit to fall so sharply in H1 FY2025?
The prior period decline was driven by a 13.6% reduction in PGM ounces sold and a 12.2% fall in realised metallurgical chrome prices, which together reduced revenue to $280.8 million and compressed net profit to $8.2 million.
How much did Tharisa spend on the Karo Platinum Project?
Tharisa directed $21.4 million of its total $103.5 million capital expenditure budget toward the Karo Platinum Project in Zimbabwe during the half-year period.
Are PGMs and chrome classified as critical minerals?
Both commodity groups appear on critical minerals registers maintained by the European Union, the United States, and other major economies, reflecting their importance to emissions reduction technology, hydrogen applications, industrial manufacturing, and emerging technology supply chains.
What is Tharisa's long-term growth strategy?
Tharisa is pursuing a multi-generational mining business thesis centred on three pillars: continued beneficiation intensity at Tharisa Mine, underground development to extend resource life and access higher-grade ore zones, and the progressive development of the Karo Platinum Project in Zimbabwe to expand its PGM production base geographically.
Readers seeking broader context on platinum group metals markets and chrome sector dynamics may find value in reviewing sector coverage published by Mining Weekly at miningweekly.com, which provides ongoing reporting on PGM and chrome industry developments across Southern Africa and globally.
Want To Track The Next Major Mineral Discovery Before The Market Moves?
Discovery Alert's proprietary Discovery IQ model delivers real-time alerts on significant ASX mineral discoveries, turning complex commodity data into actionable investment insights for both short-term traders and long-term investors. Explore how historic discoveries have generated substantial returns by visiting Discovery Alert's dedicated discoveries page, and begin your 14-day free trial today to position yourself ahead of the broader market.