
June 8, 2026
Why Commodity Markets Have Never Looked This Cheap Relative to Everything Else
There is a recurring pattern in financial history where the assets most critical to the functioning of the real economy become systematically undervalued precisely because capital chases momentum, narrative, and growth stories instead. Mines, oilfields, and grain producers are not glamorous. They do not generate viral product launches or generate trillion-dollar software valuations. But they underpin every physical process that sustains modern civilisation, and right now, by nearly every historical valuation measure, they remain among the cheapest assets available to investors.
Understanding this disconnect is the starting point for grasping why veteran resource investor and speculator Doug Casey has consistently argued that the Doug Casey commodities bull market, despite gains across gold, silver, copper, and energy, is nowhere near a speculative peak. Furthermore, for those exploring commodities investment bull run opportunities, this historical context provides an essential foundation.
The Valuation Extremes That Define This Moment
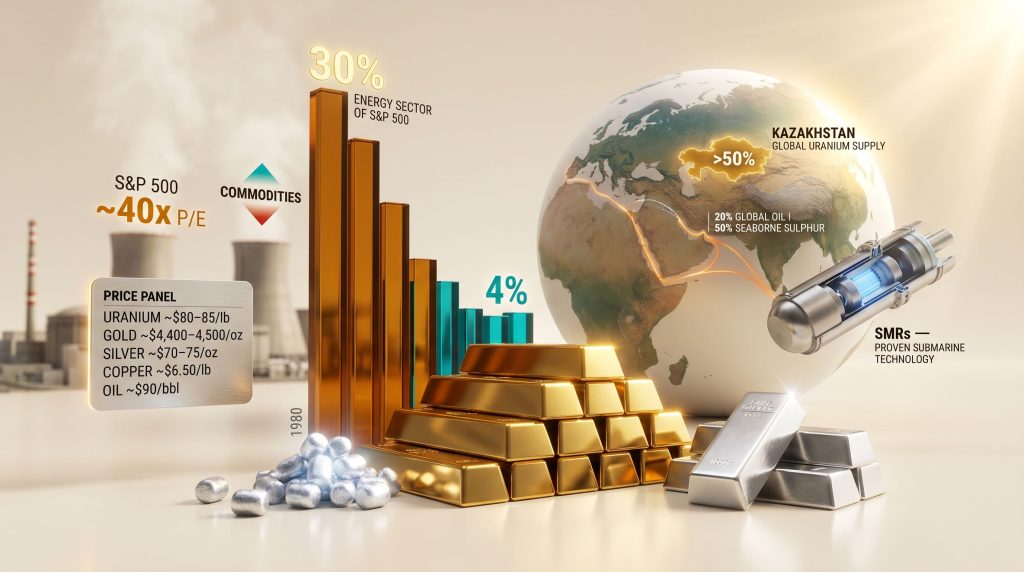
The S&P 500 currently trades at approximately 40 times earnings, a valuation that sits near all-time highs by price-to-earnings standards. Against this backdrop, energy stocks, which include oil and gas producers, account for roughly 4% of S&P 500 market capitalisation. At their 1980 peak, that figure was closer to 30%. This compression has occurred while oil and gas have become more, not less, important to the functioning of the global economy in absolute terms.
The dividend yield story reinforces the anomaly. Select energy producers are currently yielding 7 to 8% annually, while the S&P 500 as a whole yields approximately 1%, itself a historic low. These numbers, taken together, describe a market where the most economically essential sector has been crowded out by speculative capital chasing technology valuations.
Across the broader commodity spectrum, the picture is equally striking:
| Commodity | Approximate Current Level | Market Assessment |
|---|---|---|
| Gold | ~$4,400-4,500/oz | New equilibrium; monetary and geopolitical demand |
| Silver | ~$70-75/oz | New equilibrium; industrial demand accelerating |
| Copper | ~$6.50/lb | New equilibrium; electrification demand driver |
| Oil | ~$90/barrel | New equilibrium; geopolitical risk premium building |
| Uranium (spot) | ~$80-85/lb | Below prior cycle peak of ~$140/lb |
| Grains (corn, wheat, soybeans) | Broadly cheap | No speculative interest; historically undervalued |
| Cotton | Cheap | Contrarian opportunity; minimal speculative activity |
The absence of a speculative mania is itself a meaningful signal. No commodity sector is currently exhibiting parabolic price action, elevated retail participation, or the kind of premium expansion that characterises late-cycle behaviour. This is consistent with early-to-mid cycle positioning.
Commodities relative to equities remain close to historic lows. The bubble, by most evidence, is in stocks and bonds, not in the resources sector.
When big ASX news breaks, our subscribers know first
Gold as Monetary Insurance: How the Investment Case Has Shifted
From Deep-Value Speculation to Savings Vehicle
For decades, gold was structurally underpriced relative to the real goods it could purchase. A single ounce of gold has historically approximated the cost of a well-made suit, a quality meal, or a fraction of a vehicle. For much of the early 2000s and parts of the 2010s, gold sat well below that purchasing power equilibrium, making it a genuine deep-value speculation.
That condition no longer applies. At current levels around $4,400 to $4,500 per ounce, gold has moved to approximately fair value when measured against real-world goods. This does not make gold a poor asset to hold. It changes its function within a portfolio from a speculative vehicle to what Casey describes as a savings instrument and monetary insurance policy. Consequently, gold as a safe haven has become the more accurate framing for its role in a modern portfolio.
Central Bank Accumulation as the Price Driver
What makes the current gold cycle structurally different from prior bull runs is the identity of the dominant buyer. Central banks, not retail investors, have been the primary force behind gold's appreciation. This is visible in one of the most reliable contrarian sentiment indicators available: gold coin premiums.
When the general public participates in precious metals markets, coin premiums expand sharply above spot price as demand outpaces physical supply. Currently, gold coin premiums remain minimal, suggesting that the retail investor has largely not entered this trade. Central banks have been driving prices higher while ordinary investors remain on the sidelines.
The motivation for central bank buying is structural. Sovereign institutions holding US dollar reserves are sitting on what Casey characterises as the unsecured liability of a fiscally distressed government. Alternative reserve currencies present their own problems:
- The Chinese yuan lacks the capital account convertibility and institutional trust needed to serve as a reserve asset
- The Russian ruble carries geopolitical and economic fragility
- The euro faces long-term fiscal divergence among member states
Gold stands apart because it carries no counterparty liability. It is not simultaneously a debt obligation of any issuing entity. This property becomes more valuable, not less, as sovereign debt levels globally continue to rise.
The $10,000-$15,000 Scenario: Speculative, Not Guaranteed
The case for gold extending toward $10,000 to $15,000 per ounce rests on continued central bank accumulation accelerating alongside currency debasement. This is a legitimate scenario but not a base-case certainty. Investors should treat this as a tail outcome, not a near-term price target. For those seeking more asymmetric upside at current levels, silver and uranium equities likely offer more compelling risk-reward profiles.
Silver's Six-Year Deficit: The Supply Constraint Most Investors Miss
Why the Structural Deficit Is Different From a Temporary Imbalance
Silver has run an annual production deficit for approximately six consecutive years, meaning global consumption has consistently exceeded fresh mine supply. Approximately 1 billion ounces of silver are mined each year, yet demand has persistently outstripped this figure without triggering the kind of price response that might be expected. In addition, understanding silver supply deficits in greater depth reveals why this dynamic is unlikely to resolve quickly.
The Demand Transformation From Photography to Electrification
Historically, roughly half of annual silver demand came from photographic film processing. That market has effectively disappeared, replaced by digital imaging. The silver market absorbed this demand collapse and found a new, expanding industrial base driven by electrification trends.
Silver's unique physical properties make it genuinely irreplaceable in a growing range of applications. Among the 92 naturally occurring elements, silver holds three superlative physical characteristics:
- Most reflective of visible light of all natural elements
- Most thermally conductive material in existence
- Most electrically conductive substance known
These properties make silver a critical input in solar energy panels, advanced electronics, electric vehicle components, and high-frequency communications infrastructure. As industrial economies continue their electrification trajectory, silver's role in enabling that shift grows proportionally.
The Byproduct Supply Ceiling That Most Analysis Ignores
What makes silver's supply response fundamentally different from other commodities is the structure of its production. Approximately 70 to 80% of global silver production is a byproduct of mining operations targeting gold, lead, and zinc. Primary silver mines account for a relatively small portion of total supply.
This creates a critical dynamic: production decisions are driven by the economics of the host metal, not the silver price. Even if silver prices rise significantly, mine operators are unlikely to dramatically increase silver output unless the associated host metals also justify expansion. This supply ceiling reinforces the deficit dynamic over the medium term in a way that is structurally unusual compared to base metals.
Unlike copper or nickel, where higher prices reliably incentivise new supply, silver's byproduct nature means the market cannot simply produce its way out of a deficit by responding to price signals alone.
Doug Casey's Uranium Bull Market Thesis: Nuclear as Industrial Civilisation's Only Scalable Option
The Energy Density Problem That Renewables Cannot Solve
Casey's uranium thesis begins not with supply and demand spreadsheets but with a fundamental argument about energy physics. Wind and solar energy generation serve specific geographic niches effectively. The Sahara Desert and Death Valley are genuine candidates for utility-scale solar. Offshore locations with consistent wind resources can support economic wind generation. But these are use cases, not universal solutions.
Powering a large-scale industrial economy requires baseload, dispatchable power, electricity that is available on demand regardless of weather conditions, time of day, or seasonal variation. Intermittent renewable sources cannot meet this requirement without massive, currently uneconomic storage infrastructure. The logical conclusion is that nuclear power, as the only proven technology capable of delivering high-density, continuous, low-emission electricity at industrial scale, becomes the necessary foundation of any serious decarbonisation or energy security strategy. Indeed, Doug Casey on uranium has suggested the metal could easily quadruple from its lows in the right conditions.
Japan's Reactor Restarts: Reading the Signal Correctly
Japan's decision to shut down the majority of its nuclear fleet following the 2011 Fukushima Daiichi incident was driven by public perception rather than a technical assessment of nuclear energy's safety profile. The Fukushima event resulted from an extreme, low-probability natural disaster, specifically a tsunami of historic magnitude, not a systemic flaw in reactor design or operational protocols. Casey notes this distinction is essential: the technology itself did not fail.
Japan's progressive restart programme represents a structural demand recovery for uranium. Each reactor restart returns a utility to the long-term contracting market, requiring procurement of uranium fuel under multi-year agreements. This incremental demand addition compounds over time as more reactors return to service.
US Nuclear Expansion: Policy Momentum and Two Development Tracks
The current US political environment appears broadly supportive of nuclear energy expansion, driven by both energy security considerations and industrial competitiveness rationale. Two parallel development tracks are emerging simultaneously:
- Large-scale conventional nuclear plants with gigawatt-level output and longer construction timelines
- Small Modular Reactors (SMRs), compact factory-fabricated units with faster deployment profiles
SMR technology deserves particular attention because it carries a manufacturing and operational history that is frequently underappreciated by investors new to the sector.
What Are Small Modular Reactors? Small Modular Reactors are nuclear reactors with electrical output typically below 300 megawatts, substantially smaller than conventional gigawatt-scale plants. Their compact design enables factory fabrication, underground installation, and reduced site footprint. The underlying technology is derived from naval propulsion reactors used in nuclear submarines, a design with more than 60 years of continuous operational history. More than a dozen publicly traded companies are currently developing commercial SMR technology.
The Kazakhstan Concentration Risk That Uranium Investors Must Understand
Global uranium supply is geographically concentrated to a degree that creates both a risk and an opportunity for investors. Furthermore, Kazakhstan uranium dominance in excess of half of global supply underscores the fragility of this concentration:
| Country | Role in Global Uranium Supply |
|---|---|
| Kazakhstan | World's largest producer; more than 50% of global supply |
| Canada | Second-largest producer; high-grade Athabasca Basin deposits |
| Uzbekistan, Tajikistan | Secondary Central Asian producers |
| Australia | Major reserves; significant production capacity |
| United States | Minimal domestic production; heavily import-dependent |
The United States hosts the world's largest installed base of nuclear reactors yet produces negligible domestic uranium. This import dependency creates a structural vulnerability that has begun attracting policy attention, though it is important to note that broader policy support for domestic uranium production at a national level does not automatically translate into project-specific benefits for individual companies.
On pricing, the uranium spot market currently sits around $80 to $85 per pound, while long-term contract prices are running above spot at approximately $90 to $94 per pound. The prior cycle peak reached approximately $140 per pound, suggesting substantial headroom if demand projections materialise. Those looking more closely at uranium investment strategies will find this pricing gap particularly instructive when assessing entry points.
The Strait of Hormuz: A Commodity Risk That Markets Are Underpricing
Beyond Crude Oil: What Actually Flows Through the Strait
Market commentary on the Strait of Hormuz risk typically focuses on crude oil, and reasonably so. Approximately 20% of global oil and gas supply transits this narrow waterway. But a less discussed figure deserves attention: an estimated 50% of globally traded seaborne sulphur also passes through the strait. Sulphur, as a byproduct of oil and gas refining, is a primary feedstock for sulphuric acid production, which is in turn essential for phosphate fertiliser manufacturing. Aluminium flows are also exposed to disruption risk through this corridor.
This means a sustained Hormuz disruption is not simply an energy market event. It is a food security and industrial materials event with cascading consequences across agricultural commodity markets and manufacturing inputs.
Why Oil Prices May Not Yet Reflect the Full Risk
Oil moved from approximately $60 to $65 per barrel to approximately $90 per barrel, a significant increase, but one that Casey believes may still understate the actual risk premium. His hypothesis is that governments globally have been drawing down strategic petroleum reserves to suppress visible price increases, dampening market signals that would otherwise attract more attention.
Strategic reserves are a finite buffer. Once depleted, market prices must absorb the full supply disruption without a cushion. The demand destruction dynamic, where higher prices reduce consumption, runs simultaneously with supply constraint, and the net price outcome depends on which force dominates. Historical precedent from Hormuz disruptions suggests sharp, sustained price spikes are the more likely outcome.
Is a 1970s-Style Energy Shock Possible?
Casey's assessment is that today's global economy is less resilient than it was during the 1970s energy crises, not more. Several structural differences compound the vulnerability:
- Absolute debt levels across sovereigns and corporations are significantly higher than in the 1970s
- Government fiscal positions globally are more constrained, limiting crisis response capacity
- Oil and gas dependency in absolute economic terms has grown, not declined
- Multiple concurrent geopolitical conflicts create more complex risk interactions than the more isolated crises of that decade
The Everything Bubble: What Asset Inflation Means for Resource Investors
Three Asset Classes in Bubble Territory Simultaneously
Casey characterises the current financial environment as an "everything bubble," a historically unusual condition where bonds, equities, and real estate have all been inflated simultaneously by the same underlying monetary mechanism.
The US federal deficit currently exceeds $2 trillion annually. Traditional foreign buyers of US Treasury debt, including China and Japan, have been reducing their holdings. The Federal Reserve has absorbed a significant portion of new issuance through balance sheet expansion. The newly created dollars flow into commercial bank reserves, expand lending capacity, and ultimately find their way into risk assets, sustaining equity valuations despite deteriorating underlying fundamentals.
The S&P 500 at approximately 40 times earnings represents a historically extreme valuation. The bond market is adjusting as long-term interest rates rise structurally. Real estate, which Casey describes as floating on a sea of debt, faces compression as higher rates reduce affordability and transaction volumes.
Three High-Profile IPOs as a Potential Market Peak Signal
SpaceX, Anthropic, and OpenAI, each carrying implied valuations in the multi-trillion dollar range, are approaching public markets in close succession. Historically, the clustering of high-profile, high-valuation IPOs near market peaks has served as a sentiment indicator, a signal that the most optimistic capital is being deployed into speculative assets at the top of a cycle. Casey frames this convergence as a potential bell-ringing moment for equity markets.
How Mining Stocks Have Historically Behaved in Market Downturns
The historical precedent from the 1929 to 1933 depression offers a useful, if imperfect, reference point. During that period, the US equity market declined approximately 93%. Gold mining stocks were among the few sectors that appreciated, driven by a government-mandated gold price increase from $20 to $35 per ounce while general price levels and operating costs simultaneously declined, expanding mining margins dramatically.
The current operating margin context for gold producers is already compelling. All-in sustaining costs for gold production sit at approximately $1,700 to $1,800 per ounce, while gold trades around $4,400 to $4,500 per ounce. Development-stage companies progressing toward production are inheriting an extraordinary margin environment.
However, a critical caveat applies. In forced liquidation scenarios, investors sell whatever carries a bid. Mining stocks are equities, and in a broad market selloff they can be sold indiscriminately alongside everything else. Maintaining elevated cash reserves is not a defensive concession; it is a strategic tool that provides the optionality to acquire quality mining stocks at distressed prices when the broader market declines.
The next major ASX story will hit our subscribers first
How to Evaluate Uranium and Mining Stocks in a Bull Market Cycle
Speculation Versus Investment: Understanding the Distinction
Resource stocks, particularly junior miners and uranium explorers, are speculations rather than conventional investments. The asymmetry is extreme in both directions. Multi-hundred-percent gains are achievable in a bull cycle, but near-total capital loss is equally possible. Many small resource companies carry weak balance sheets, poor capital allocation histories, and management teams without a track record of delivering projects to production. For instance, speculating your way to success in resource markets, as Casey has long argued, demands rigorous selectivity rather than broad exposure.
The quality spectrum within uranium equities alone spans a wide range of risk and return profiles:
| Company Stage | Risk Profile | Return Potential |
|---|---|---|
| Producing uranium miners | Lower risk; generating current cash flow | Moderate upside; directly leveraged to spot price |
| Development-stage (near-production) | Medium risk; execution dependent | High upside if uranium price holds |
| Exploration-stage juniors | High risk; binary outcomes common | Extreme upside potential; high failure rate |
Six Factors That Separate Quality from Mediocrity in Uranium Stock Selection
- Jurisdiction quality: Political stability and regulatory predictability of the operating country significantly affects project risk and timeline
- Resource grade and deposit size: Higher-grade deposits carry lower cost structures, providing a buffer against commodity price volatility
- Management track record: Prior success in bringing exploration projects through development to production is the most reliable forward indicator
- Balance sheet strength: Cash runway must be assessed against the realistic development timeline to avoid dilutive capital raises at inopportune moments
- Infrastructure proximity: Access to roads, power, water, and processing facilities materially affects project economics
- Offtake contracting: Long-term supply agreements with utilities provide revenue visibility and reduce exposure to spot price volatility
Frequently Asked Questions on Doug Casey's Commodities and Uranium Outlook
Are commodities in a speculative bubble right now?
No. Casey's position is that commodities remain cheap relative to equities and relative to historical norms. Grains, energy, and most metals show none of the hallmarks of a speculative mania. The bubble, in his analysis, resides in equities and bonds.
Why is the uranium investment thesis compelling at current prices?
Three converging factors drive the thesis: rising nuclear power demand from Japanese reactor restarts, US nuclear expansion, and SMR commercialisation; constrained supply with Kazakhstan accounting for over half of global production; and a significant price gap between the current spot level of roughly $80 to $85 per pound and the prior cycle peak of approximately $140 per pound.
Is gold still worth buying at $4,400 to $4,500 per ounce?
Casey views gold at current levels as approximately fairly valued relative to real goods, making it a sound savings vehicle and monetary insurance instrument. For investors seeking pure speculative upside, silver and uranium equities may offer better asymmetry at this stage of the Doug Casey commodities bull market cycle.
What happens to mining stocks in a broad equity market crash?
Historically, gold miners outperformed during the 1929 to 1933 depression. But in forced liquidation events, all equities including miners can sell off indiscriminately. Holding elevated cash positions allows investors to take advantage of distressed valuations during such events.
How significant is the Hormuz conflict for commodities beyond oil?
Highly significant. Beyond crude oil, approximately 50% of globally traded seaborne sulphur transits the strait, with direct implications for fertiliser production and food commodity prices. Aluminium and other industrial materials are also exposed.
What makes SMRs relevant to the uranium demand story?
SMRs represent a growth vector for nuclear energy beyond conventional reactor restarts. Based on proven submarine reactor technology with over 60 years of operational history, their commercial deployment would generate incremental uranium demand above what the existing reactor fleet requires. More than a dozen publicly traded companies are actively developing this technology.
This article is intended for informational and educational purposes only. Nothing contained herein constitutes financial advice, an investment recommendation, or a solicitation to buy or sell any security. All forecasts, price projections, and scenario analyses involve significant uncertainty and should not be relied upon as predictions of future outcomes. Readers should conduct their own due diligence and consult a qualified financial adviser before making any investment decisions. Commodity markets and mining equities carry substantial risk of loss.
Ready To Act on the Next Major Commodity or Mineral Discovery Before the Broader Market?
Discovery Alert's proprietary Discovery IQ model delivers real-time alerts on significant ASX mineral discoveries, instantly transforming complex resource data into actionable investment insights — whether you're tracking uranium, silver, copper, or gold opportunities. Explore Discovery Alert's dedicated discoveries page to understand why major mineral discoveries have historically generated exceptional returns, and begin your 14-day free trial today to position yourself ahead of the market.