
July 14, 2026
When Two Rival Assets Rise Together: What History Says About 2026
Across most market cycles, equities and gold have functioned like opposite ends of a seesaw. When investor confidence is high and corporate earnings are expanding, capital flows toward risk assets and precious metals lose their appeal. When fear takes hold, the dynamic reverses. Yet in 2026, both the Dow Jones and gold new all-time highs are generating signals that challenge this conventional wisdom, with equities closing in on record territory while precious metals hold historically elevated levels after a significant bull run. Understanding what this dual-asset environment means, and where both markets are heading next, requires more than a surface-level reading of price charts.
When big ASX news breaks, our subscribers know first
Why Simultaneous Strength in Equities and Gold Is Historically Rare
The relationship between equities and precious metals is governed by a simple underlying logic: both compete for the same pool of investor capital. When one dominates, the other typically suffers. The occasions when this inverse relationship breaks down tend to cluster around periods of monetary regime transition, elevated geopolitical risk, or late-cycle economic stress where investors simultaneously seek both growth exposure and defensive protection.
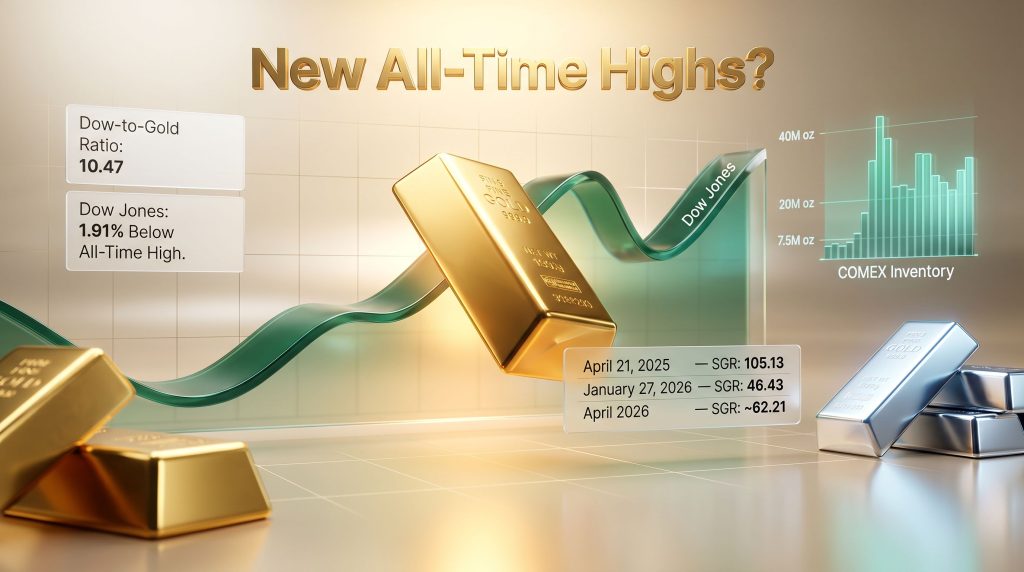
One analytical tool that captures this relationship with particular clarity is the Dow-to-gold ratio, which measures how many ounces of gold are required to purchase one unit of the Dow Jones Industrial Average. The ratio currently sits at approximately 10.47, a reading that historically reflects periods of equity dominance. However, the persistence of gold at elevated price levels complicates what would otherwise be a straightforward risk-on narrative. For a deeper look at how these assets interact over time, the gold-stock market relationship provides valuable historical context.
Historical turning points illustrate why this matters:
| Historical Period | Dow Behaviour | Gold Behaviour | Subsequent Outcome |
|---|---|---|---|
| 1929 Peak | All-time highs | Stable | Equity collapse; Great Depression |
| 1980 Commodity Top | Severely depressed | All-time high at $850/oz | Two-decade gold bear market |
| 2011 Post-GFC | Recovering | All-time high (~$1,923/oz) | Risk-on rotation into equities |
| 2026 (Current) | Near all-time highs | Correcting from cycle highs | Transition phase in progress |
The 1980 gold peak is particularly instructive. Gold reached $850 per troy ounce in January of that year, according to Federal Reserve Economic Data (FRED) records, representing the apex of a decade-long monetary chaos cycle driven by the collapse of Bretton Woods, the oil embargo, and stagflation. What followed was a 20-year bear market in precious metals as equities took over as the dominant store of wealth.
Periods of simultaneous strength across both equities and precious metals have historically marked structural inflection points rather than sustainable equilibrium. The asset that eventually yields ground reveals which underlying narrative, growth optimism or monetary anxiety, is actually winning.
The 2026 environment shares characteristics with the transition phases that preceded each of those historical turning points: expansive central bank balance sheets, elevated sovereign debt, and geopolitical tensions that have introduced persistent risk premiums across asset classes.
Where Does the Dow Jones Stand Right Now?
The Scoring Position Framework
Technical market analysis employs the concept of scoring position to describe the condition where a major index trades within 5% of its most recent all-time high on a closing basis. This threshold is not arbitrary. When an index consistently closes within this band after a correction, it demonstrates that buyers are systematically absorbing selling pressure at increasingly higher price levels, creating the mechanical preconditions for a breakout to new highs.
As of late April 2026, the Dow Jones Industrial Average closed approximately 1.91% below its February 10th record of 50,188.14, representing its 81st confirmed all-time high since the index entered scoring position in November 2023. That correction, which pulled the index roughly 10% from its February peak, has now been largely absorbed, with the index demonstrating renewed upside momentum.
Critically, this is not occurring in isolation. Multiple major indexes have already registered new all-time highs in recent weeks:
- The S&P 500 has printed new records
- Both the NASDAQ 100 and NASDAQ Composite have confirmed breakouts
- The Russell 1000, Russell 3000, and Russell Value Index have all closed at all-time highs
When the majority of related indexes have already achieved new highs while a laggard like the Dow consolidates just below its prior record, the probabilistic base case strongly favours a breakout rather than a reversal. Furthermore, according to Dow Jones historical analysis, this kind of lagging behaviour before a breakout is a well-documented pattern in long-term bull markets.
Bull Markets Are Built on Corrections
The April 2025 correction provides an important reference point. The Dow declined approximately 15% during that period, creating an eight-month gap between the 55th and 56th new all-time highs of the current advance. Recovery began in August 2025, with new records following methodically thereafter. This is entirely consistent with how sustained bull markets function across history.
A bull market is not a straight-line advance. Corrections of 10% to 20% are structural resets that extend the longevity of the overall trend rather than signals of its termination. The decisive question is always whether the index re-enters scoring position following each setback.
The five-stage bull market recovery cycle:
- Index reaches an all-time high and enters scoring position
- Correction occurs, typically drawing the index 10-20% below its peak
- Recovery phase begins as buyers re-enter at lower valuations
- Index re-approaches prior highs, closing within 5% on a sustained basis
- New all-time high confirmed, resetting the cycle
The Dow's current position in this sequence is clearly Stage 4, deep inside scoring position and demonstrating the same technical characteristics that preceded each of the 81 prior new all-time highs recorded since November 2023.
What the March 2020 Flash Crash Reveals About Modern Market Structure
The Most Violent Decline in Recorded Dow History
To understand the structural dynamics underpinning today's equity market, it is necessary to examine the March 2020 event in detail. In the entirety of Dow Jones history stretching back to February 1885, no prior market event compressed a decline of comparable magnitude into such a brief window. From its all-time high, the Dow reached a 52-week low in just 17 NYSE trading sessions. The complete round-trip from peak to a 38% drawdown was completed in only 28 NYSE trading sessions.
For reference, the 1929 crash, though ultimately far more destructive in economic terms, took considerably longer to reach equivalent percentage losses. The 1987 Black Monday collapse of 22.6% in a single session was more severe on a per-day basis, but the subsequent recovery was relatively swift by comparison to the systemic damage of the 1930s.
The Federal Reserve Response and Its Long-Term Consequences
The Federal Reserve's intervention in April 2020 involved a single-month liquidity injection estimated at $1.63 trillion, effectively placing a structural floor beneath equity valuations at a speed and scale without historical precedent. The Fed's total balance sheet expanded from approximately $4.3 trillion in February 2020 to over $7.3 trillion by May 2020, according to Federal Reserve H.4.1 release data, representing a $3 trillion expansion in roughly 90 days.
This raises a question with profound long-term implications for market structure: if central bank liquidity can arrest even the most violent equity declines in recorded history, does the traditional framework of market crashes become functionally obsolete? The honest answer is that unlimited nominal expansion is theoretically possible under a fiat monetary system, but it carries a structural constraint that cannot be indefinitely avoided.
Every dollar of credit created by a central bank must ultimately be assumed as a liability by some counterparty, whether sovereign, corporate, or household. That liability carries ongoing debt servicing obligations. When those obligations exceed the economic capacity to meet them, defaults cascade. The credit expansion of the 1920s produced the prosperity of that era. The subsequent inability of borrowers to service their accumulated debts produced the economic devastation of the 1930s.
| Era | Credit Expansion Phase | Debt Servicing Failure | Consequence |
|---|---|---|---|
| 1920s | Fed-facilitated post-WWI credit boom | Widespread private sector default | Great Depression (1930s) |
| 2000s | Sub-prime mortgage expansion | Mortgage default cascade | Global Financial Crisis (2008-09) |
| 2020s | Post-pandemic QE and liquidity injections | Sovereign debt stress building | Systemic risk accumulating (2025-26) |
According to research by Carmen Reinhart and Kenneth Rogoff documented in their extensive historical analysis of financial crises, debt-to-GDP thresholds above 90% have historically been associated with materially lower economic growth rates, creating a compounding dynamic where slower growth makes debt servicing progressively more difficult. (Reinhart & Rogoff, This Time Is Different, Princeton University Press, 2009.)
Could the Dow Jones Reach 60,000 or Higher?
Under a pure fiat monetary framework unconstrained by a precious metal standard, there is no theoretical ceiling on nominal asset prices. The Dow Jones has advanced from approximately 776 points in August 1982 to above 50,000 in early 2026, representing a cumulative gain of roughly 6,350% over 43 years. Within that context, a move from 50,000 to 60,000 represents only a 20% advance, which is historically modest relative to the scale of the overall bull market.
The S&P 500 and NASDAQ indexes have demonstrated repeatedly that new all-time highs can be achieved even during periods of monetary tightening, elevated geopolitical risk, and compressed corporate margins. Nominal price appreciation, driven partly by currency debasement and partly by genuine economic productivity gains, has proven remarkably resilient.
The structural risk that could interrupt this trajectory is not a conventional bear market. It is a systemic debt default cascade of sufficient scale to impair the central bank's capacity to intervene effectively. Physical gold and silver, as assets carrying zero counterparty risk, would be among the few stores of value positioned to retain purchasing power in such a scenario. Furthermore, understanding gold as a safe haven remains critical for investors navigating today's elevated debt environment.
What Is Gold Doing, and When Will It Reach New All-Time Highs?
Gold's Technical Position in April 2026
As of the final week of April 2026, gold closed approximately 14.08% below its prior all-time high, placing it well outside scoring position. This distinguishes gold's current condition clearly from the Dow Jones, which is positioned just under 2% from its record.
However, the internals of gold's daily price action tell a more nuanced story. On March 23rd, gold's 15-count indicator reached a reading of -9, a statistically rare oversold signal. To understand the significance of this reading, it is necessary to understand the indicator itself.
Understanding the 15-Count Indicator
What is the 15-Count? The 15-count measures the net balance between advancing and declining sessions over a rolling 15-trading-day window. A reading of -9 means that of the most recent 15 sessions, approximately 12 recorded price declines. This represents an extreme imbalance that has historically preceded directional reversals.
Since December 1970, the Dow Jones has registered a 15-count of -9 in only 116 of its 13,905 daily closings, making such readings genuinely rare:
| 15-Count Reading | Frequency (Dow, since December 1970) | Market Interpretation |
|---|---|---|
| -7 | 361 of 13,905 sessions | Moderately oversold |
| -9 | 116 of 13,905 sessions | Severely oversold; high reversal probability |
| +7 to +9 | Comparable rarity | Overbought; elevated correction risk |
The Dow Jones itself recorded a 15-count of -7 on March 20th, less extreme than gold's -9 but still a statistically uncommon reading. The Dow's subsequent recovery to within 1.91% of its all-time high validates the predictive utility of the indicator. Gold's equivalent or more extreme reading on March 23rd suggests that the majority of the downside pressure in the precious metals correction has been exhausted.
The Forward Outlook for Gold
The analytical thesis is straightforward: gold's 15-count is expected to shift to positive territory in the weeks ahead, reflecting a return to more advancing sessions than declining ones. If this pattern unfolds as historical precedent suggests, new all-time highs for gold become achievable within the May to June 2026 timeframe. Silver and gold and silver mining equities tracked by the XAU index are anticipated to follow, with the summer of 2026 potentially representing a meaningful performance window for precious metals investors. Moreover, the dynamics linking gold and bonds dynamics during this phase further reinforce the case for renewed precious metals momentum.
Disclaimer: These projections are based on technical analysis frameworks and historical pattern recognition. They do not constitute financial advice, and actual market outcomes may differ materially from any forward-looking assessment.
The next major ASX story will hit our subscribers first
The Silver-to-Gold Ratio: A Cycle Indicator Investors Should Monitor
How the SGR Functions as a Precious Metals Barometer
The silver-to-gold ratio measures how many ounces of silver are required to purchase a single ounce of gold. Its directional movement serves as a reliable indicator of where a precious metals cycle stands:
- A declining SGR (silver outperforming gold) typically signals an accelerating precious metals bull market
- A rising SGR (gold outperforming silver) often characterises early-stage conditions or periods of pure risk aversion favouring gold's monetary properties over silver's industrial demand
Key SGR Data Points in the Current Cycle
| Date | SGR Level | Market Context |
|---|---|---|
| April 21, 2025 | 105.13 | Cycle peak; extreme gold outperformance |
| January 27, 2026 | 46.43 | Cycle trough; aggressive silver outperformance |
| Late April 2026 | ~62.21 | Mid-correction; SGR rebounding from lows |
The compression of the SGR from 105.13 to 46.43 in under nine months represented a dramatic shift in relative precious metals performance, with silver delivering substantially amplified returns compared to gold during that window. This leverage dynamic is a consistent feature of precious metals bull markets, driven by silver's dual identity as both a monetary metal and an industrial commodity with expanding applications in solar panel manufacturing, electronics, and medical technology.
The most striking historical reference point comes from the 1970 to 1980 bull market, during which the SGR broke below the 20 level at the cycle's peak. For context, had the SGR reached 20 at the January 27th gold price of $5,162.80, silver would theoretically have been priced at approximately $258.14 per ounce.
The current analytical expectation is that the SGR may test the 70 level during the ongoing correction phase before resuming its decline toward the sub-40 zone as the broader precious metals bull market continues.
COMEX Inventory Flows: Decoding the Unusual Gold Movements
A Decade of Extraordinary Inventory Behaviour
COMEX gold inventories provide a window into the wholesale physical gold market that most retail investors never examine. The scale of movements recorded since 2020 is genuinely without modern precedent:
| Period | COMEX Gold Inventory | Net Change |
|---|---|---|
| March 2020 | ~7,500,000 oz | Baseline |
| March 2021 | ~40,000,000 oz | +32,500,000 oz (+1,015 tonnes) |
| October 2024 | ~17,500,000 oz | Significant drawdown |
| April 2025 | ~45,000,000 oz | New cycle peak |
| April 2026 | ~30,000,000 oz | -15,000,000 oz (-468.75 tonnes) |
To place the 2020-to-2021 inflow of 1,015 tonnes in physical perspective, a World War II Fletcher-class destroyer displaced approximately 2,050 tonnes. The gold shipped into COMEX storage during that single year represented roughly half that displacement in pure precious metal. The cost of physically transporting, insuring, assaying, and storing such quantities implies that the economic incentive driving these flows must be substantial.
During the 1969-to-1980 gold bull market, COMEX inventories peaked at approximately 5,000,000 ounces before declining by more than 90% through the subsequent two-decade bear market. The current cycle has seen inventories operate at magnitudes many times greater than that historical precedent, suggesting a structural evolution in how gold is intermediated through wholesale markets.
Three hypotheses explain these unusual flows:
- Institutional arbitrage: Price differentials between COMEX, London, and Shanghai gold markets may be sufficiently wide to justify the logistics cost of physically moving large gold consignments between venues
- Wholesale selling: Large holders, potentially including sovereign entities, are using COMEX as a transactional venue to sell bullion, with buyers taking physical delivery and relocating metal to alternative custodians
- Geopolitical repatriation: Sovereign wealth funds and central banks, particularly in the Global South, have been accelerating gold repatriation from Western custodians as a strategic risk management measure following the 2022 Russian asset freeze precedent
The Dow Jones Transportation Average Anomaly
An Unprecedented Three-Session Collapse
Perhaps the most technically alarming development captured in the current market environment involves the Dow Jones Transportation Average. Within a single week, this index moved from a confirmed new all-time high to a closing loss of approximately 12.71% in just three NYSE trading sessions.
For comparison, the XAU (gold and silver mining index), a sector widely acknowledged as one of the most volatile in public markets, required five trading sessions to decline 12.11% from its February 27th all-time high. The fact that a traditionally stable, income-generating sector composed of freight, airline, and logistics companies declined faster than precious metals mining stocks is genuinely anomalous.
What Could Explain This Velocity?
Several factors may be contributing, though certainty remains elusive:
- Fuel cost sensitivity: Transportation companies carry direct and unavoidable exposure to crude oil prices. Elevated or rapidly rising crude prices compress operating margins immediately and with little ability to offset through short-term pricing adjustments
- Geopolitical disruption signals: Tensions in the Strait of Hormuz region, through which a significant proportion of global energy flows, could be introducing supply chain cost uncertainty that the market is pricing aggressively
- Debt servicing vulnerability: Transport companies that accumulated significant debt obligations over the past 18 years face a structural fragility that differs from their position during prior fuel cost spikes. Income that previously contributed to profitability now services interest and principal obligations, leaving far thinner buffers against revenue shocks
A 12%+ decline in a traditionally defensive sector within three trading sessions, occurring simultaneously with other major indexes reaching all-time highs, represents a divergence that warrants serious attention. Sector-specific stress of this velocity has occasionally preceded broader market contagion events in historical cycles.
Gold as a Zero-Counterparty-Risk Asset in a High-Debt World
Why the Monetary Context of 2026 Matters for Precious Metals
In a global financial system characterised by elevated sovereign debt, expanding central bank balance sheets, and persistent geopolitical uncertainty, physical gold and silver occupy a category that no paper-based asset can replicate. They carry zero counterparty risk, meaning their value is not contingent on any third party's ability or willingness to honour an obligation.
This characteristic is increasingly relevant as systemic debt levels approach thresholds that have historically preceded default cascades. The analytical framework that assigns value to zero-counterparty-risk assets becomes more compelling precisely as the counterparty risk embedded in competing asset classes grows:
| Asset Class | Counterparty Risk | Inflation Hedge | Default Exposure |
|---|---|---|---|
| Physical Gold | None | Strong | None |
| Physical Silver | None | Strong | None |
| Government Bonds | Sovereign issuer | Weak | Moderate |
| Equities | Corporate issuer | Moderate | Moderate to High |
| Cash and Deposits | Banking system | Very Weak | Low to Moderate |
The World Gold Council has consistently documented gold's function as a portfolio diversifier precisely because of this zero-counterparty structure. In periods where multiple asset classes experience simultaneous stress, physical bullion has historically preserved purchasing power when paper-based instruments could not. Consequently, analysts tracking gold price history note that gold's purchasing power preservation record across centuries is unmatched by any paper asset class.
The convergence of near-record equity valuations, an extreme oversold signal in gold's technical internals, an unusual COMEX inventory cycle, and an anomalous breakdown in transportation stocks creates a market environment that demands careful analysis rather than complacency. The thesis that both the Dow Jones and gold new all-time highs are achievable within the same market window is grounded in technical evidence and historical pattern recognition, though investors should approach any forward-looking market assessment with appropriate caution, recognising that market outcomes can diverge sharply from even well-constructed analytical frameworks.
This article is for informational purposes only and does not constitute financial advice. Past market patterns do not guarantee future outcomes. Readers should conduct their own due diligence and consult qualified financial professionals before making investment decisions.
Want to Stay Ahead of the Next Major Mineral Discovery Before the Broader Market Catches On?
While macro forces like gold cycles and equity valuations shape the investment landscape, Discovery Alert's proprietary Discovery IQ model cuts through the complexity by delivering real-time ASX mineral discovery alerts — instantly translating significant announcements across 30+ commodities into actionable, gold-equivalent insights for both short-term traders and long-term investors. Start your 14-day free trial today and explore the historic returns major discoveries have delivered to understand just how transformative being early can be.