August 20, 2026
When Gold Price Tailwinds Meet Operational Precision: Reading DRDGOLD's FY2026 Results
Surface gold tailings retreatment is one of the least glamorous corners of the mining industry. There are no deep underground shafts, no dramatic ore discoveries, and no geological surprises that send share prices surging overnight. What this model offers instead is something far more valuable to long-term investors: predictability, scalability, and extraordinary leverage to gold price movements when operational discipline is maintained across every layer of the organisation.
That structural reality makes the DRDGOLD annual results and dividend payout particularly instructive for FY2026. The numbers themselves are striking, but the more important story lies in what they reveal about the mechanics of tailings retreatment economics, the arithmetic of unhedged gold exposure, and the forward implications of a capital programme that is gradually transitioning from investment phase to production harvest.
When big ASX news breaks, our subscribers know first
FY2026 Financial Performance: The Numbers Behind the Headlines
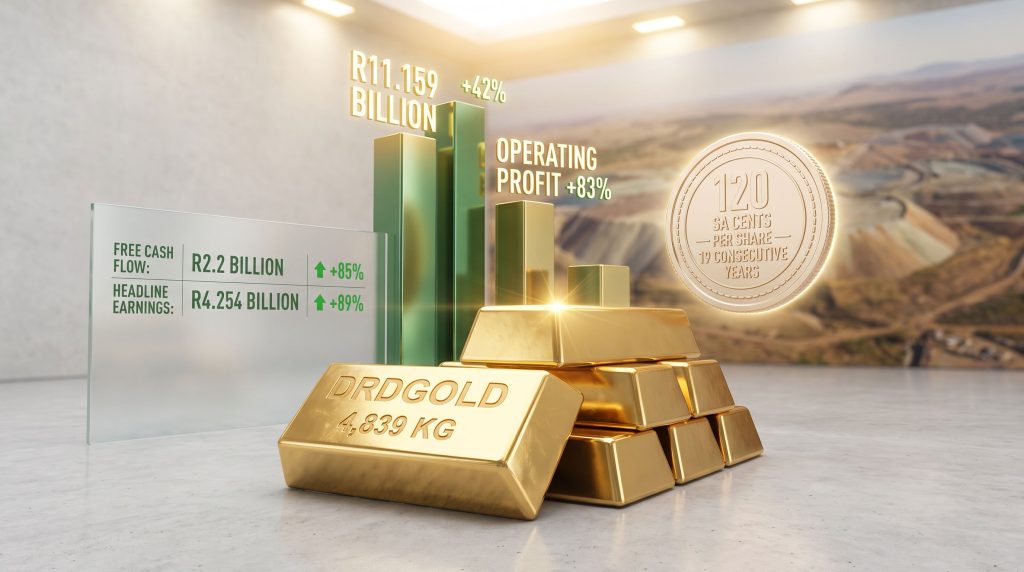
For the financial year ended 30 June 2026, DRDGOLD reported revenue of R11.159 billion, representing a 42% year-on-year increase. This top-line growth cascaded powerfully through the income statement, producing an 83% surge in operating profit to R6.452 billion and an 89% uplift in headline earnings to R4.254 billion.
The full financial picture is best understood in tabular form:
| Financial Metric | FY2026 Result | Year-on-Year Change |
|---|---|---|
| Total Revenue | R11.159 billion | +42% |
| Operating Profit | R6.452 billion | +83% |
| Headline Earnings | R4.254 billion | +89% |
| Earnings Per Share | 492.1 SA cents | +89% |
| Free Cash Flow | R2.2 billion | +85% |
| Cash Operating Costs | Below R1 million/kg | +7% YoY |
| Gold Production | 4,839 kg | Exceeded guidance |
| Capital Expenditure | R3.5 billion | Active infrastructure cycle |
The asymmetry between revenue growth and cost growth is the analytical centrepiece of these results. Cash operating costs rose by just 7% year-on-year, remaining below the psychologically significant threshold of R1 million per kilogram, at a time when South Africa's mining cost environment is characterised by persistent double-digit inflation across electricity, labour, reagents, and logistics.
Furthermore, when reviewing the broader gold price outlook for 2025 and beyond, it becomes clear why cost discipline at this level is so competitively significant.
A 7% cost increase against 42% revenue growth is not merely good performance. It is the operational leverage mechanism that transforms a favourable gold price environment into an 83% operating profit surge. Understanding this gap is fundamental to understanding why tailings retreatment businesses can deliver outsized returns during commodity upswings.
The cost discipline achieved was explicitly described by DRDGOLD CEO Niël Pretorius as testimony to genuinely strong internal management, given the breadth of double-digit cost pressures that characterise gold production inputs across South Africa.
Production Performance: Why 4,839 kg Matters More Than It Appears
DRDGOLD's full-year gold production of 4,839 kg exceeded the top end of annual guidance by approximately 5,000 oz (roughly 156 kg), placing the company within approximately 161 kg of the five-tonne annual production milestone. For a tailings retreatment operation, that proximity to five tonnes is operationally significant and sets a clear psychological and logistical target for FY2027.
The Throughput Mix: A Methodology Rarely Discussed Outside the Industry
The outperformance against guidance was attributed specifically to intelligent throughput mix management. This is a concept that is poorly understood outside the tailings processing sector and warrants explanation.
Unlike conventional open-pit or underground mining, where grade is determined by geological conditions at the mining face, surface tailings retreatment operations draw material from large historical waste deposits that contain variable concentrations of residual gold. These deposits were created across decades of earlier mining activity, and the gold content within them is unevenly distributed depending on the original ore source, the processing technology used at the time, and the storage method employed.
Operators like DRDGOLD can actively manage the blend of material fed into processing circuits by drawing from multiple tailings storage facilities simultaneously. By adjusting the ratio of higher-grade to lower-grade feed material, processing plants can be optimised to maximise gold recovery without necessarily increasing throughput volumes or operating costs proportionally. This is the throughput mix strategy that management described as the key variable behind guidance outperformance.
An average recovered grade of just under 0.2 grams per tonne (g/t) was achieved across processing plants during FY2026, representing a 2% improvement on the prior year. At first glance, 0.2 g/t appears extraordinarily low compared with conventional underground gold mines, where grades of 5–10 g/t are common. However, the economics of tailings retreatment operate on entirely different principles: the material is already at surface, requires no drilling or blasting, and the processing infrastructure is fixed and largely depreciated. At scale and with gold prices at current levels, sub-0.2 g/t material can be highly profitable.
Ergo's Second-Half Step-Change
The Ergo operation on the East Rand delivered an exceptional second-half performance, lifting gold output by approximately 150 kg per month during the final six months of FY2026. This step-change improvement was directly material to full-year guidance outperformance. Ergo's full-year revenue reached R8.1 billion in FY2026, compared with R5.7 billion in FY2025, a 42% uplift at the operational level achieved during a period when the rand gold price was averaging approximately R2,460,000 per kilogram.
Consequently, understanding the gold price impact on mining equities helps contextualise why Ergo's performance translated so powerfully into headline earnings growth during this period.
The No-Hedging Policy: A Structural Amplifier With Dual Consequences
With the exception of a brief period in 2018 when cash flow protection was required, DRDGOLD has maintained a deliberate no-hedging policy throughout its operating history. This decision is not simply a preference; it is a strategic commitment that fundamentally shapes the company's risk and return profile.
The approximately 40% increase in the gold price during FY2026 flowed directly and entirely into DRDGOLD's revenue line. There were no forward sales contracts limiting upside participation, no options strategies dampening the benefit of price appreciation. The full 40% gold price gain translated into a 42% revenue increase, with the slight additional lift attributable to production volume outperformance.
For income-focused investors, the no-hedging policy creates a critically important dynamic: dividend capacity is directly correlated with gold price cycles. In years of gold price strength, distributions can surge dramatically. In years of gold price weakness, that same unhedged exposure transmits downside risk fully into free cash flow and dividend capacity.
This distinguishes DRDGOLD from hedged producers who sacrifice upside participation in exchange for revenue predictability. The FY2026 results represent the maximum potential expression of the no-hedging philosophy in a favourable price environment, but investors must price in the full symmetry of that exposure across the cycle.
DRDGOLD Annual Results and Dividend Payout: 19 Years of Consecutive Returns
The declaration of a gross final cash dividend of 120 SA cents per share for FY2026 represents a 200% increase on the prior year's 40 SA cents per share. After the application of a 20% dividend withholding tax, the net dividend to local shareholders is 96 SA cents per share.
The aggregate payout exceeds R1 billion, a figure that carries particular historical resonance: it is approximately equal to the entire market capitalisation of DRDGOLD at the time Niël Pretorius delivered his first results presentation to investors 19 years ago. Investors seeking broader context around gold investment options will find that few vehicles combine income consistency of this kind with direct gold price exposure.
Dividend Calendar: Key Dates for FY2026
| Dividend Parameter | Detail |
|---|---|
| Gross Final Dividend | 120 SA cents per share |
| Net Local Dividend (post-20% WHT) | 96 SA cents per share |
| Prior Year Comparative | 40 SA cents per share |
| Year-on-Year Growth | +200% |
| Last Day to Trade Cum-Dividend | 8 September 2026 |
| Ex-Dividend Date | 9 September 2026 |
| Record Date | 11 September 2026 |
| Payment Date | 14 September 2026 |
The FY2026 final dividend marks DRDGOLD's 19th consecutive year of returning capital to shareholders. This consistency record is notable in the context of South African gold mining, where regulatory complexity, infrastructure constraints, and volatile input costs have forced multiple peers to suspend or eliminate dividends during difficult periods.
Free cash flow of R2.2 billion provided approximately 2.2 times coverage of the R1 billion-plus dividend, a conservative payout ratio that preserves balance sheet capacity for continued Vision 28 capital deployment while still delivering a transformative increase in shareholder returns.
Vision 28: The Capital Cycle That Will Shape Future Dividend Capacity
Understanding the full implications of the DRDGOLD annual results and dividend payout requires understanding Vision 28, the multi-year capital investment programme designed to add approximately one additional tonne of annual gold production through expanded processing capacity and infrastructure.
In FY2026, capital expenditure reached R3.5 billion, reflecting an active and intensive infrastructure investment cycle. This is the context in which the current free cash flow and dividend figures must be evaluated. The company is simultaneously:
- Generating R2.2 billion in free cash flow despite heavy capital spending
- Funding a R3.5 billion infrastructure programme to grow future production
- Distributing over R1 billion to shareholders through the final dividend
The Vision 28 trajectory creates what management has framed as a structural dividend amplification opportunity:
| Capital Phase | Characteristic | Dividend Implication |
|---|---|---|
| Current (FY2026) | Peak capex cycle (R3.5 billion) | Dividend constrained relative to earnings potential |
| Mid-term | Declining capex as sub-projects complete | Expanding free cash flow pool |
| Post-Vision 28 | Maintenance-level capex only | Maximum distributable cash potential |
The logic is straightforward: as individual Vision 28 sub-projects are commissioned and the infrastructure investment burden declines, a larger proportion of operating cash generation becomes available for distribution. If gold prices remain near current levels through this transition, the arithmetic of higher production volumes combined with lower capital requirements creates a substantially enlarged dividend capacity relative to FY2026 levels.
This is precisely what management has described as the forward commitment linking Vision 28 completion to enhanced shareholder returns, a promise that is expected to find increasing expression in how the market prices the company's shares over the coming years as sub-project milestones are achieved.
The next major ASX story will hit our subscribers first
The Human Capital Dimension: Why Organisational Execution Defined FY2026
One of the less frequently analysed dimensions of DRDGOLD's FY2026 outperformance is the organisational breadth required to achieve it. CFO Henriette Hooijern was direct in attributing Ergo's exceptional second-half results to the performance of operational teams across all functions, making clear that the production uplift required people operating at full capacity throughout the organisation.
COO Jaco Schoeman reinforced this perspective by emphasising that results of this magnitude required every level of the business to perform simultaneously, from site-level operational staff and contractors through to consultants, support functions, and board-level decision making.
This framing is analytically important. It positions FY2026 outperformance as a systemic organisational achievement rather than the product of a single favourable variable. In tailings retreatment operations, where the geological input material is essentially fixed and grade cannot be selectively mined upward, the primary levers of performance are throughput management, plant availability, reagent optimisation, and contractor coordination. All of these are human-driven processes that require consistent execution across complex multi-site operations.
In addition, those looking to compare different gold mining stock types will find that DRDGOLD's tailings-focused model sits in a distinct category — one where human execution and throughput management, rather than geological fortune, determine outcomes.
Frequently Asked Questions: DRDGOLD FY2026 Annual Results and Dividend
What was DRDGOLD's total revenue for FY2026?
DRDGOLD reported total revenue of R11.159 billion for the financial year ended 30 June 2026, a 42% increase compared with the prior year, driven by a 40% rise in the gold price and production volume outperformance. The full breakdown is available via DRDGOLD's investor reports for those seeking additional detail.
How much was DRDGOLD's FY2026 final dividend?
The company declared a gross final dividend of 120 SA cents per share (96 SA cents net of 20% dividend withholding tax), representing a 200% increase on the prior year's 40 SA cents per share, with a total aggregate payout exceeding R1 billion.
When is DRDGOLD's FY2026 dividend payment date?
The dividend payment date is 14 September 2026, with the last day to trade cum-dividend on 8 September 2026, the ex-dividend date on 9 September 2026, and the record date on 11 September 2026.
How many consecutive years has DRDGOLD paid a dividend?
FY2026 marks DRDGOLD's 19th consecutive year of paying a dividend, an uncommon consistency record among mid-tier South African gold producers. Furthermore, the central bank gold demand environment underpinning current gold prices has materially supported the capacity for distributions at this scale.
What is Vision 28 and why does it matter?
Vision 28 is DRDGOLD's multi-year capital investment programme targeting approximately one additional tonne of annual gold production. As sub-projects are commissioned and capital expenditure requirements decline, future free cash flow and dividend capacity are expected to improve materially. Analysts tracking the DRDGOLD annual results and dividend payout trajectory will find this programme central to any forward-looking assessment.
Does DRDGOLD hedge its gold production?
No. DRDGOLD maintains a deliberate no-hedging policy, meaning its revenue moves in full alignment with spot gold price movements. This allowed the company to capture the complete benefit of the approximately 40% gold price increase during FY2026. For further context, Yahoo Finance's earnings coverage provides additional independent analysis of the year's results.
What was DRDGOLD's gold production for FY2026?
DRDGOLD produced 4,839 kg of gold in FY2026, surpassing the top end of its annual production guidance by approximately 5,000 oz through intelligent throughput mix management across its processing operations. Investors monitoring DRDGOLD's dividend history will note how this production consistency underpins the company's long-standing distribution track record.
This article is intended for informational purposes only and does not constitute financial advice. Past performance, including dividend history and production outcomes, is not necessarily indicative of future results. Forecasts and strategic projections referenced herein reflect management commentary and are subject to material risks including gold price volatility, operational disruptions, and capital programme delays. Investors should conduct independent due diligence before making any investment decisions.
Want to Catch the Next Major ASX Mineral Discovery Before the Broader Market Does?
Discovery Alert's proprietary Discovery IQ model delivers real-time alerts on significant ASX mineral discoveries, transforming complex mineral data into clear, actionable insights for investors at every experience level — explore historic discoveries and their extraordinary returns to understand the scale of opportunity, then begin your 14-day free trial to position yourself ahead of the market.