
August 13, 2026
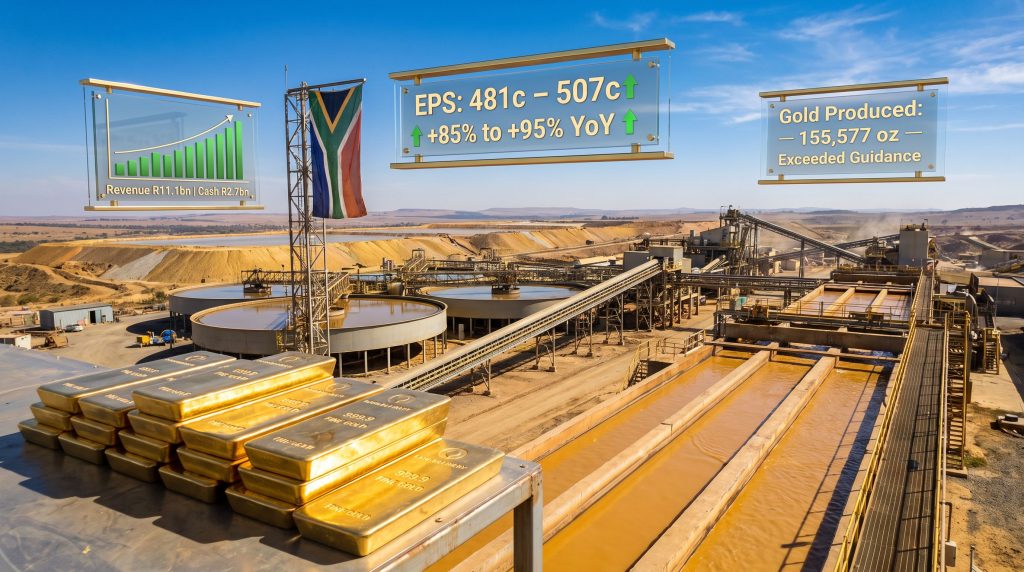
The Hidden Economics of Processing Waste: Why Tailings Reprocessing Is Rewriting Gold Sector Margins
Few corners of the global gold industry have attracted as much quiet attention as surface retreatment operations. While conventional underground mining commands headlines through new discoveries and shaft development, a more methodical and financially compelling model has been gaining ground across the Witwatersrand Basin. The systematic reprocessing of historic tailings deposits left behind by a century of South African gold mining is built on predictable ore bodies, no underground risk, and scalable processing infrastructure — and it is now delivering some of the most compelling earnings growth visible anywhere on the JSE.
DRDGOLD higher full-year production earnings data released ahead of its August 19, 2026 results publication illustrates precisely why this business model deserves a closer look from investors tracking gold sector dynamics. Furthermore, understanding the gold price and mining equities relationship is essential context for interpreting these results.
When big ASX news breaks, our subscribers know first
What Surface Retreatment Mining Actually Involves
To appreciate the financial results now emerging from this sector, it helps to understand what surface gold retreatment actually requires from an operational standpoint.
Historic tailings deposits across the Witwatersrand were created when earlier generations of gold processing technology could not extract all available gold from ore. The remaining material, still containing measurable gold content, was deposited into large surface dumps and slime dams across the greater Johannesburg region. Modern hydrometallurgical techniques, particularly carbon-in-leach and carbon-in-pulp cyanidation circuits, can recover gold from these deposits at grades previously considered uneconomic.
The key operational characteristics that distinguish this model from conventional mining include:
- No underground infrastructure required, eliminating shaft sinking costs, ventilation expenses, and the elevated safety risks associated with deep-level extraction
- Pre-defined ore body geometry, since tailings deposits are surface features with known dimensions and relatively predictable gold distribution
- Environmental remediation value, as the removal and reprocessing of tailings reduces acid mine drainage risks and heavy metal contamination of surrounding land and groundwater — a point underscored by the growing importance of mine reclamation importance in modern mining economics
- Modular throughput flexibility, allowing processing volumes to be scaled in response to gold price movements and reagent availability
This structural distinction matters enormously when interpreting DRDGOLD's FY2026 results, because the cost and risk profile of this business is fundamentally different from anything operating thousands of metres underground.
Breaking Down DRDGOLD's FY2026 Financial Performance
The trading statement released ahead of the full annual results provides a comprehensive picture of how both earnings and operational metrics evolved over the financial year ended June 30, 2026.
| Metric | FY2025 | FY2026 | Change |
|---|---|---|---|
| Earnings Per Share (EPS) | 260c | 481c to 507c | +85% to +95% |
| Gold Produced | Below 155,577 oz | 155,577 oz | Exceeded upper guidance |
| Gold Sold | Est. ~150,000 oz | 156,413 oz | Above guidance ceiling |
| Revenue | Est. ~R7.8bn | R11.1bn | +42% YoY |
| Cash Operating Costs | Est. ~R895,000/kg | R967,544/kg | Below R995,000/kg guidance |
| Cash and Equivalents | R1.3bn | R2.7bn | +108% |
| Total Capital Expenditure | Est. ~R2.2bn | R3.5bn | +57% |
The most striking figure is the EPS re-rating. According to DRDGOLD's reports and results, a forecast increase of between 85% and 95% year-on-year, translating to a range of 481c to 507c against the prior year's 260c, represents one of the most significant earnings growth rates reported by any JSE-listed gold producer for the 2026 financial year. It is also worth noting this follows a prior year that itself delivered approximately 69% headline earnings growth, meaning DRDGOLD has now produced back-to-back years of exceptional earnings acceleration.
Revenue Growth vs. Cost Growth: The Core Earnings Story
The fundamental arithmetic underpinning this earnings performance is straightforward but powerful. Revenue grew by 42% year-on-year to R11.1 billion, while total cash operating costs rose by only 8% year-on-year to R4.7 billion. This 34-percentage-point spread between revenue growth and cost growth is where margin expansion becomes substantial.
In surface retreatment operations, the rand gold price is the dominant revenue lever because throughput volumes tend to be relatively stable and grades shift gradually rather than dramatically. When the rand gold price moves sharply higher, as it did across the 2026 financial year, the operating leverage inherent in a cost structure anchored by labour, reagents, and electricity becomes highly visible in earnings. Considering gold as a strategic investment helps explain why this price momentum has been so sustained.
The 42% revenue growth against 8% cost growth in FY2026 represents the kind of earnings leverage that conventional underground miners, with their deeper fixed cost bases and more volatile production profiles, typically struggle to replicate at comparable gold price levels.
Did DRDGOLD Beat Its Own Production Guidance?
Production guidance for the year ended June 30, 2026 had been established at 140,000 oz to 150,000 oz, with a cash operating cost ceiling of approximately R995,000/kg. Both targets were beaten.
Actual gold production reached 155,577 oz, exceeding the upper boundary of the guided range by more than 5,500 oz — an outperformance of approximately 3.7% above the guided ceiling. Gold sold came in at 156,413 oz, reflecting a small inventory drawdown that pushed sales slightly above production.
Cash operating costs of R967,544/kg came in meaningfully below the guided figure, representing a positive variance of roughly R27,500/kg against the R995,000/kg guidance ceiling.
The production beat is particularly notable because it was achieved despite:
- Ongoing sodium cyanide supply constraints affecting reagent availability across South African processing operations
- Diesel cost inflation linked to geopolitical pressures in the Middle East affecting fuel supply chains
- Regulatory delays around water-use licence approvals for specific reclamation sites, forcing additional trucking logistics
- Electricity tariff increases of 12% at the Far West Gold Recoveries subsidiary
Outperforming production guidance in a cost-inflationary environment, while simultaneously keeping costs below the guided ceiling, is a meaningful demonstration of operational maturity.
How the Two Core Subsidiaries Performed in FY2026
DRDGOLD operates through two primary subsidiaries, each processing tailings across different parts of the Witwatersrand Basin with distinct cost profiles and throughput characteristics.
Ergo Mining: Scale Advantage With Rising Input Costs
Ergo Mining is the larger of the two subsidiaries and processes tailings across multiple sites in the eastern and central Witwatersrand region.
- Revenue climbed 42% year-on-year to R8 billion, almost entirely driven by the 40% increase in the rand gold price received
- Gold sold increased 2% to 3,521 kg, a modest volume improvement that amplified the price-driven revenue gain
- Throughput tonnages declined 3% year-on-year to 19 million tonnes, reflecting site-specific constraints rather than a structural processing limitation
- Cash operating costs rose 7% year-on-year to R3.9 billion
The cost pressures at Ergo stemmed from three identifiable sources. First, sodium cyanide supply disruptions within South Africa created reagent shortages that increased procurement costs and logistical complexity. Sodium cyanide is the primary lixiviant used in gold cyanidation circuits and is not easily substituted. Second, diesel costs rose as Middle East conflict dynamics fed through into South African fuel markets. Third, and perhaps most operationally significant, water-use licence approvals for certain planned reclamation sites remained pending, requiring the subsidiary to truck material from alternative locations at higher unit cost. Once these licences are secured, the elevated trucking costs should reduce materially, representing a potential near-term cost reduction catalyst. Notably, record-breaking profits are being ploughed back into Ergo, reinforcing management's confidence in the subsidiary's long-term potential.
Far West Gold Recoveries: Yield Compression Against Stable Throughput
Far West Gold Recoveries operates in the western Witwatersrand region and processes a different character of tailings material compared to Ergo.
- Revenue grew 40% year-on-year to R3 billion, again driven primarily by rand gold price appreciation
- Gold sold dipped 1% to 1,344 kg, a marginal decline attributable to grade variability in the material being processed
- Gold yield contracted from 0.222 g/t to 0.218 g/t year-on-year, a reduction of roughly 1.8% reflecting the specific composition of tailings being processed during the period
- Throughput tonnages held steady at 6.1 million tonnes, demonstrating processing plant stability
- Cash operating costs rose 10% to R743 million, driven by higher reagent volumes required by the material characteristics and a 12% increase in electricity costs
| Metric | Ergo Mining | Far West Gold Recoveries |
|---|---|---|
| Revenue | R8bn (+42% YoY) | R3bn (+40% YoY) |
| Gold Sold | 3,521 kg (+2%) | 1,344 kg (-1%) |
| Throughput | 19Mt (-3%) | 6.1Mt (stable) |
| Cash OpEx | R3.9bn (+7%) | R743m (+10%) |
| Key Cost Driver | Reagents, diesel, trucking | Reagents, electricity tariffs |
The yield compression at Far West Gold Recoveries is a characteristic challenge in tailings reprocessing that investors often underestimate. Unlike hard rock mining where the ore body grade can be partially controlled through selective mining, tailings processing draws from a fixed deposit with variable gold distribution. Managing this variability through blending strategies and circuit optimisation is a core technical competency for tailings processors. In addition, understanding cut-off grade economics is particularly relevant when evaluating how operators determine which sections of a tailings facility to process and in what sequence.
Understanding the Cost Pressures: Systemic Risks to Surface Processing Operations
Several cost pressures visible in the FY2026 results are not isolated events but structural features of South African processing operations that warrant closer examination.
Sodium Cyanide Supply: A Systemic Vulnerability
South Africa's domestic sodium cyanide supply has faced documented constraints, partly related to manufacturing capacity limitations and partly to import logistics. For gold processing operations that rely on cyanidation as their primary extraction method, any disruption to cyanide supply creates direct production risk and cost escalation. Unlike some consumables where alternative suppliers are accessible, industrial-grade sodium cyanide has limited substitutes in conventional gold leaching circuits, making supply security a genuine strategic concern for the sector.
Electricity Tariff Inflation: A Structural Cost Headwind
The 12% increase in electricity costs at Far West Gold Recoveries reflects a broader pattern of above-inflation tariff increases from Eskom, South Africa's state power utility. Surface retreatment plants are significant electricity consumers, particularly for pump operations, milling circuits, and aeration systems used in cyanidation. Unlike underground mines that might offset some electricity exposure through diesel generation flexibility, surface plants are heavily grid-dependent, making tariff escalation a structural margin headwind that compounds over multi-year periods.
Electricity tariff increases across South Africa have consistently outpaced general inflation over the past decade. For energy-intensive surface processing operations, this represents a slow-moving but persistent compression force on operating margins unless offset by production volume growth or gold price appreciation.
Water-Use Licences as a Regulatory Cost Amplifier
The pending water-use licence approvals affecting specific Ergo Mining reclamation sites represent a regulatory friction cost that is both direct and indirect. The direct cost is the elevated trucking required to move material between sites. The indirect cost is the opportunity cost of not being able to access potentially higher-grade or more efficiently located tailings material. The regulatory pathway for water-use licences in South Africa can be protracted, creating planning uncertainty for operators who need to sequence reclamation activities years in advance.
The next major ASX story will hit our subscribers first
Balance Sheet Strength Heading Into a Capital Expansion Phase
Perhaps the most strategically significant aspect of the FY2026 trading statement is the state of the balance sheet entering the next development phase.
Cash and cash equivalents more than doubled from R1.3 billion to R2.7 billion over the financial year — a remarkable accumulation given that the company simultaneously paid out R779 million in dividends to shareholders. The ability to double the cash position while distributing nearly R800 million in returns reflects the free cash flow generation capacity of the business at current rand gold price levels.
To further underpin its capital expansion programme, DRDGOLD maintains two fully undrawn credit facilities with Nedbank Corporate and Investment Banking:
- A R1 billion revolving credit facility with a R500 million accordion option providing additional capacity if required
- A R500 million general banking facility
Both facilities remain completely undrawn, meaning the company enters its next phase of capital deployment with approximately R2.7 billion in cash plus R1.5 billion in available credit, for a total liquidity position of roughly R4.2 billion before any operational cash generation.
The 57% increase in total capital expenditure to R3.5 billion signals that management is deploying this financial strength into growth infrastructure. For a tailings processing business, capital expenditure typically encompasses new tailings facilities, additional processing capacity, pipeline infrastructure, and reclamation equipment. This level of CapEx expansion suggests confidence in the forward economics of the business at current and projected rand gold price levels.
Two Consecutive Years of Accelerating Earnings: What the Pattern Reveals
| Performance Indicator | FY2025 | FY2026 |
|---|---|---|
| EPS Growth | Approximately +69% YoY | +85% to +95% YoY |
| EPS Absolute | 260c | 481c to 507c |
| Cash Position | R1.3bn | R2.7bn |
| Production vs. Guidance | Within range | Exceeded upper end by 5,500+ oz |
| CapEx Trajectory | Moderate | +57% YoY to R3.5bn |
Two consecutive years of accelerating earnings growth is a pattern that typically triggers valuation re-rating discussions among institutional investors. For JSE-listed gold producers specifically, sustained earnings growth at this magnitude is relatively rare, partly because conventional underground operations face escalating depth penalties, labour constraints, and geological complexity that tend to push costs higher over time. However, DRDGOLD higher full-year production earnings outcomes reflect a structurally different operating model that is less exposed to these headwinds.
The surface retreatment model benefits from a fundamentally different cost trajectory. As processing technology improves and operators develop deeper understanding of their tailings inventory, recovery rates can be maintained or improved even as the nominal grade of material being processed gradually declines. This dynamic creates a more predictable earnings profile than underground operations, which makes the consecutive-year earnings acceleration story more credible as a sustainable trend. Consequently, investors searching for undervalued gold stocks may find the tailings processing sector particularly worthy of attention given these structural advantages.
Frequently Asked Questions: DRDGOLD FY2026 Production and Earnings
What EPS growth is DRDGOLD expecting for the year ended June 30, 2026?
DRDGOLD has guided for earnings per share growth of between 85% and 95%, translating to an EPS range of 481c to 507c, compared with 260c reported in the prior financial year.
When will DRDGOLD publish its full-year results?
The company indicated it plans to release its full financial results on August 19, 2026.
How much gold did DRDGOLD produce in FY2026?
DRDGOLD produced 155,577 oz of gold for the year ended June 30, 2026, exceeding the upper end of its guided range of 140,000 oz to 150,000 oz by more than 5,500 oz.
What were DRDGOLD's cash operating costs for FY2026?
Cash operating costs came in at R967,544/kg, below the company's own guidance of approximately R995,000/kg, reflecting disciplined cost management despite sector-wide inflationary pressures.
What financing facilities does DRDGOLD have in place?
DRDGOLD holds a R1 billion revolving credit facility (with a R500 million accordion option) and a R500 million general banking facility, both arranged with Nedbank Corporate and Investment Banking and both currently fully undrawn.
Why did Far West Gold Recoveries experience a yield decline in FY2026?
Gold yield at Far West Gold Recoveries contracted from 0.222 g/t to 0.218 g/t year-on-year, reflecting the specific characteristics of the tailings material being processed during the period. In surface retreatment operations, yield variability is an inherent feature of processing heterogeneous historic deposits rather than freshly mined ore.
Why did Ergo Mining incur higher trucking costs in FY2026?
Pending water-use licence approvals for specific planned reclamation sites required Ergo Mining to transport material from alternative locations, adding logistics costs that would not ordinarily be incurred under normal site sequencing. These costs are expected to reduce once the relevant regulatory approvals are obtained. Furthermore, the DRDGOLD higher full-year production earnings result demonstrates that even elevated logistics costs were insufficient to prevent a strong overall performance.
This article contains forward-looking information derived from company trading statements and operational disclosures. Actual results may differ materially from those forecast. This content does not constitute financial advice. Readers should conduct independent research and consult a qualified financial adviser before making investment decisions. All financial figures are sourced from DRDGOLD's published trading statement for the year ended June 30, 2026, as reported by Mining Weekly.
Want to Stay Ahead of the Next Major Mineral Discovery?
Discovery Alert's proprietary Discovery IQ model delivers real-time alerts on significant ASX mineral discoveries, instantly translating complex data into actionable investment insights for traders and investors at every experience level — explore historic discoveries that have generated exceptional returns, then begin your 14-day free trial at Discovery Alert to secure your market-leading edge.