August 13, 2026
When Rate Expectations Shift, Gold Listens
Few forces reshape precious metals markets as rapidly or as decisively as a change in interest rate expectations. The mechanism is well understood by seasoned market participants but frequently underestimated by casual observers: gold carries no yield, pays no dividend, and generates no coupon. Its opportunity cost, therefore, is entirely defined by what investors sacrifice by holding it instead of interest-bearing instruments. When that sacrifice shrinks because rate expectations fall, capital flows toward bullion with remarkable speed.
This is precisely the dynamic playing out in August 2026, as gold prices surge toward a 2-month high on the back of softening labour market data and a broader repricing of Federal Reserve policy assumptions. The move is not incidental. It reflects a structural realignment of how markets are interpreting the trajectory of US monetary policy, and the implications extend well beyond a single weekly gain.
When big ASX news breaks, our subscribers know first
The Interest Rate Transmission Mechanism: Gold's Core Driver
Understanding why gold responds so sharply to rate expectation shifts requires unpacking a concept that is often described but rarely explained with precision: the real interest rate.
Nominal interest rates alone do not determine gold's appeal. What matters is the real rate, which is the nominal rate adjusted for inflation. When real rates are negative or falling, the cost of holding a non-yielding asset like gold effectively disappears or even inverts in gold's favour. Historically, the periods of strongest gold appreciation have almost universally coincided with declining real interest rate environments.
The current rally fits this pattern. Weaker-than-anticipated US payroll figures shifted market pricing away from additional Federal Reserve tightening, compressing the expected forward path of nominal rates. With inflation still present in the system, the implied real rate fell further still, creating a near-ideal backdrop for bullion appreciation. The gold bonds dynamics at play here underscore just how interconnected these variables have become in 2025 and beyond.
This is why gold's sensitivity to labour market data has intensified in recent years. Employment figures have become a leading signal for rate trajectory, which in turn drives the real rate calculation that underpins gold valuation.
Where Gold Stands Now: Decoding the Key Price Levels
The price action in the current rally carries meaningful information for both technical and fundamental analysts.
| Metric | Price Level | Significance |
|---|---|---|
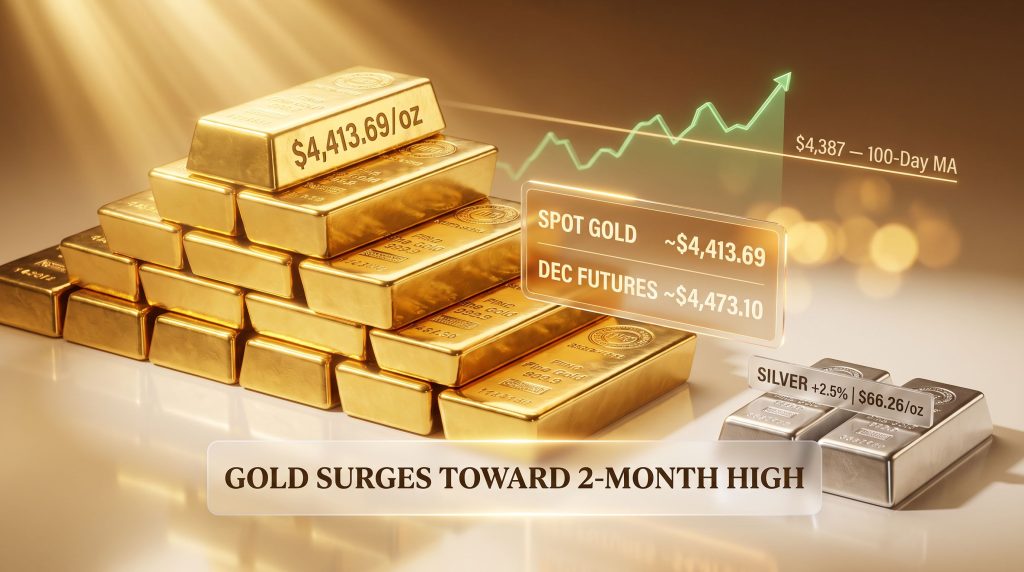
| Spot Gold | ~$4,413.69/oz | Real-time physical market benchmark |
| December Futures | ~$4,473.10/oz | Forward-looking contract price |
| Prior Session Settlement | ~$4,340.70/oz | Highest close since mid-June |
| 100-Day Moving Average | ~$4,387/oz | Technical ceiling tested and briefly breached |
| 2-Month High Target Zone | Above $4,400/oz | First sustained close above this level since early June |
The spread between spot gold and December futures deserves particular attention. The roughly $59 gap between the two reflects what traders call the cost of carry, which incorporates storage costs, insurance, and prevailing interest rates. A widening contango structure, where futures trade at a meaningful premium to spot, signals that forward-looking market participants are pricing in continued upside over the medium term.
The 100-Day Moving Average: More Than a Technical Line
The 100-day moving average near $4,387 per ounce functioned as a critical inflection point during Tuesday's session. Gold briefly pierced this level before retreating, producing only the second negative close of the month. This type of resistance encounter is instructive for two reasons:
- It confirms that algorithmic and rules-based trading systems are actively responding to this level, creating self-reinforcing selling pressure near the threshold.
- It suggests that any sustained close above $4,387 would likely trigger additional momentum buying from trend-following strategies, potentially accelerating the next leg higher.
The subsequent recovery through Wednesday, with spot gold advancing 1.1 percent to $4,413.69 per ounce, indicates that bullish conviction was sufficient to absorb the technical selling and push through the resistance zone. You can track live commodity price movements to monitor how these levels evolve in real time.
Silver's Sharper Move: Reading the Precious Metals Participation Signal
While gold captured headlines, silver's performance during the same period offered a subtler but important signal about the breadth of the precious metals rally.
| Metal | Price Move | Level | Context |
|---|---|---|---|
| Gold (Spot) | +1.1% | ~$4,413.69/oz | Approaching 2-month high |
| Silver (Spot) | +2.5% | ~$66.26/oz | Highest since late June |
Silver's outperformance on a percentage basis is a pattern that repeats across most meaningful precious metals bull phases, and the reasons are structural rather than coincidental. Silver operates in a significantly smaller market than gold by total dollar value. This means equivalent capital inflows produce proportionally larger price moves.
Furthermore, silver carries a dual identity as both a monetary metal and an industrial input, with substantial demand from solar panel manufacturing, electronics, and battery technologies. When investor sentiment toward precious metals improves, silver captures both the monetary safe-haven flow and anticipation of industrial demand recovery.
The gold-to-silver ratio, currently implied at approximately 66:1 based on these price levels, remains historically elevated compared to the long-term average closer to 50:1. Analysing the gold silver ratio in depth reveals how this divergence can signal relative value opportunities during rally phases, though this ratio can remain stretched for extended periods without mean-reverting. Investors using this ratio as a valuation tool should treat it as one input among many rather than a standalone signal.
The Three Forces Powering This Rally
Labour Market Weakness and the Fed Repricing Effect
The most direct catalyst for gold's best weekly performance since January 2026 was weaker-than-expected US employment data. When payroll figures disappoint, the sequence of market reactions typically follows a predictable path:
- Traders reduce bets on further Federal Reserve rate increases.
- Short-term US Treasury yields decline, compressing real rates.
- The US dollar softens as rate differentials narrow.
- Gold, priced in dollars and sensitive to real rates, advances.
This chain reaction unfolded with notable speed following the payroll release, producing the sharpest weekly gold gain in approximately seven months. The velocity of the move reflects how heavily positioned markets had become around a hawkish Fed scenario, meaning the unwind of those positions added momentum beyond what the fundamental shift alone might have justified.
Pre-CPI Positioning: Markets Holding Their Breath
The upcoming US Consumer Price Index release represents the next critical inflection point for the gold price trajectory. The market's response will depend not just on the headline number but on its composition.
A softer-than-expected inflation print would reinforce the repricing of rate expectations already underway, providing fresh fundamental support for gold's advance. Conversely, elevated gasoline prices have kept headline inflation stickier than underlying core trends might suggest, and an above-consensus reading driven by energy components could temporarily cap bullion's upside even if the Fed's medium-term posture remains cautious.
UBS analysts noted in commentary around this period that a lower inflation reading would support further gold price appreciation, while persistently high gasoline prices represent a structural constraint on near-term upside potential if they keep headline CPI elevated. This captures a genuine tension in the current macro environment: the labour market may be softening, but energy-driven inflation could keep the Fed's messaging cautious regardless.
Geopolitical and Safe-Haven Demand
Beyond monetary policy mechanics, structural safe-haven demand continues to provide a durable floor beneath gold prices. Several dynamics are worth understanding:
- Central bank accumulation has been running at historically elevated rates in recent years, particularly among emerging market institutions seeking to reduce US dollar exposure in reserve portfolios.
- Chinese retail and institutional gold buying has provided consistent support independent of Western rate cycle dynamics, reflecting domestic inflation concerns and limited alternative investment options within Chinese capital markets.
- ETF flow data represents a real-time indicator of Western investor sentiment, with inflows typically accelerating when geopolitical risk indices rise and decelerating during periods of equity market strength.
Comparing the Current Rally to Historical Gold Bull Phases
| Period | Primary Catalyst | Weekly Gain Context | Key Technical Level |
|---|---|---|---|
| January 2026 | Early-year risk-off sentiment | Strongest week of Q1 | $4,200/oz zone |
| June 2026 Peak | Macro uncertainty spike | Multi-week high | $4,400/oz briefly reached |
| August 2026 Current | Payroll weakness + rate repricing | Best week since January | $4,387/oz (100-day MA) |
The significance of surpassing the January benchmark is not purely statistical. Institutional risk management frameworks frequently use rolling performance windows to calibrate position sizing. A seven-month best weekly performance signals to systematic traders that momentum conditions are shifting, often prompting strategy rebalancing that reinforces the directional move.
The next major ASX story will hit our subscribers first
What Could Reverse the Gold Surge
Investors positioning around the current rally should understand the specific conditions that could undermine it.
- An above-consensus CPI print, particularly one driven by energy rather than core services, could prompt markets to re-price rate expectations back toward a hawkish Fed scenario.
- Federal Reserve officials communicating a preference for maintaining restrictive policy longer than markets currently anticipate would directly compress gold's valuation framework.
- A significant US dollar rebound driven by global risk-off equity selling could temporarily offset gold's safe-haven appeal, since dollar strength mechanically reduces the price of dollar-denominated gold in international markets.
- Profit-taking ahead of the CPI release is a near-certainty at elevated price levels, and the 100-day moving average remains an active resistance reference that systematic sellers will defend.
Forward-Looking Indicators Every Gold Investor Should Monitor
Rather than reacting to price moves after they occur, sophisticated participants track a set of leading indicators that frequently telegraph gold's next directional shift:
- US real yield movements via Treasury Inflation-Protected Securities, which provide the cleanest signal of the opportunity cost of holding gold.
- CFTC Commitments of Traders data, which reveals how speculative positioning in gold futures is evolving and whether the rally is supported by genuine conviction or vulnerable to crowded-trade unwinds.
- Gold ETF flow data, published by major providers, offers weekly evidence of whether retail and institutional investors are adding or reducing physical-backed gold exposure.
- The DXY US dollar index as a real-time cross-asset sentiment gauge, given the mechanical inverse relationship between dollar strength and gold pricing.
- Federal Reserve communication calendars, including scheduled speeches and the release of FOMC meeting minutes, which represent discrete event risk for both directions.
Frequently Asked Questions: Gold Prices Surge Toward 2-Month High
Why are gold prices rising right now?
Gold prices surge toward a 2-month high because weaker US labour market data has shifted trader expectations away from additional Federal Reserve rate increases. Since gold generates no yield, its attractiveness rises when the opportunity cost of holding it, measured by prevailing and expected interest rates, falls. The resulting repricing of rate expectations created the conditions for gold's strongest weekly performance since January 2026.
What makes $4,400 per ounce a significant threshold?
This level marks the first sustained recovery above prices last seen in early June 2026, making it simultaneously a psychological reference point and a technical benchmark. Sustained closes above this zone would signal that the prior correction has been fully reversed and could attract additional momentum-driven buying. Understanding gold as a safe haven investment helps contextualise why these thresholds carry such weight during periods of macro uncertainty.
How does inflation data affect gold prices?
Inflation data shapes Federal Reserve policy expectations. A softer CPI reading reduces the likelihood of further rate increases, lowering the implied real interest rate and therefore the opportunity cost of holding non-yielding gold. A stronger reading produces the opposite effect, at least in the short term. For a broader perspective on how analysts are framing the outlook, J.P. Morgan's gold research provides useful institutional context.
Why did gold pull back after initially hitting a near 2-month high?
Bullion encountered technical resistance at the 100-day moving average near $4,387 per ounce during Tuesday's session, prompting short-term profit-taking. This pattern is common when prices approach significant moving average thresholds before sufficient momentum builds to sustain a breakout.
Is silver a better trade than gold during this type of rally?
Silver's 2.5 percent gain outpaced gold's 1.1 percent advance on a percentage basis during the August 2026 rally period, consistent with silver's historical tendency to amplify gold's moves due to its smaller market size and dual monetary-industrial demand profile. However, this amplification works in both directions: silver typically falls more sharply than gold during risk-off episodes, making it a higher-volatility expression of the same underlying precious metals thesis.
What would cause this gold rally to reverse?
A hotter-than-expected inflation reading, hawkish Federal Reserve communication, sustained US dollar strength, or systematic profit-taking ahead of key data releases could individually or collectively suppress further appreciation in the near term. The gasoline price dynamic is particularly worth watching, since energy-driven headline inflation can complicate the Fed's communication posture even when underlying core inflation is trending lower.
Key Takeaways for Gold Market Participants
- Gold prices surging toward a 2-month high reflects a fundamental repricing of Federal Reserve rate expectations following weaker US payroll data, not a speculative spike.
- The $4,400 per ounce zone carries both technical and psychological weight; sustained closes above this level would represent an important bullish confirmation.
- The upcoming US CPI release is the single most consequential near-term catalyst; its composition, particularly the energy component, matters as much as the headline figure.
- Silver's sharper percentage gains indicate broad precious metals market participation beyond gold-specific flows, which historically has been associated with more durable rally phases rather than isolated moves in a single metal.
- Real interest rates, not nominal rates alone, are the correct framework for evaluating gold's fundamental valuation at any point in the cycle.
- Investors should monitor CFTC positioning data and ETF flow figures alongside price action to assess whether momentum is supported by genuine capital allocation or is vulnerable to crowded-trade dynamics.
This article is intended for informational purposes only and does not constitute financial advice. Precious metals markets carry significant price risk, and past performance during comparable macroeconomic conditions does not guarantee future outcomes. Readers should conduct their own due diligence or consult a qualified financial adviser before making investment decisions.
Want to Catch the Next Major Mineral Discovery Before the Broader Market Does?
While gold's rate-driven rally captures headlines, the most transformative returns in the resources sector have historically come from being early to significant mineral discoveries — and Discovery Alert's proprietary Discovery IQ model delivers real-time ASX discovery alerts straight to subscribers, turning complex geological data into actionable opportunities. Explore historic discovery returns on Discovery Alert's dedicated discoveries page and begin your 14-day free trial to position yourself ahead of the market.