June 11, 2026
Understanding Economic Fundamentals Behind Resource Sector Fluctuations
South Africa's extractive industries operate within a complex web of global commodity cycles, infrastructure constraints, and structural economic pressures that create significant production volatility. The nation's mining sector demonstrates how multiple economic forces converge beyond simple supply-demand dynamics, with infrastructure bottlenecks often serving as the primary constraint on output rather than market fundamentals.
Recent patterns reveal how these interconnected factors can rapidly shift from supporting growth to constraining output across multiple mineral categories simultaneously. The South African mining production decline observed in late 2025 exemplifies this phenomenon, where logistical constraints rather than demand weakness drove sectoral performance deterioration.
When big ASX news breaks, our subscribers know first
How Infrastructure Bottlenecks Create Economic Constraint Cascades
Transport Network Economics and Operational Costs
Infrastructure limitations fundamentally reshape mining economics through cascading cost pressures that extend far beyond direct transport expenses. Transnet's freight rail network, spanning approximately 20,000 kilometres, operates as the primary bulk commodity transport mechanism, yet capacity constraints create systematic bottlenecks affecting production scheduling.
Rail capacity limitations force mining operations toward alternative transport methods, with road-based logistics incurring substantially higher per-unit costs than optimised rail systems. These transport infrastructure improvements compound through inventory management challenges, as mining operations must maintain higher working capital levels to manage scheduling uncertainties.
Critical Infrastructure Cost Escalation Factors:
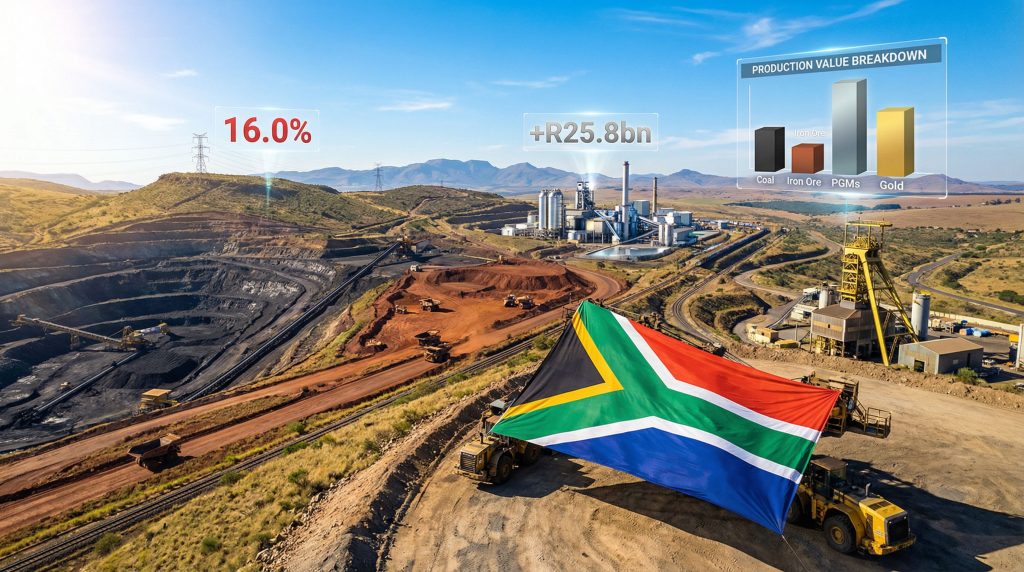
- Electricity price inflation: 16.0% annual increases affecting energy-intensive processing operations
- Water supply cost volatility: 11.6% annual growth impacting mineral processing facilities
- Labour cost pressures: approximately 6.0% annual growth outpacing productivity improvements
- Transport cost variability creating unpredictable margin compression
Port Logistics and Export Pipeline Vulnerabilities
South Africa's primary export terminals at Durban, Richards Bay, and Saldanha Bay create single-point-of-failure risks for bulk commodity exports. Port congestion and vessel scheduling delays translate directly into production volatility, as mining operations adjust output schedules around export capacity availability.
The Richards Bay Coal Terminal serves as a particularly acute example, where maintenance windows or operational disruptions create immediate production cascades affecting coal mining operations throughout Mpumalanga Province. Similarly, Saldanha Bay's iron ore export capacity directly influences production planning at major operations.
Operational Impact Assessment:
Industry analysis indicates that logistical constraints, particularly affecting coal and iron ore production, represent the primary driver of recent production volatility rather than market demand deterioration. This technical distinction proves critical for distinguishing temporary operational disruptions from structural sector decline.
Commodity-Specific Production Dynamics and Market Exposure
The Dominant Production Categories
South Africa's mining performance concentrates around four major commodity groups representing 80.3% of total production value. Each category exhibits distinct operational characteristics and market exposure patterns that influence volatility responses, as outlined in broader mining industry evolution trends.
November 2025 Production Performance Analysis:
| Commodity Category | Year-on-Year Change | Month-on-Month Change* | Revenue Impact (Jan-Nov 2025) |
|---|---|---|---|
| Platinum Group Metals | -2.8% | -4.8% | +R25.8 billion |
| Coal | -7.9% | -1.9% | -R4.2 billion |
| Iron Ore | -7.9% | -15.7% | -R7.6 billion |
| Gold | -6.0% | -10.3% | +R19.3 billion |
*Seasonally adjusted data
Platinum Group Metals: High-Value Extraction Complexities
Platinum group metals extraction occurs primarily within the Bushveld Complex, requiring deep-level mining operations often exceeding 1,500 metres in depth. These operations involve narrow reef mining with substantial labour inputs and safety-intensive protocols, creating inherent production constraints independent of market conditions.
Processing complexity requires specialised infrastructure for concentrate beneficiation and refining, with technological requirements that limit operational flexibility during market volatility periods. Despite production declining 2.8% year-on-year, PGM operations generated R25.8 billion in additional revenue during January-November 2025, demonstrating how price appreciation can overwhelm volume declines.
PGM Price Performance (November 2025):
- Platinum: +62.4% year-on-year ($1,564/oz)
- Palladium: +40.2% year-on-year ($1,415/oz)
- Rhodium: +73.1% year-on-year ($8,008/oz)
Coal Mining: Export Dependency and Infrastructure Vulnerability
South African coal operations combine underground and surface extraction methods, with export-oriented production representing approximately 20-25% of global seaborne thermal coal trade volumes. This scale creates significant infrastructure dependency on Transnet rail systems and Richards Bay Coal Terminal capacity.
Coal demonstrated the unique characteristic among major commodities of experiencing concurrent production and revenue declines in 2025. Production fell 7.9% year-on-year whilst revenue decreased R4.2 billion, reflecting 23.3% price decline to $85.5/ton that overwhelmed volume reduction benefits.
This pattern indicates global thermal coal market structural headwinds from energy transition policies and competing natural gas supply, suggesting sector challenges extending beyond cyclical demand weakness.
Iron Ore: Acute Monthly Volatility Patterns
Iron ore operations, centred primarily around Anglo American's Kumba Iron Ore facilities, demonstrated the steepest monthly production volatility among major commodities. November 2025 experienced 15.7% month-on-month seasonally adjusted decline, substantially exceeding the 7.9% year-on-year decline.
This pattern suggests acute monthly scheduling disruptions rather than sustained production deterioration, likely reflecting Saldanha Bay port maintenance cycles or vessel scheduling gaps creating temporary export pipeline disruptions. Furthermore, these patterns align with broader iron ore trends affecting global markets.
Monthly Production Volatility: Operational vs. Market Factors
Seasonal Adjustment Significance
The divergence between month-on-month seasonally adjusted data and year-on-year trends reveals important insights about production volatility sources. November 2025 marked the first production decline after six consecutive months of growth, indicating momentum disruption rather than sustained deterioration.
Critical Monthly Volatility Indicators:
- Iron ore: -15.7% month-on-month vs -7.9% year-on-year
- Gold: -10.3% month-on-month vs -6.0% year-on-year
- PGMs: -4.8% month-on-month vs -2.8% year-on-year
- Manganese: +5.0% month-on-month (only positive performer)
Maintenance Scheduling and Labour Cycle Impacts
Mining operations typically concentrate major maintenance activities during periods of anticipated lower export demand or higher inventory tolerance. Coal mining maintenance windows often align with shoulder seasons, while iron ore operations may synchronise with port maintenance cycles.
Annual leave allocation, particularly concentrated during December holiday periods, creates predictable monthly production fluctuations that seasonally adjusted data attempts to normalise. Strike activity and wage negotiation cycles add additional periodic volatility layers.
Transport Infrastructure Disruption Cycles
Bulk commodity shipping exhibits seasonal patterns influenced by Northern Hemisphere winter demand (November-March) and competing port capacity allocation between commodities and agricultural products. Vessel scheduling constraints create clustering effects around port availability windows.
The magnitude of iron ore's monthly decline exemplifies how transport infrastructure disruptions create outsized volatility independent of mining operational performance or market demand conditions.
Global Market Integration and Price Signal Transmission
Asian Economic Growth Dependencies
South African mining operations maintain strong correlations with broader Asian economic performance, particularly China's infrastructure spending patterns and India's industrial expansion trajectory. China's 5% economic growth in 2025 and India's projected 7.5% expansion provide fundamental demand support for mineral exports.
However, this dependency creates vulnerability to Asian economic policy shifts and infrastructure investment cycles. Commodity futures markets influence production planning decisions, whilst exchange rate fluctuations affect export competitiveness dynamics. Additionally, US-China trade impact continues to influence global commodity demand patterns.
Currency Hedge Characteristics in Precious Metals
Gold and platinum group metals demonstrate extraordinary price resilience during currency weakness periods. November 2025 gold prices reached $4,085/oz (+54.0% year-on-year), whilst platinum achieved $1,564/oz (+62.4% year-on-year), providing natural hedge characteristics for South African mining operations.
This currency hedge effect proved particularly valuable during periods of South African Rand depreciation and broader emerging market currency weakness. The record-high gold prices in USD terms provided revenue protection despite production volume declines.
Counter-Cyclical Performance Sectors and Resilience Patterns
Manganese: Infrastructure Demand and Battery Technology
Manganese operations demonstrated exceptional resilience with +17.0% year-on-year growth and +5.0% month-on-month expansion in November 2025, contributing +1.1 percentage points to overall sector performance. This strength reflects robust industrial steel production demand and emerging battery technology applications.
Manganese benefits from export infrastructure advantages through specialised port facilities and relatively lower transport infrastructure dependency compared to coal and iron ore bulk operations.
Diamond Extraction: Luxury Market Recovery
Diamond production achieved +27.9% year-on-year growth, contributing +0.4 percentage points to sector performance. This reflects luxury goods market recovery and industrial diamond applications growth, with high-value, low-volume characteristics providing transport infrastructure advantages.
Copper Operations: Renewable Energy Demand
Copper production recorded +8.2% year-on-year growth, driven by renewable energy infrastructure demand and electrical applications expansion. Smaller-scale operational flexibility allows copper operations to maintain production consistency despite broader infrastructure constraints.
The next major ASX story will hit our subscribers first
Revenue Performance Divergence from Production Volumes
Price Appreciation Overwhelming Volume Declines
Year-to-date mineral sales reached R767 billion compared with R739 billion in the previous year, representing R28 billion increase despite widespread production volume declines. This divergence demonstrates how commodity-specific price dynamics can overwhelm production volume impacts.
Revenue Performance by Commodity (January-November 2025):
| Commodity | Revenue Change | Primary Driver |
|---|---|---|
| PGMs | +R25.8 billion | Price appreciation (+62-73% across metals) |
| Gold | +R19.3 billion | Price strength (+54%) |
| Coal | -R4.2 billion | Price weakness (-23.3%) |
| Iron Ore | -R7.6 billion | Volume decline with modest price gain (+2.2%) |
| Chromium Ore | +R246 million | Specialised applications demand |
| Manganese | -R1.5 billion | Volume gains offset by price moderation |
Precious Metals Safe-Haven Characteristics
Precious metals demonstrated fundamental safe-haven investment characteristics during periods of economic uncertainty and currency volatility. Platinum group metals achieved remarkable price appreciation despite production constraints, with rhodium reaching $8,008/oz (+73.1% year-on-year).
This performance pattern reflects investor demand for precious metals as portfolio hedge instruments, particularly valuable during periods of geopolitical uncertainty and inflationary pressures affecting base metals markets.
Investment Strategy Implications and Risk Assessment
Portfolio Diversification Within Resource Exposure
South African mining sector exposure requires careful commodity-specific diversification to manage infrastructure risk, price volatility, and operational constraints. Precious metals provide currency hedge characteristics, whilst base metals offer industrial growth exposure with higher infrastructure dependency.
Investment Theme Analysis:
- Infrastructure modernisation themes: Transport and port capacity improvements supporting long-term export capability
- Technology adoption strategies: Operational efficiency improvements reducing cost pressures
- Renewable energy integration: Electricity cost hedging through solar and wind power adoption
Operational Efficiency and Cost Management
Mining operations implementing technology-driven efficiency improvements demonstrate superior resilience during infrastructure constraint periods. Automated systems, predictive maintenance, and energy management technologies provide competitive advantages.
Cost hedging mechanisms, particularly electricity price hedging through renewable energy integration and water management efficiency improvements, offer protection against utility cost inflation pressures.
Transport Infrastructure Investment Priorities
Public-private partnership opportunities in transport infrastructure present long-term investment themes supporting mining sector performance. Rail capacity improvements, port efficiency projects, and alternative transport route development address fundamental constraint factors.
State-owned enterprise performance, particularly Transnet's operational efficiency improvements, represents critical factors influencing sector-wide production capabilities and cost structures.
Regulatory Environment and Policy Framework Evolution
Mining Charter Compliance and Local Content Requirements
Government policy influences through Mining Charter compliance requirements create operational complexity and cost considerations affecting production planning. Local content procurement policies influence supply chain management and operational cost structures.
Environmental regulation implementation adds compliance costs whilst creating opportunities for companies implementing advanced environmental management systems and clean technology adoption.
Regional Development Programme Integration
Mining operations increasingly integrate with broader regional development programmes, creating community investment obligations and infrastructure development opportunities. These programmes can provide co-benefits through improved local infrastructure supporting mining operations.
Forward-Looking Performance Indicators and Monitoring Framework
Leading Economic Indicators for Mining Performance
Global Manufacturing PMI Trends: Manufacturing purchasing managers' indices from major economies provide early indicators of industrial metal demand patterns affecting South African exports.
Commodity Futures Curve Structures: Forward curve patterns in platinum, gold, coal, and iron ore markets indicate market expectations for price trajectories and investment planning horizons.
Exchange Rate Volatility Patterns: South African Rand volatility against major currencies influences export competitiveness and precious metals pricing dynamics.
Operational Performance Metrics
Transport Infrastructure Utilisation: Transnet freight rail capacity utilisation rates and equipment availability statistics quantify infrastructure constraint severity affecting production capabilities.
Energy Cost Trajectories: Eskom tariff implementation schedules and renewable energy adoption rates influence operational cost projections and margin sustainability.
Port Throughput Efficiency: Richards Bay Coal Terminal and Saldanha Bay capacity utilisation rates establish export bottleneck severity measurements.
Technology Adoption and Sustainability Metrics
Renewable Energy Integration Timelines: Mining operations implementing solar and wind power systems reduce electricity cost exposure whilst improving environmental compliance.
Automation Technology Deployment: Advanced mining technologies improving operational efficiency and safety performance create competitive advantages during constraint periods.
Water Management Efficiency: Water recycling and efficiency improvements reduce utility cost exposure and environmental impact simultaneously.
Long-Term Sector Evolution and Structural Transformation
South Africa's mining sector demonstrates how infrastructure investment needs, global economic integration, and sustainable operational model transitions converge to define industry evolution pathways. Understanding these interconnected forces provides essential context for evaluating both cyclical performance fluctuations and structural investment opportunities.
The South African mining production decline during 2025 reflects broader themes of infrastructure modernisation requirements, commodity market diversification benefits, and technology-driven efficiency improvements. These themes will likely characterise industry development over the coming decade.
According to recent analysis, transport infrastructure improvements, renewable energy adoption, and advanced mining technology implementation represent critical factors determining competitive positioning in global markets.
Disclaimer: This analysis is based on publicly available data and industry reports. Commodity prices, production figures, and economic projections are subject to significant volatility and uncertainty. Past performance does not guarantee future results. Investors should conduct thorough due diligence and consider their risk tolerance before making investment decisions in mining sector exposure.
Looking to Capitalise on Mining Sector Opportunities?
Discovery Alert's proprietary Discovery IQ model delivers real-time alerts on significant ASX mineral discoveries, instantly empowering subscribers to identify actionable opportunities ahead of the broader market. Begin your 30-day free trial today and secure your market-leading advantage in the dynamic resources sector.