
June 11, 2026
The World's Most Fragile Energy Corridor Is No Longer a Theoretical Risk
Every energy security textbook written in the past five decades has identified the Strait of Hormuz as the single most consequential maritime chokepoint on earth. For decades, that designation carried the implicit qualifier: theoretical. Planners modelled scenarios, insurers priced tail risks, and governments built strategic reserves against the possibility of a closure. In 2026, as the US escalates attacks on Iran, the theoretical became operational. The strait has been functionally disrupted for more than three months, and the cascading consequences for global energy markets are no longer projections — they are measurable, accelerating, and compounding.
Understanding what happens next requires moving beyond the daily news cycle and examining the deeper structural logic of the conflict, the physical geography that makes Hormuz irreplaceable, and the multi-front supply shock that is simultaneously squeezing energy markets from multiple directions.
When big ASX news breaks, our subscribers know first
Why Hormuz Cannot Simply Be Routed Around
The strait's navigability is deceptively constrained. The two-way traffic lanes through which commercial shipping must pass measure roughly 3.2 kilometres wide in each direction, threading between Iranian territorial waters to the north and Omani waters to the south. Under normal operating conditions, approximately 20 to 21 percent of all globally traded oil passes through this corridor daily — a volume that no existing infrastructure network can absorb through alternative routing at scale.
Saudi Arabia and the UAE each maintain pipeline systems designed to reduce their individual Hormuz dependency. Furthermore, crude oil price trends have long reflected the premium markets assign to this geographic vulnerability:
- Saudi Arabia's East-West pipeline connects the Abqaiq processing complex to the Red Sea terminal at Yanbu, with a nameplate capacity of 7 million barrels per day (b/d)
- The UAE's Abu Dhabi Crude Oil Pipeline (ADCOP) runs from Habshan inland to the port of Fujairah outside the strait, with a capacity of 1.7 million b/d
- Kuwait has no equivalent infrastructure — every barrel it produces must currently exit through Hormuz or not exit at all
The problem is not simply capacity. Both of these alternative systems have been targeted. Fujairah has been struck on at least five separate occasions between late February and early June 2026. The East-West pipeline was also targeted, temporarily reducing throughput by approximately 700,000 b/d. KPC's chief executive has noted publicly that a pipeline is only as secure as the export facility at its terminus — and that compression nodes along long-distance pipeline systems represent particularly high-consequence vulnerabilities, because compression equipment takes significantly longer to replace than pipeline sections themselves.
How the Escalation Cycle Unfolded: From Ceasefire to Renewed Strikes
To understand where the conflict stands today, it is worth reconstructing the escalation sequence with precision rather than treating current events as isolated incidents.
| Phase | Timeline | US Posture | Iranian Response |
|---|---|---|---|
| Initial High-Intensity Conflict | February–March 2026 | Broad strike campaign | Air defense degradation |
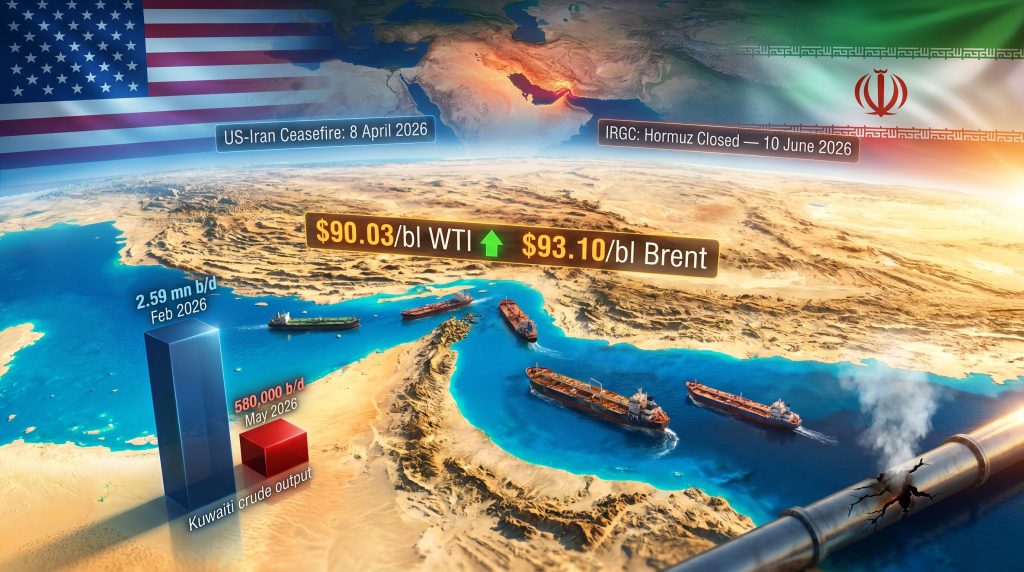
| Ceasefire Period | 8 April 2026 onward | Diplomatic engagement | Partial military rebuild |
| Low-Intensity Resumption | Late May–early June 2026 | Targeted infrastructure strikes | Drone/missile attacks on US bases |
| Current Escalation | 9–10 June 2026 | Multi-target strike waves | Hormuz closure declaration |
The immediate trigger for the June escalation was the downing of a US Army Apache helicopter patrolling near the Omani coast, which US forces attributed to Iranian fire. Iran's foreign ministry and the Islamic Revolutionary Guard Corps issued statements that appeared to deflect direct responsibility, with Iran's foreign minister characterising the incident as potentially attributable to human error or crossfire rather than deliberate targeting.
The US Central Command launched retaliatory strikes at 5:00 pm ET on 9 June, described as proportional self-defence measures. A second, broader strike wave commenced at 5:15 pm ET on 10 June, this time targeting multiple sites across Iran simultaneously. Prior to the second wave, US Defence Secretary Pete Hegseth made the unusual move of publicly pre-announcing that the response would be forceful and unambiguous — a departure from standard operational security practice that analysts interpreted as deliberate psychological signalling toward Tehran.
The Civilian Infrastructure Threshold
Perhaps the most strategically significant development surrounding the 10 June escalation was the public discussion of striking Iranian power plants and civilian bridges. This represents a qualitatively different category of target from military infrastructure and air defence systems. Historically, the deliberate targeting of civilian power infrastructure in conflict has triggered disproportionate international condemnation and, in several documented cases, has hardened rather than broken adversary resolve.
Strategic Warning: The explicit public consideration of strikes against Iranian civilian power and transport infrastructure signals a potential shift toward coercive punishment strategy. Historical precedent — from the Gulf War to Kosovo — suggests this approach carries substantial escalation risk and significant exposure under international humanitarian law.
The distinction matters for market participants: a conflict contained to military infrastructure follows relatively predictable escalation-deescalation patterns, while one that crosses into civilian punishment territory introduces fundamentally less predictable Iranian response behaviour. Consequently, the geopolitical landscape for metals and broader commodities is being reshaped in real time.
Oil Markets Are Pricing Risk, Not Yet Disruption
The immediate market reaction to the 10 June escalation was measurable but, in the context of the supply shock already underway, relatively contained:
- July NYMEX WTI rose $1.83/bl to reach $90.03/bl
- August ICE Brent climbed $1.65/bl to $93.10/bl
These moves reflect a risk premium repricing event rather than a new supply disruption being factored in. The market is essentially acknowledging elevated probability of further escalation without yet pricing a complete and indefinite Hormuz closure into forward curves. The distinction matters: if markets were fully pricing the physical supply shock already in train, price levels would be considerably higher.
The Supply Shock in Numbers
| Producer | Pre-Conflict Output (Feb 2026) | Estimated Output (May 2026) | Volume Removed |
|---|---|---|---|
| Kuwait | 2.59 mn b/d | 580,000 b/d | ~2.01 mn b/d |
| Regional aggregate | Multiple GCC producers | Partially rerouted | Ongoing disruption |
| East-West pipeline throughput | ~7 mn b/d capacity | Reduced by ~700,000 b/d (post-attack) | Temporary but significant |
Kuwait's production reduction alone — from 2.59 million b/d in February to approximately 580,000 b/d by May — represents a 78 percent contraction in output from a single producer. KPC's leadership has stated that the company methodically reduced production to levels sufficient only for domestic consumption inside Kuwait, because it had no means of exporting anything beyond its borders.
For historical context, the 1973 Arab Oil Embargo removed roughly 4.3 million b/d from global supply, as did the peak disruption of the 1990-91 Gulf War. The current Hormuz closure, now extending past the three-month mark and affecting multiple producers simultaneously, has been characterised as the largest recorded disruption to global oil supply in the modern era.
Is the Strait Actually Closed? The Competing Narratives Problem
Following the 10 June US strikes, Iran's military declared Hormuz closed to all navigation, with the announcement carried by Tasnim, the IRGC-affiliated news agency. Yet the picture on the water is considerably more ambiguous than either side's public statements suggest.
Ship-tracking data from Vortexa recorded 51 vessel crossings in the first nine days of June 2026, up from 26 in the same period in May — indicating that a partial traffic recovery was actually underway before the latest escalation. However, both figures remain well below the 68 crossings recorded in the corresponding period of April.
Both Washington and Tehran have simultaneously claimed to be facilitating or permitting vessel transit through Hormuz on their own respective terms. This competing narrative architecture creates a dangerous operational environment for commercial shipping: operators cannot rely on either party's assurances, and the consequences of navigating into a disputed zone are severe.
The most concrete illustration of this danger involves a recent incident in which an empty oil tanker had its 24 crew members evacuated after a US aircraft disabled the vessel. US Central Command stated the ship had failed to comply with directions from US forces. UK Maritime Trade Operations has logged a total of 54 incident reports involving vessels in and around the Mideast Gulf, Hormuz, and the Gulf of Oman since the conflict began on 28 February 2026.
Key Finding: As of June 2026, the IMO Secretary-General has explicitly advised the shipping industry against attempting Hormuz transits, stating that no commercial or operational consideration can justify exposing seafarers to the level of danger currently present in the strait. Safe passage, in the IMO's assessment, does not currently exist.
Kuwait's Pipeline Diplomacy and the Production Recovery Timeline
Kuwait's situation illustrates the limits of even ambitious contingency planning when a country has no pipeline infrastructure bypass. KPC is engaged in active discussions with Saudi Arabia and the UAE to explore whether their existing pipeline systems could be expanded to accommodate Kuwaiti crude volumes, but no specific projects or timelines have been publicly confirmed.
The more instructive analysis concerns what happens after a Hormuz reopening. Based on statements from KPC's leadership, a recovery scenario might unfold as follows:
- Week 1-3 post-reopening: Approximately 80 percent of shut-in Kuwaiti production could be restored within roughly three weeks, implying a return of around 1.6 million b/d and lifting total output to approximately 2.1 million b/d
- Months 1-4 post-reopening: The remaining 20 percent of shut-in production is more technically demanding, potentially requiring three to four additional months due to reservoir pressure management requirements
- Unexpected upside: KPC leadership has noted that some shut-in reservoirs may have actually benefited from the extended downtime, with reduced production pressure allowing underground reservoir pressure to recharge — a phenomenon sometimes observed in mature fields that have been produced aggressively for extended periods
This reservoir recharge dynamic is a relatively underappreciated aspect of prolonged production shutdowns. In conventional reservoir management, engineers typically seek to maintain pressure through water or gas injection; a natural recharge period, while difficult to quantify precisely, can in some cases improve subsequent recovery rates from affected zones.
The next major ASX story will hit our subscribers first
The Compounding LNG Crisis: Australia and Qatar
The Hormuz disruption does not exist in isolation. Asian energy importers are simultaneously navigating a tightening from multiple directions. In addition, LNG supply constraints in 2025 had already signalled vulnerability in the region's supply chains well before the current conflict intensified.
Japan's Inpex, operator of the 9.3 million tonne per year Ichthys LNG project near Darwin in Australia's Northern Territory, has applied to the Fair Work Commission to halt ongoing industrial action. Strikes began on 2 June 2026, escalating from four hours to eight hours of daily action, with cargo loading and unloading bans commencing 11 June. Traders have indicated that up to four LNG cargoes could be lost as a result, with replacement supply required in Asian markets.
The broader Asian LNG supply picture heading into summer demand season involves simultaneous tightening from three sources:
- Hormuz disruption keeping Qatari LNG supply largely offline
- Australian industrial action at Ichthys, one of the region's largest LNG facilities
- Eroded supply buffers that Asian importers would normally rely upon to manage demand variability
Spot LNG prices face meaningful upside pressure as these supply constraints compound. For Asian buyers accustomed to managing procurement through a combination of long-term contracts and spot market purchases, the simultaneous compression of multiple supply sources creates a qualitatively different procurement environment than any single-source disruption would produce.
Venezuela as Strategic Counter-Narrative: Scope and Limitations
The Trump administration has pointed to Venezuela's crude export performance as evidence of successful energy policy management amid the Iran conflict. Venezuela's exports reached approximately 1.25 million b/d in late May 2026 — the highest level since February 2019 — with senior US officials describing the result as a major foreign policy achievement. Trump has also publicly suggested that the combined energy resources of the US and Venezuela represent around 64 percent of global resources of their type.
The political context, however, complicates this narrative. Democratic lawmakers have renewed calls for free elections in Venezuela, noting that 473 political prisoners reportedly remain detained and that no electoral timeline has been publicly outlined by the current governing arrangement. The legitimacy questions surrounding Venezuela's governance structure remain live issues in Washington.
From a pure supply perspective, even at 1.1 million b/d average across May, Venezuelan production cannot meaningfully offset the scale of Hormuz-driven supply removal. With Kuwait alone having shed roughly 2 million b/d, and the aggregate regional disruption running well beyond that, Venezuela's incremental barrels represent a partial contribution rather than a structural solution.
Three Scenarios for the Path Forward
Scenario 1: Negotiated Pause
A back-channel diplomatic solution producing a ceasefire similar to the April agreement remains structurally possible. As recently as 8-9 June, Trump described negotiations as ongoing with potential results achievable within days. A face-saving formula for both parties could produce a rapid reduction in hostilities, enabling a partial Hormuz reopening and the production recovery sequence described above. However, the impact of oil price movements during any pause period will remain highly sensitive to diplomatic signals.
Scenario 2: Escalation to Civilian Infrastructure
US strikes on Iranian power generation or civilian transport infrastructure would likely trigger a qualitatively different scale of Iranian response. Iran has already escalated attacks on Saudi and Emirati pipeline and port infrastructure. Attacks on Yanbu or the East-West pipeline compression nodes would extend the supply shock duration significantly beyond current timelines.
Scenario 3: Regional Contagion
Iranian missile and drone attacks on US bases in Kuwait, Bahrain, and Jordan already represent a geographic expansion of the conflict zone beyond Iranian borders. The involvement of additional state or non-state actors would fundamentally alter the risk calculus for global energy markets and introduce supply disruption pathways that current market pricing does not adequately reflect. Furthermore, market volatility driven by tariffs has compounded the already fragile sentiment surrounding commodity-linked equities and futures.
Key Data Reference: US Escalation Against Iran and Energy Market Impact
| Metric | Value | Context |
|---|---|---|
| Kuwait crude output (Feb 2026) | 2.59 mn b/d | Pre-conflict baseline |
| Kuwait crude output (May 2026) | ~580,000 b/d | Approximately 78% reduction |
| Vessel crossings, first 9 days May 2026 | 26 | Low-intensity conflict phase |
| Vessel crossings, first 9 days June 2026 | 51 | Pre-latest escalation partial recovery |
| IMO-tracked Gulf incidents (to 8 June) | 54 | Since conflict began 28 Feb 2026 |
| Fujairah strike events | 5 | Late February to early June 2026 |
| East-West pipeline capacity loss (peak) | ~700,000 b/d | Following targeted attack |
| WTI price movement (10 June 2026) | +$1.83/bl to $90.03/bl | Post-escalation market reaction |
| Brent price movement (10 June 2026) | +$1.65/bl to $93.10/bl | Post-escalation market reaction |
| Venezuela crude exports (May 2026 avg) | ~1.1 mn b/d | Highest monthly average since Feb 2019 |
| Ichthys LNG capacity | 9.3 mn t/yr | Under active industrial strike action |
Disclaimer: This article contains forward-looking analysis and scenario modelling based on publicly available information as of 10 June 2026. Energy market conditions, conflict dynamics, and geopolitical developments are subject to rapid change. Nothing in this article constitutes investment advice. Readers should conduct their own due diligence before making any financial or commercial decisions based on the information presented here.
Want to Stay Ahead of the Commodity Disruptions Reshaping Global Markets?
When geopolitical shocks compress energy supply chains and redirect capital flows across commodity sectors, timing is everything — and Discovery Alert's proprietary Discovery IQ model delivers real-time alerts on significant ASX mineral discoveries, turning complex market shifts into actionable investment opportunities before the broader market catches on. Explore how historic mineral discoveries have generated substantial returns and begin your 14-day free trial today to position yourself ahead of the next major move.