
July 14, 2026
The Structural Forces Beneath the Surface of Precious Metals Markets
Commodity markets rarely move in straight lines, and precious metals are no exception. The long arc of gold and silver pricing is not simply a story of inflation hedging or crisis demand. It is a story of competing monetary architectures, physical market stress, and the gradual erosion of institutional frameworks that have governed global finance since the early 1970s. Understanding where gold and silver are headed requires understanding the structural machinery beneath the price chart, not just the headline numbers.
The analysis surrounding the Ed Steer gold and silver ready to surge thesis sits at the intersection of these deeper forces. Steer, a veteran precious metals market analyst and publisher of the widely followed Ed Steer's Gold and Silver Digest, has spent decades tracking positioning data, physical flows, and the behaviour of large commercial participants in the futures markets. His mid-2026 assessment draws on multiple reinforcing structural factors, each of which carries significant weight on its own. Together, they form what some market participants regard as the most compelling macro setup for precious metals in a generation.
When big ASX news breaks, our subscribers know first
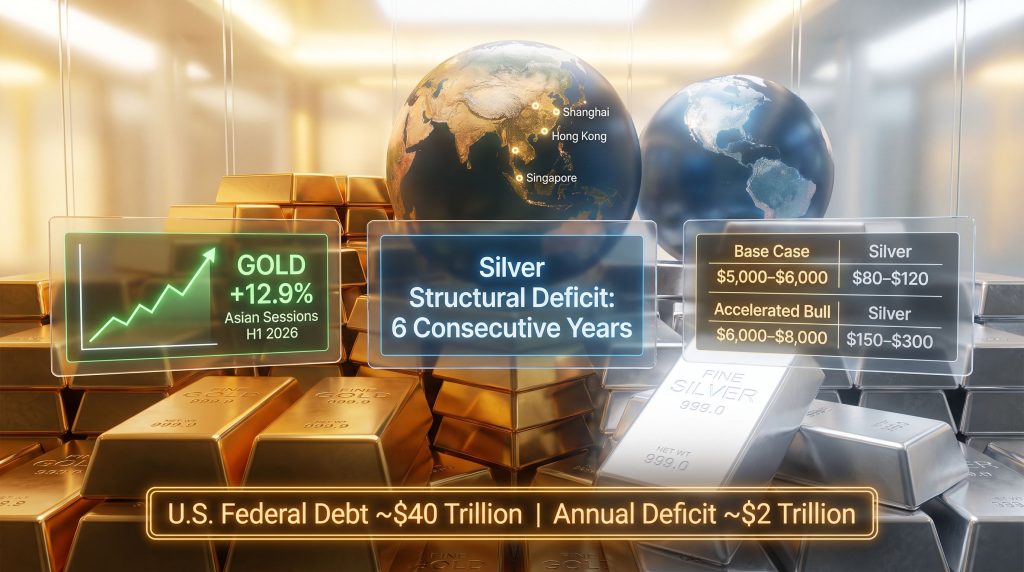
Silver's Six-Year Supply Deficit: A Crisis Building in Slow Motion
Most commodity markets self-correct over relatively short timeframes. When prices rise, producers respond by expanding output. When prices fall, marginal producers exit. Silver, however, has resisted this correction mechanism for an unusually extended period.
Annual global silver consumption has exceeded total mine production for six consecutive years. The numbers are not trivial. Global mine output runs in the range of 820 to 850 million ounces per year, while combined industrial, investment, and jewellery demand has consistently pushed total consumption above one billion ounces annually. The gap is being filled by above-ground inventory drawdowns, meaning the world is consuming stockpiles that took decades to accumulate. Furthermore, silver supply deficits of this magnitude have historically preceded significant price dislocations.
| Supply and Demand Metric | Estimated Annual Figures | Market Implication |
|---|---|---|
| Global silver mine production | ~820-850 million oz/year | Unable to meet total demand alone |
| Total annual consumption | ~1,000+ million oz/year | Persistent structural shortfall |
| Consecutive deficit years | 6 years | Accelerating inventory drawdown |
| LBMA freely available inventory | Far below assumed levels | Acute vulnerability to demand spikes |
What makes this situation particularly significant is the discovery, through real-world market stress, that freely available silver inventories within the London Bullion Market Association system were far smaller than most participants had assumed. When silver moved between London and New York vaulting systems earlier in 2026 to address localised shortages, the market got its first clear signal that the cushion of readily deployable metal is thinner than the headline vault numbers suggest.
This distinction between headline inventory and freely available inventory is critical. Not all metal sitting in LBMA-registered vaults is available for immediate delivery. Much of it is allocated to specific owners, earmarked for industrial contracts, or held by investors who have no intention of selling. The pool of truly tradeable physical silver is a fraction of the total, and that fraction appears to be shrinking.
Transporting metal between trading hubs provides temporary relief, not structural resolution. As long as consumption continues to exceed mine production by the margin it has maintained for six years, the underlying imbalance worsens with each passing quarter.
The Short Position Overhang: An Amplifier, Not a Cause
Overlaid on the physical supply deficit is a derivatives market dynamic that could dramatically accelerate any price move. Large commercial banks have historically held significant short positions in silver futures, a practice that has attracted regulatory scrutiny and considerable debate within the precious metals community.
The mechanics are straightforward. When short sellers need to close positions, they must buy futures contracts. In a thinly supplied physical market, forced short covering does not merely close positions; it competes directly with industrial buyers and investors for a finite pool of metal. The result can be a feedback loop where rising prices force more covering, which pushes prices higher, which triggers additional covering.
Historical precedent exists. The Hunt Brothers episode of 1979–1980 saw silver surge from roughly $6 per ounce to nearly $50 in a matter of months before regulatory intervention. The 2021 Reddit-driven silver squeeze, while ultimately contained, provided a modern illustration of how quickly physical premiums can decouple from paper market prices when retail demand floods into a constrained physical market.
What differentiates the current setup from those historical episodes is scale and duration. Six years of accumulated deficit cannot be unwound by a single demand event. The structural underpinning is far deeper.
The East-West Trading Divergence: Paper Markets vs. Physical Reality
One of the most analytically revealing data points to emerge from H1 2026 came from World Gold Council tracking of session-by-session gold performance. Gold gained approximately 12.9% during Asian trading sessions in the first six months of 2026. During North American trading hours over the same period, gold declined by more than 15%.
This divergence is not a 2026 anomaly. The pattern of gold outperforming during Asian hours and underperforming during London and New York sessions has persisted, to varying degrees, since COMEX gold futures commenced trading on January 2, 1975.
The explanation lies in the fundamental difference between how Eastern and Western markets interact with precious metals. The Shanghai Gold Exchange operates as a physical delivery market. Buyers in China, India, and across Southeast Asia are acquiring metal. The LBMA and COMEX markets, while critically important to global price formation, function primarily as futures and derivatives markets where the overwhelming majority of contracts are settled in cash rather than physical delivery.
When physical demand drives prices higher in Asia and derivatives activity suppresses prices in New York, the result is a persistent tension. That tension can only resolve through one of two mechanisms: physical supply catches up with demand, or paper markets are forced to reprice to match physical reality.
Could Shanghai Displace London and New York as the Primary Pricing Centre?
The gradual expansion of physical settlement infrastructure across Asia represents a longer-term challenge to the pricing authority of Western futures exchanges. Hong Kong and Singapore have both invested significantly in vaulting capacity and physical settlement mechanisms. China, India, and Russia collectively account for massive shares of both gold production and consumption.
The Shanghai Gold Exchange's physical settlement model gives it a structural advantage in a world where physical inventory constraints are becoming more visible. If London and New York were ever to exhaust their freely available physical inventories to a degree that impaired delivery capability, price discovery authority could migrate eastward by default rather than by design.
This is not imminent, however the directional trend is clear. Each year that Eastern physical markets deepen their infrastructure while Western paper markets face growing credibility questions about their physical backing moves the balance of pricing power incrementally toward Asia.
Sovereign Debt: The Macro Ceiling on Monetary Policy
The Federal Reserve's capacity to maintain genuinely restrictive monetary policy is increasingly constrained by a fiscal arithmetic that grows more challenging with each passing year. U.S. national debt stands at approximately $40 trillion, a figure that excludes the much larger unfunded liability obligations embedded in entitlement programmes. Annual federal deficits are running at approximately $2 trillion.
The mathematics create an uncomfortable dynamic. Higher interest rates increase the cost of servicing $40 trillion in debt. As servicing costs rise, the deficit widens further, requiring additional borrowing. This self-reinforcing loop places a practical ceiling on how restrictive monetary policy can realistically remain before fiscal pressure forces a policy reversal.
| Fiscal Metric | Current Estimate | Implication for Precious Metals |
|---|---|---|
| Total U.S. national debt | ~$40 trillion | Systemic constraint on monetary tightening |
| Annual federal deficit | ~$2 trillion | Continued currency debasement pressure |
| Realistic resolution pathways | Default or inflation | Both scenarios favour hard asset holding |
| Post-1971 monetary framework | No gold backing | Structural bias toward monetary expansion |
The abandonment of the gold standard in 1971 removed the external discipline that had historically constrained government spending. In the decades since, the expansion of credit and sovereign debt has accelerated in ways that would have been structurally impossible under a gold-backed system. Understanding gold in the monetary system helps explain why this shift has had such enduring consequences for precious metals pricing.
Alan Greenspan, who passed away in mid-2026, was notable for having written compellingly about the relationship between gold and economic freedom early in his career, before presiding over a Federal Reserve that pursued policies he had once critiqued.
Steer's view, shared by a growing number of macro analysts, is that governments facing this level of debt ultimately have only two options: default or inflate. Neither outcome is neutral for holders of paper currency. Both outcomes, historically, have been highly supportive of gold and silver prices.
Where Could Gold and Silver Prices Go From Here?
Any honest discussion of price targets for gold and silver must acknowledge the speculative nature of forward projections. Markets are complex adaptive systems, and confident point predictions should be treated with appropriate scepticism. That said, scenario modelling based on structural inputs provides a useful framework for thinking about the range of outcomes.
| Scenario | Gold Price Target | Silver Price Target | Primary Trigger |
|---|---|---|---|
| Base Case (Gradual Recovery) | $5,000-$6,000 | $80-$120 | Steady short covering, physical demand |
| Accelerated Bull Case | $6,000-$8,000 | $150-$300 | Short squeeze combined with Eastern demand surge |
| Structural Re-pricing Event | $8,000-$10,000+ | $300-$500+ | Physical inventory exhaustion, dollar confidence crisis |
Disclaimer: These scenarios represent analytical projections based on current structural conditions and should not be interpreted as financial advice or guaranteed outcomes. All commodity markets carry substantial risk of loss.
Silver's potential upside relative to gold deserves particular attention. Conducting a thorough gold-silver ratio analysis reveals that the ratio, which measures how many ounces of silver are required to purchase one ounce of gold, remains elevated by historical standards. Historically, the ratio has averaged in the range of 15:1 to 20:1, reflecting the natural geological occurrence ratio. Current readings well above that range imply either that gold is expensive relative to silver or that silver is significantly undervalued relative to gold.
Silver's dual role as both a monetary metal and an industrial input adds a demand floor that gold does not possess. Solar panel manufacturing, electric vehicle production, and advanced electronics all consume silver in quantities that grow with technological adoption. This industrial demand is not discretionary in the way investment demand is. Manufacturers need silver to build products, creating a baseline consumption level that persists regardless of investor sentiment.
What a Discontinuous Price Event Actually Looks Like
The term discontinuous price event describes a specific market failure mode. It occurs when the gap between paper market pricing and physical market reality becomes so large that it cannot be bridged gradually. Instead, price discovery jumps to a new equilibrium in a compressed timeframe, bypassing the orderly price discovery process that normally governs markets.
The conditions for such an event in silver are more advanced than at any previous point in the current cycle:
- Six years of inventory drawdown has thinned the physical buffer
- Short positions in futures markets represent a potential source of forced buying
- Industrial demand is structurally non-discretionary and growing
- Eastern investment demand is adding to an already constrained supply picture
- The gap between paper market pricing and physical market premiums has widened during previous stress episodes
None of this guarantees a discontinuous event will occur. However, the structural architecture for one is more developed than at any point since the Hunt Brothers episode.
Investing Through Volatility: A Framework for Positioning in Precious Metals
Steer's own approach to precious metals investing reflects a long-term conviction that periodic price weakness is a feature of hard asset markets rather than evidence of structural failure. He purchased silver at approximately $5 Canadian per ounce in the late 1990s when gold was trading near $250 per ounce. The subsequent multi-decade appreciation, despite multiple severe corrections, validated the long-term thesis even if the short-term path was volatile.
His mining equity investments, including positions in companies like First Majestic Silver and Wheaton Precious Metals, illustrate the leverage that equity exposure can provide relative to direct bullion holding. Mining equities typically offer two to four times leverage to the underlying metal price in sustained bull markets, though this leverage works in both directions during corrections.
| Investment Vehicle | Price Leverage | Liquidity | Risk Profile | Key Consideration |
|---|---|---|---|---|
| Physical bullion | 1:1 direct | Lower | Lower | Storage and insurance required |
| Senior mining equities | 2x-4x typical | High | Medium | Operational and geopolitical exposure |
| Streaming and royalty companies | 1.5x-3x typical | High | Medium-Low | Diversified exposure, lower capital cost risk |
| Junior exploration stocks | 5x-10x+ potential | Low | High | Binary outcomes, high reward but high risk |
For investors focused purely on physical metal, product selection matters more than many retail buyers appreciate. Sovereign mint products, those issued by the Royal Canadian Mint, the Perth Mint, and the U.S. Mint, command the highest secondary market liquidity and the most reliable recognition among dealers globally.
From a pure cost-per-ounce perspective, larger format bars typically carry lower premiums over spot price than one-ounce coins, making them more efficient for investors primarily focused on maximising silver content per dollar spent. Numismatic and collectible products carry premiums that may or may not be recoverable at resale and are generally not recommended for investors whose primary objective is precious metals exposure rather than coin collecting.
In addition, the role of central banks and precious metals accumulation strategies is increasingly relevant to how institutional demand shapes both the gold and silver markets over the medium term.
The next major ASX story will hit our subscribers first
Frequently Asked Questions: The Gold and Silver Surge Thesis
Why are analysts like Ed Steer expecting gold and silver to surge in 2026?
The convergence of six consecutive years of silver supply deficits, approximately $40 trillion in U.S. sovereign debt, growing Eastern physical demand, and the structural erosion of Western paper market pricing authority creates conditions that have historically preceded significant precious metals repricing. Ed Steer gold and silver ready to surge commentary has highlighted precisely this combination of factors as the key catalyst for what he expects to be a major move.
What is a discontinuous price event in the context of silver?
It refers to a sudden, non-linear price spike that occurs when physical inventory levels fall below the threshold needed to satisfy delivery obligations, forcing the market to discover a new, substantially higher equilibrium price in a compressed timeframe.
Why has gold consistently gained during Asian trading sessions while declining during North American hours in 2026?
The divergence reflects the structural difference between Eastern physical markets, where buyers are acquiring real metal, and Western futures markets, where cash settlement dominates and short positioning influences near-term price direction.
Does government debt genuinely affect gold and silver prices?
Historically, periods of severe sovereign debt stress have been followed by either default or inflationary resolution. Both outcomes tend to support hard asset prices, as they erode the real value of paper currency holdings.
Is silver likely to outperform gold in the next major rally?
Silver has historically outperformed gold in the later stages of precious metals bull markets due to its smaller market size, elevated short positioning, growing industrial demand, and the potential for short-covering dynamics to compress significant price moves into very short timeframes. Consequently, many analysts view silver as offering asymmetric upside relative to gold.
When might the next major move in precious metals begin?
Mid-2026, specifically July through August, has been identified as a potential inflection window based on commercial short covering patterns and continued physical demand from Eastern markets. For further context, Investing News Network's coverage of Steer's silver market forecast provides additional detail on his timing thesis, though no prediction of this nature carries certainty.
Key Structural Takeaways for Precious Metals Investors
-
Silver has recorded six consecutive years of structural supply deficit, with annual consumption consistently exceeding global mine production by a meaningful margin
-
Gold gained 12.9% during Asian trading sessions in H1 2026 while declining more than 15% during North American sessions, a divergence that reflects a structural contest between physical and paper market pricing
-
U.S. federal debt of approximately $40 trillion and annual deficits near $2 trillion create fiscal conditions that have historically been resolved through inflation, favouring hard asset positioning
-
The Shanghai Gold Exchange's physical settlement model positions it as a potential long-term successor to Western futures exchanges as the primary global gold pricing centre
-
Gold has appreciated from approximately $250 per ounce in the late 1990s to above $5,000 per ounce by mid-2026, demonstrating the long-term reward available to patient holders despite periodic price management episodes
-
The gold-to-silver ratio remains elevated relative to long-run historical averages, suggesting silver carries disproportionate upside potential relative to gold in the next significant advance
-
Commercial short positions in silver futures represent a structural source of potential forced buying that could compress a major price move into days or weeks rather than months
Want to Identify the Next Major Mineral Discovery Before the Broader Market Does?
Discovery Alert's proprietary Discovery IQ model delivers real-time alerts on significant ASX mineral discoveries, turning complex data across more than 30 commodities into clear, actionable insights for both short-term traders and long-term investors — explore historic discoveries and the returns they generated, then begin your 14-day free trial at Discovery Alert to position yourself ahead of the market.