
July 8, 2026
The Hidden Complexity Behind Summer Crude Stockpile Increases
Energy markets operate on a deceptively simple assumption: when inventories rise, prices should fall, and when they fall, prices should rise. Reality is rarely so cooperative. During periods of acute geopolitical disruption, the relationship between weekly stockpile data and crude price direction becomes deeply asymmetric, forcing traders, analysts, and long-term investors to work far harder to extract meaning from what looks, on the surface, like a straightforward data point.
Understanding why EIA crude oil inventories in US see rare build conditions during summer months requires peeling back several layers of market mechanics, seasonal dynamics, and geopolitical supply-chain distortions that rarely receive adequate attention in standard market coverage. Furthermore, crude oil price trends in recent years have only added to this complexity.
When big ASX news breaks, our subscribers know first
The EIA Weekly Petroleum Status Report: More Than a Headline Number
Every Wednesday, the U.S. Energy Information Administration publishes its Weekly Petroleum Status Report, a comprehensive snapshot of crude oil and refined product stockpile levels across commercial storage facilities, pipelines, and refinery tank farms throughout the country. For energy traders, this release functions as one of the most market-sensitive data events of the week, capable of moving futures prices within seconds of publication.
What the report actually measures is critical to understanding its limitations. The EIA collects mandatory data from a broad universe of operators including refiners, pipeline companies, and storage terminal operators. Because reporting is mandatory and covers a wide sample base, the EIA figures are generally considered the more authoritative of the two major weekly inventory releases.
Commercial Stockpiles vs. the Strategic Petroleum Reserve
A distinction frequently blurred in market commentary involves conflating commercial crude inventories with Strategic Petroleum Reserve holdings. These are fundamentally different categories:
-
Commercial inventories are privately held by refiners, traders, and pipeline operators for operational and speculative purposes, subject to routine market-driven fluctuations throughout the year.
-
The Strategic Petroleum Reserve (SPR) is a government-controlled emergency stockpile stored in underground salt caverns along the U.S. Gulf Coast, managed separately and not subject to the same market forces that drive weekly commercial inventory movements.
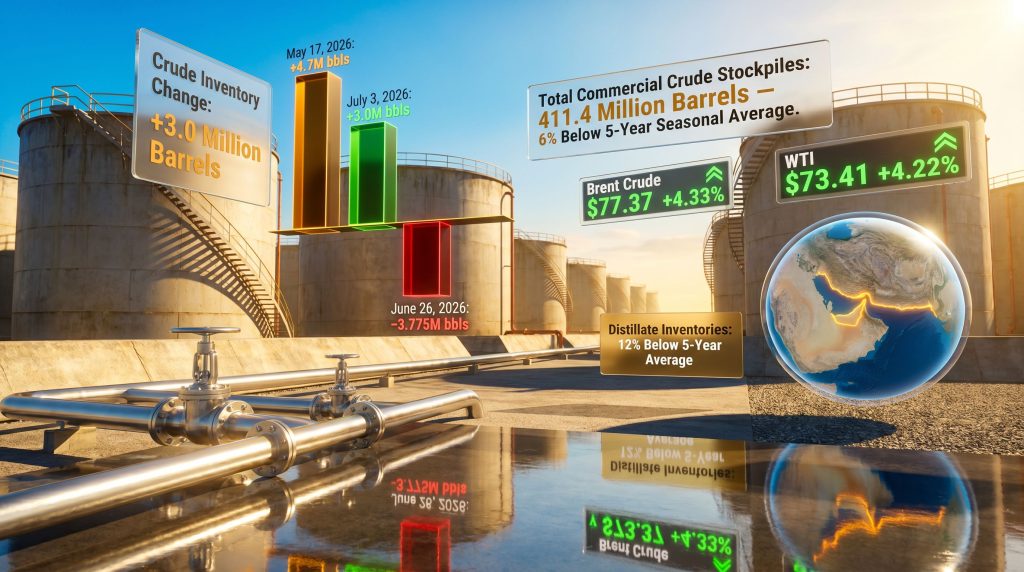
The five-year seasonal average, which the EIA uses as its structural benchmark, applies to commercial stockpiles only. For the week ending July 3, 2026, commercial crude stockpiles stood at 411.4 million barrels, a level sitting 6% below the five-year seasonal average despite the surprise weekly increase.
The API vs. EIA Divergence: A Warning Signal Often Missed
The American Petroleum Institute releases its own weekly petroleum survey approximately 24 hours before the official EIA report. This API estimate is based on voluntary reporting from a subset of industry participants and serves as a leading indicator, though its methodology differs meaningfully from the EIA's approach.
The week ending July 3, 2026 produced a striking directional divergence between the two:
| Metric | API Estimate | EIA Official Report |
|---|---|---|
| Crude Inventory Change | -399,000 barrels (draw) | +3.0 million barrels (build) |
| Direction | Draw | Build |
| Magnitude Gap | Modest draw | ~3.4 million barrels wider |
| Market Surprise Factor | Low | High |
When the two reports point in opposite directions, it typically reflects one of several conditions: marginal inventory movements that sit near the boundary of statistical significance, timing differences in cargo arrivals that fall either side of the survey cut-off, or, in more complex environments like mid-2026, import volumes distorted by geopolitical events affecting tanker delivery schedules. A directional disagreement of this scale amplified market uncertainty considerably on the morning of the EIA release.
Decoding the Signal: What a Summer Inventory Build Actually Means
The Demand-Supply Interpretation Matrix
A crude inventory build does not carry a single fixed interpretation. Depending on the broader market context, the same data point can be read through three distinct analytical lenses:
-
Bearish interpretation: Stockpiles are accumulating because refinery throughput is insufficient to absorb incoming crude supply, potentially signalling demand softness or refinery operational issues that are suppressing crude processing rates.
-
Bullish counter-interpretation: Builds occurring during active supply disruption events can reflect deliberate pre-positioning by refiners and traders who are front-loading crude purchases ahead of anticipated tightening. In this scenario, the build is a consequence of supply risk perception, not evidence of weak demand.
-
Neutral structural read: Seasonal refinery maintenance turnarounds periodically reduce crude processing capacity during what would otherwise be peak demand periods, generating paper builds unrelated to underlying consumption trends.
Why a Below-Average Stockpile Level Changes Everything
The figure that receives insufficient attention in most inventory coverage is the structural context of the build itself. Despite the 3.0 million barrel increase, total commercial crude stockpiles at 411.4 million barrels remain 6% below the five-year seasonal average for early July. This means the U.S. crude market entered the reporting week in a structurally tighter position than historical norms would suggest.
"A single-week inventory build occurring within a broader context of below-average stockpile positioning does not reverse the structural supply tightness. It introduces a one-week deviation within a longer-run trend that remains constructive for prices."
This is why seasoned energy analysts consistently caution against over-indexing on individual weekly figures. A four-week rolling average of total products supplied provides a far more reliable signal of underlying demand conditions than any single reporting period.
The Geopolitical Overlay: Hormuz Disruption and Inventory Distortions
How Tanker Route Disruptions Distort U.S. Import Data
The Strait of Hormuz functions as the world's single most critical oil transit chokepoint. Approximately 20 to 21 percent of all global crude oil and refined product trade passes through this narrow waterway daily, according to EIA estimates. Any material disruption to tanker traffic through Hormuz does not appear instantaneously in U.S. commercial inventory data.
The lag between a geopolitical event and its measurable impact on U.S. stockpile figures typically ranges from two to six weeks, depending on the origin port and voyage routing. This lag dynamic creates a particularly treacherous analytical environment during active supply disruption events.
When tankers execute U-turns, reroute around alternative passages, or face delays in cargo loading, the short-term effect on U.S. import volumes can actually produce higher inventory readings as previously en-route cargoes arrive while new flows slow. Simultaneously, import data for subsequent weeks will reflect reduced inbound volumes, generating the draws that logically follow the disruption. Consequently, this oil geopolitics analysis dimension is essential context for understanding any inventory release during periods of regional tension.
The Iran Escalation Variable: Market Pricing Before the Data Landed
By the morning of the EIA release on July 8, 2026, crude futures had already moved sharply higher in response to the announcement that the U.S.-Iran ceasefire had collapsed, following Iranian attacks on commercial tanker vessels in the Strait of Hormuz:
-
Brent crude was trading at $77.37 per barrel, up $3.21 (+4.33%) on the day and more than $5 per barrel above the same time the previous week.
-
WTI crude was trading at $73.41 per barrel, up $2.97 (+4.22%) on the morning session.
"When geopolitical risk premiums are already embedded in futures prices prior to an inventory release, bearish data such as a surprise crude build tends to produce a muted or asymmetric price response. The market had partially pre-priced supply disruption risk, creating a dampening effect on the downside reaction to what would otherwise be a more bearish signal."
This is a crucial concept in energy market psychology that consistently catches less experienced market participants off-guard. Pre-positioned geopolitical premiums effectively raise the bar for bearish inventory data to produce meaningful price declines. In addition, WTI and Brent futures behaviour during these events underscores how geopolitical overlays reshape the typical inventory-price relationship.
A Deeper Look at the Full EIA Petroleum Status Report
Gasoline Inventories: Reading the Consumer Demand Signal
While the crude build dominated early market commentary, the gasoline inventory data told a meaningfully different story. Gasoline stockpiles declined by 1.9 million barrels during the reporting week, reversing the prior week's 2.3 million barrel build. Average daily gasoline production decreased to 9.7 million barrels per day.
Over the most recent four-week measurement period, gasoline demand held at 9.0 million barrels per day, suggesting consumer fuel consumption remains relatively resilient heading into the peak summer driving season. The combination of declining production and a meaningful stockpile draw supports a constructive near-term view on refined product prices at the pump.
Distillate Inventories: The Industrial Economy's Barometer
Middle distillate stockpiles, which include diesel fuel and heating oil and serve as a proxy for industrial and freight sector activity, fell by a notably large 5.0 million barrels during the reporting week. Production of distillates averaged 5.2 million barrels per day over the period.
The structural significance of this draw is difficult to overstate. Distillate inventories now sit 12% below the five-year seasonal average, a far tighter position than the crude market itself and one that carries important implications for industrial price dynamics:
-
A 12% deficit relative to the seasonal average represents a meaningful structural supply shortfall that cannot be resolved quickly through incremental production increases.
-
Distillate tightness often precedes broader economic strain in freight-dependent industries, as diesel price increases flow through directly to transport and logistics costs.
-
The combination of declining distillate production and an accelerating draw suggests refinery output mix may be shifting toward gasoline production in response to summer demand signals, at the expense of middle distillate yields.
Total Products Supplied: The Broadest U.S. Demand Lens
| Demand Metric | Most Recent 4-Week Average | Year-Over-Year Change |
|---|---|---|
| Total Products Supplied | 20.6 million bbl/day | +0.3% |
| Gasoline Demand | 9.0 million bbl/day | Not specified |
| Distillate Demand | 3.8 million bbl/day | -0.9% |
The marginal year-over-year increase in total products supplied of +0.3% alongside a decline in distillate demand of -0.9% points toward a bifurcated demand environment. Consumer fuel consumption remains broadly stable, while industrial and freight-related activity appears to be softening at the margin. This split is consistent with broader macroeconomic signals suggesting resilient household spending but emerging softness in manufacturing and goods-movement activity.
Historical Context: Why Mid-Summer Inventory Builds Are Statistically Uncommon
Seasonal inventory patterns in the U.S. crude market are well established. Between May and August each year, refinery utilisation rates typically rise to meet peak summer gasoline demand, drawing down crude stockpiles at a predictable pace. A build of 3.0 million barrels or more during this window is a genuine statistical outlier relative to historical norms.
The July 3 build did not occur in isolation. Two significant inventory accumulation events occurred within the same quarter of 2026:
| Event | Week Ending | Inventory Change | Prior Analyst Forecast | Stockpile Level |
|---|---|---|---|---|
| May 2026 Build | May 17, 2026 | +4.7 million barrels | ~-600,000 barrels (draw) | Near 2-year high |
| June 2026 Draw | June 26, 2026 | -3.775 million barrels | Larger draw expected | 408.3 million barrels |
| July 2026 Build | July 3, 2026 | +3.0 million barrels | Draw expected | 411.4 million barrels |
The May 2026 build of 4.7 million barrels, the largest single-week accumulation in nearly two years, had already surprised analysts who had forecast a draw of approximately 600,000 barrels. When two builds of this magnitude occur within a single summer quarter, the cumulative effect on seasonal inventory trajectory becomes a significant variable in OPEC demand forecasts and forward price curve positioning.
The next major ASX story will hit our subscribers first
Price Forecast Implications: Weighing the Bearish and Bullish Cases
The Bearish Argument
Those interpreting the July build as a bearish signal point to the possibility that elevated U.S. imports, potentially front-loaded ahead of anticipated Hormuz supply tightening, produced a one-week stockpile anomaly that does not reflect genuine demand strength. If refinery throughput rates remain suppressed by operational or margin-related factors, subsequent weeks could produce additional builds, gradually eroding the below-average inventory position that currently supports prices.
The Bullish Counter-Case
The structural arguments supporting sustained price elevation are, however, considerably more numerous. Furthermore, the trade war impact on oil markets has introduced additional supply and demand uncertainty that reinforces the bullish case:
-
Distillate inventories at 12% below the five-year average provide a structural floor for refined product prices that crude market softness alone cannot easily overcome.
-
The Hormuz disruption premium embedded in futures prices will not dissipate based on a single week of inventory data. Tanker U-turns, cargo delays, and rerouting costs represent real physical supply friction that takes weeks to resolve.
-
OPEC+ production posture and member compliance rates remain a critical wild card. Any reduction in member output above or below agreed levels significantly alters the supply-demand balance.
-
The five-year average deficit of 6% across commercial crude stocks means the market would need several consecutive weeks of builds to shift from structurally tight to structurally balanced.
"Does a surprise EIA crude inventory build automatically push oil prices lower? Not necessarily. When geopolitical risk premiums are already priced into futures, when distillate markets are structurally tight, and when the overall inventory level remains below seasonal norms, the directional signal from a single-week crude build is significantly diminished. Context overrides the headline number in complex supply environments."
Key Metrics Summary: EIA Report Week Ending July 3, 2026
| Indicator | Value | Context |
|---|---|---|
| Crude Inventory Change | +3.0 million barrels | Surprise build vs. expected draw |
| Total Commercial Crude Stockpiles | 411.4 million barrels | 6% below 5-year seasonal average |
| Gasoline Inventory Change | -1.9 million barrels | Reversed prior week's +2.3M build |
| Gasoline Production (avg. daily) | 9.7 million bbl/day | Decreased week-over-week |
| Distillate Inventory Change | -5.0 million barrels | Significant draw |
| Distillate Production (avg. daily) | 5.2 million bbl/day | Decreased week-over-week |
| Distillate vs. 5-Year Average | 12% below average | Structurally tight |
| Total Products Supplied (4-wk avg.) | 20.6 million bbl/day | +0.3% year-over-year |
| Distillate Demand (4-wk avg.) | 3.8 million bbl/day | -0.9% year-over-year |
| Brent Crude (morning of release) | $77.37/barrel | +4.33% on the day |
| WTI Crude (morning of release) | $73.41/barrel | +4.22% on the day |
FAQ: EIA Crude Oil Inventories Explained
What is the EIA Weekly Petroleum Status Report?
The U.S. Energy Information Administration releases its Weekly Petroleum Status Report every Wednesday, providing official data on crude oil and refined product stockpile levels across the United States. It is among the most closely watched data releases in global energy markets and is sourced from mandatory reporting by refiners, pipeline operators, and storage terminal companies.
What makes a mid-summer crude build statistically uncommon?
U.S. crude inventories typically draw down between May and August as refineries operate at elevated utilisation rates to meet peak summer gasoline demand. A build of 3.0 million barrels or more occurring during this seasonal window represents a meaningful deviation from historical patterns and warrants careful contextual analysis rather than reflexive bearish interpretation.
How does the five-year average benchmark function?
The EIA compares current inventory levels to a rolling five-year average for the equivalent week of the year. This seasonal adjustment removes predictable demand cycle effects, allowing analysts to assess whether stockpiles are structurally tight or abundant relative to historical norms, independent of short-term weekly variations.
Why do API and EIA figures sometimes diverge directionally?
The API survey draws on voluntary reporting from a subset of industry participants and is released 24 hours ahead of the EIA. Because the API uses a smaller and different sample universe, methodological differences and reporting timing variations can produce directional disagreements, particularly when inventory movements are marginal or when geopolitical disruptions are affecting import timing and cargo arrival schedules. For a broader view, Reuters' energy coverage provides useful historical comparisons of these divergences.
What is the difference between commercial crude inventories and the Strategic Petroleum Reserve?
Commercial crude inventories are privately held by market participants for operational and trading purposes, subject to continuous market-driven fluctuations. The Strategic Petroleum Reserve is a federally managed emergency stockpile held in salt cavern formations along the Gulf Coast, maintained separately from commercial stocks and released only under specific emergency conditions or policy decisions. EIA crude oil inventory data can be tracked in real time to monitor how both categories evolve over time.
This article is intended for informational purposes only and does not constitute financial or investment advice. Oil market forecasts, inventory interpretations, and price projections involve inherent uncertainty. Readers should conduct their own due diligence and consult qualified financial professionals before making investment decisions. Official EIA data is published at eia.gov.
Want to Stay Ahead of the Next Major Resource Discovery?
While energy market complexity rewards those who act on real-time intelligence, Discovery Alert's proprietary Discovery IQ model delivers instant notifications on significant ASX mineral discoveries — transforming complex data into actionable opportunities for both traders and long-term investors. Explore historic examples of exceptional mineral discovery returns or start your 14-day free trial today to position yourself ahead of the broader market.