August 12, 2026
When Inventory Data and Price Signals Stop Telling the Same Story
Oil markets have always rewarded those who understand the difference between what the data says and what the market hears. Weekly petroleum inventory figures are among the most closely watched data points in global commodities, yet the relationship between a storage build and a price move is rarely as straightforward as textbook economics would suggest. The current environment, where EIA sees massive uptick in US crude oil inventories against a backdrop of structurally elevated geopolitical risk, is a case study in exactly that complexity.
Understanding why a near-record weekly build failed to send prices sharply lower requires looking beyond the headline barrel count and into the layered mechanics of how traders, refiners, and global supply chains actually process this information in real time. Furthermore, the crude oil market dynamics at play in 2025 add additional layers of complexity to any straightforward interpretation.
When big ASX news breaks, our subscribers know first
What the EIA Weekly Petroleum Status Report Actually Measures
The EIA's Weekly Petroleum Status Report is the most comprehensive short-interval snapshot of U.S. oil market conditions available to market participants. Published every Wednesday morning, it aggregates data from mandatory surveys covering commercial crude stockpiles, refinery utilisation rates, product-level inventory movements, and import and export flows across the country's major supply regions.
This distinguishes it meaningfully from the American Petroleum Institute's preliminary estimate, which is released approximately 24 hours earlier and draws on voluntary industry submissions rather than the EIA's broader mandatory survey base. While the API report functions as a useful directional signal for traders positioning ahead of Wednesday, its methodology introduces greater variability in magnitude relative to the official figures.
The Role of Cushing, Oklahoma
One aspect of the weekly report that receives insufficient attention from casual observers is the outsized influence of Cushing, Oklahoma on how inventory numbers translate into futures pricing. Cushing is the designated physical delivery point for West Texas Intermediate crude contracts. When inventories at Cushing build meaningfully, it tightens the physical settlement mechanics of WTI contracts and can create localised price pressure independent of the national commercial stockpile figure. Traders monitoring the EIA release are therefore watching both the national aggregate and the Cushing-specific data simultaneously.
Breaking Down the August 7 EIA Inventory Data
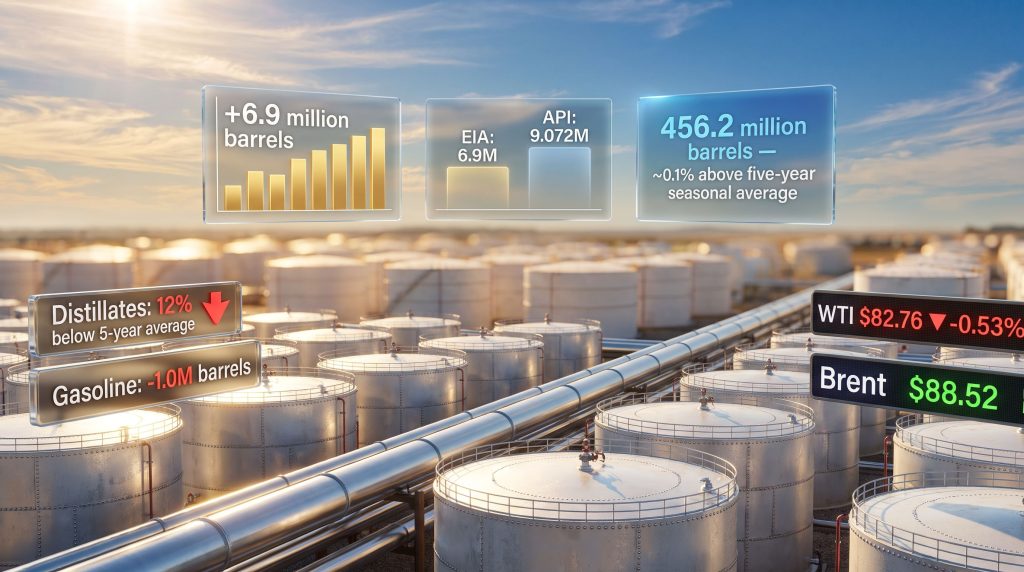
The most recent EIA data, covering the week ending August 7, revealed a build of 17.4 million barrels, pushing total commercial crude stockpiles to 424.4 million barrels. This positions inventories at approximately 2% below the five-year seasonal average for this time of year, a notable narrowing of the deficit that had characterised much of the preceding months.
The API's preliminary estimate, released the prior day, had pointed to a build of 9.072 million barrels, directionally aligned with the EIA outcome but diverging by roughly 8.3 million barrels in magnitude — an unusually wide gap that itself generated intraday positioning volatility before the official data confirmed the larger figure.
| Metric | Reported Figure | Context |
|---|---|---|
| Weekly crude inventory build (EIA) | +17.4 million barrels | Among the largest single-week builds on record |
| Total commercial crude stockpiles | 424.4 million barrels | ~2% below the five-year seasonal average |
| API preliminary estimate (prior day) | +9.072 million barrels | Directionally aligned but diverged materially in magnitude |
| Gasoline inventory change | -1.0 million barrels | Continued drawdown after -1.6M the prior week |
| Distillate inventory change | -100,000 barrels | Distillates now ~12% below five-year average |
How This Build Fits Into the Broader Trajectory
The weekly inventory path over the past several months has been anything but linear. A review of key data points illustrates just how volatile the swing has been:
- Late May: An 8.0 million-barrel draw suggested tightening supply conditions and supported bullish positioning
- Mid-June: A 17.2 million-barrel single-week plunge represented one of the steepest declines in recent memory
- Mid-July (July 17): A 2.0 million-barrel build exceeded analyst forecasts for a draw, catching the market off-guard
- Late July (July 31): A further 2.5 million-barrel build to 407.0 million barrels, driven by rising imports and moderating refinery throughput
- Week ending August 7: The 17.4 million-barrel surge that returned inventories close to the five-year average
Key Insight: This oscillating pattern reflects genuine uncertainty in both supply delivery timing and demand absorption rates. Markets that attempt to extrapolate a straight-line trend from any single week's data risk significant mispricing.
Supply and Demand Mechanics Behind the Storage Surge
Supply-Side Factors
Several converging forces on the supply side contributed to the August build. Rising crude import volumes arriving during the reporting period added barrels faster than the refinery system could absorb them. Domestic production levels have held near multi-year highs, maintaining a steady flow of new crude into the commercial storage system even as export demand fluctuates week to week.
Refinery throughput dynamics also played a role. When refinery utilisation rates soften — whether from scheduled seasonal maintenance cycles, unplanned outages, or margin compression driven by the spread between crude input costs and refined product values — crude accumulates in storage rather than being converted into gasoline, diesel, and other products.
Demand-Side Signals
The demand picture is more nuanced than the headline crude build implies. Total products supplied, the EIA's primary proxy for end-use consumption across the economy, averaged 20.7 million barrels per day over the most recent four-week window. This represents a 2.1% year-over-year decline, suggesting that aggregate fuel consumption has softened relative to the prior year's pace.
Breaking this down by product reveals important divergences:
- Gasoline demand averaged 9.0 million barrels per day over the four-week period, reflecting summer driving season consumption that remains below some seasonal expectations
- Distillate demand averaged 3.7 million barrels per day, up 1.9% year-over-year, a positive signal for industrial activity, freight movement, and agricultural sector fuel consumption
- Average daily gasoline production decreased to 9.6 million barrels, tightening the gasoline supply picture even as crude builds in storage
Why Crude Futures Didn't Collapse on Bearish Inventory Data
The Price Reaction Explained
At the time of the EIA release, Brent crude was trading at $88.52 per barrel, down modestly by $0.39 (-0.44%) on the day but approximately $9 per barrel higher than the same point the prior week. WTI sat at $82.76 per barrel, declining by just $0.44 (-0.53%) intraday while remaining roughly $7.50 per barrel above its level from seven days earlier.
The failure of a historically large inventory build to generate sustained downward pressure on prices reflects a fundamental feature of how energy futures markets operate under elevated geopolitical risk. In addition, the prevailing crude oil price trends heading into this data release had already embedded significant forward risk into both benchmarks.
Analytical Note: When a large geopolitical risk premium is embedded in futures pricing, bearish domestic inventory prints often produce only muted or temporary price dips. The market is effectively discounting today's storage data in favour of a forward scenario where physical supply availability is constrained by factors beyond U.S. borders.
Geopolitical Overlays Compressing the Price Response
The broader geopolitical oil price factors currently in play are compressing the price response to what would otherwise be decisively bearish inventory data. Multiple simultaneous geopolitical disruptions are currently elevating the risk premium baked into both Brent and WTI pricing:
- Strait of Hormuz constraints: Iran-related shipping restrictions have materially reduced tanker traffic through one of the world's most critical oil transit chokepoints. The Hormuz Strait typically handles roughly 20% of global oil trade, and sustained disruption creates a forward supply risk that markets price in aggressively
- Russian export volumes: Russian crude exports have declined to their lowest levels since May, removing additional barrels from global supply and supporting a tighter-than-headline international balance
- OPEC production discipline: OPEC market influence continues to shape supply ceilings, with production trailing quota targets and meaning the theoretical ceiling on global supply growth has not been reached in practice
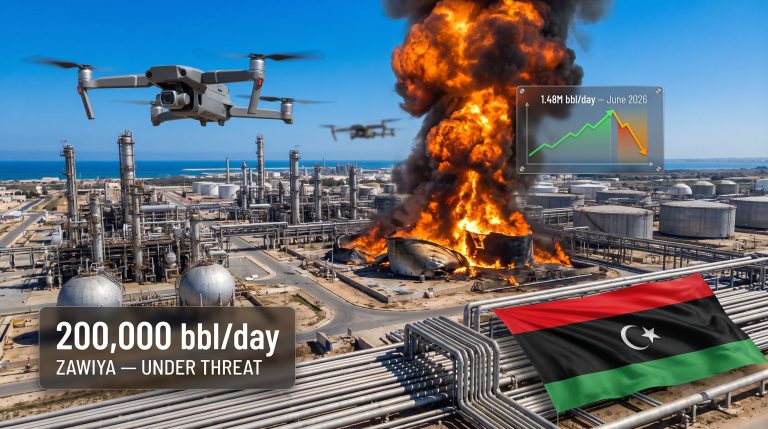
- Libya supply uncertainty: Drone attacks on Libyan oil infrastructure have added a further layer of supply disruption risk to an already strained global balance
Product Inventories: What the Refined Product Markets Are Signalling
Gasoline: Quiet Tightness Beneath the Surface
Gasoline inventories have now posted consecutive weekly draws of 1.6 million barrels and 1.0 million barrels respectively, even as average daily production fell to 9.6 million barrels per day. This production decline is notable because it suggests refiners are not simply choosing to allocate less crude to gasoline yield optimisation, but that throughput constraints are limiting overall output capacity.
For a market that might interpret the large crude build as a sign of abundant supply, the gasoline picture tells a more cautious story: product-level tightness can persist or intensify even when crude stockpiles are comfortable.
Distillates: The Industrial Economy's Canary
Distillate inventories, which encompass diesel and heating oil, represent one of the most important leading indicators for industrial and freight sector health. The current distillate deficit of approximately 12% below the five-year seasonal average is a structurally significant data point that should not be overshadowed by the crude headline.
| Product | Inventory Change | Production Rate | vs. 5-Year Average |
|---|---|---|---|
| Gasoline | -1.0 million barrels | 9.6 million bpd | Declining trajectory |
| Distillates | -100,000 barrels | 5.3 million bpd | ~12% below average |
| Crude (commercial) | +17.4 million barrels | N/A | ~2% below average |
The year-over-year growth in distillate demand of 1.9% is particularly meaningful because diesel consumption is tightly correlated with freight volumes, manufacturing activity, and agricultural operations. Rising distillate demand against a backdrop of below-average inventories creates a product-specific tightness that can become a price catalyst entirely independent of where crude stockpiles sit.
Distillate production increasing to an average of 5.3 million barrels per day provides a partial offset. However, the deficit remains structurally wide enough to warrant close monitoring as the heating season approaches in Q4.
The next major ASX story will hit our subscribers first
API vs. EIA: Understanding the Reporting Gap
The divergence between the API's preliminary estimate of 9.072 million barrels and the EIA's confirmed figure of 17.4 million barrels in this reporting cycle — a gap of more than 8 million barrels — was larger than typical. This highlights why sophisticated market participants treat the two reports with different levels of analytical weight.
The API survey draws on voluntary submissions from industry participants, which means coverage is inherently incomplete and subject to reporting lags from smaller operators. The EIA's mandatory survey base captures a broader cross-section of industry activity, including terminal operators, pipeline companies, and refiners who may not participate in the API process.
Trader Insight: Market participants typically use the API release as a directional positioning signal and the EIA report as the authoritative confirmation. When the two diverge significantly in magnitude, as they did in this cycle, intraday volatility tends to spike in the hours between the API release and the following morning's EIA publication as traders hedge against the uncertainty.
Scenario Pathways for U.S. Crude Inventories Through Q4 2026
With commercial inventories now sitting approximately 2% below the five-year seasonal average following this build, the medium-term trajectory depends heavily on the interaction between refinery demand, export flows, and geopolitical resolution. Furthermore, the ongoing trade war oil impact on global demand forecasts adds further uncertainty to each of the following pathways.
Scenario 1: Continued Builds (Bearish)
- Refinery utilisation remains constrained by margin compression or unplanned outages
- Import volumes hold elevated while export demand softens
- Inventories push above the five-year average and WTI gravitates toward the lower end of its recent trading range
Scenario 2: Stabilisation Near Current Levels (Neutral)
- Refinery runs recover and absorb incoming crude at a faster pace
- Export demand remains stable, preventing further meaningful accumulation
- Stockpiles oscillate within a narrow band around seasonal norms through year-end
Scenario 3: Renewed Draws (Bullish)
- Hormuz disruptions or additional geopolitical shocks reduce available global supply and increase U.S. export competitiveness
- Domestic demand strengthens as economic activity accelerates into Q4
- Distillate tightness pulls crude processing rates higher, drawing down commercial stocks
Frequently Asked Questions: EIA Crude Oil Inventories
What does a large crude inventory build mean for oil prices?
A significant single-week build in commercial stockpiles generally signals that supply is outpacing demand absorption, which can exert downward pressure on futures prices. However, the actual price response depends on the broader context, including geopolitical risk premiums, refinery processing rates, and how current inventory levels compare to seasonal norms.
Why did oil prices remain elevated despite a historically large build?
Because futures pricing reflects both current supply conditions and forward-looking risk assessments. Active geopolitical disruptions, particularly around the Strait of Hormuz and Russian export flows, are keeping a material risk premium embedded in Brent and WTI pricing that domestic storage data alone cannot displace.
What is the five-year average for U.S. crude inventories, and why does it matter?
The five-year seasonal average serves as the benchmark reference point for assessing whether current stockpile levels are tight or loose relative to historical norms. With inventories at 424.4 million barrels and approximately 2% below that average, the domestic market is in a broadly balanced position, though the deficit compared to seasonal norms has narrowed sharply following this build.
Why do distillate inventories matter if crude inventories are building?
Distillate products, including diesel and heating oil, act as a leading indicator of industrial and freight sector demand. A distillate deficit of 12% below the five-year average signals structural tightness in the refined product market that can eventually pull crude processing rates higher, regardless of where headline crude storage sits.
What is the difference between commercial inventories and the Strategic Petroleum Reserve?
Commercial crude inventories represent oil held by private sector entities for operational and trading purposes. The Strategic Petroleum Reserve is a federally managed emergency stockpile that is accounted for separately and is not included in the commercial inventory figures reported by the EIA each week. The EIA's Short-Term Energy Outlook provides additional context on how both reserves factor into broader U.S. energy supply assessments.
What Traders and Analysts Should Take Away
The EIA's confirmation of a 17.4 million-barrel weekly crude inventory build is a significant data point, but it must be read within a multi-layered market context rather than as a standalone bearish signal. Several conclusions stand out:
- The build has narrowed the inventory deficit relative to the five-year seasonal average to approximately 2%, representing a meaningful shift from the deeper deficits seen earlier in the year
- Product market signals, particularly the 12% distillate deficit and consecutive gasoline inventory draws, indicate the downstream supply picture remains considerably tighter than the crude headline implies
- Geopolitical risk premiums embedded in global crude benchmarks are absorbing the bearish data and preventing the kind of price correction that a build of this magnitude might historically have triggered
- The API-EIA divergence of more than 8 million barrels in this cycle serves as a reminder that pre-positioning based solely on the preliminary estimate carries meaningful basis risk
- The oscillating weekly pattern observed over the past several months reflects genuine market uncertainty rather than a clear directional supply trend
According to Trading Economics' crude oil stocks tracker, these volatile swings in weekly inventory changes have become increasingly common as global supply chains remain fragmented and demand signals remain mixed across major consuming economies.
Bottom Line: A single week's inventory figure, even a historically large one, rarely tells the complete story. The current U.S. oil market is operating under a dual-signal environment where domestic supply is rebuilding while global supply risk remains structurally elevated. Traders, analysts, and energy investors who note that EIA sees massive uptick in US crude oil inventories without accounting for the geopolitical overlay and product-level tightness are likely to misread both the near-term price outlook and the medium-term structural balance.
Disclaimer: This article is intended for informational and educational purposes only and does not constitute financial, investment, or trading advice. All figures and price references reflect conditions at the time of the EIA data release. Commodity markets are subject to rapid change, and forward-looking scenarios represent analytical frameworks rather than predictions. Readers should conduct independent research and consult qualified advisers before making any investment decisions.
Want to Stay Ahead of the Next Major Commodity Discovery Before the Broader Market Catches On?
While crude oil inventory data and geopolitical risk premiums dominate short-term energy market narratives, significant mineral discoveries on the ASX can offer compelling opportunities for investors seeking exposure to high-impact commodity plays — and Discovery Alert's proprietary Discovery IQ model delivers real-time alerts the moment those discoveries are announced, transforming complex data into actionable insights. Explore historic examples of major mineral discoveries and their market returns, then begin a 14-day free trial to position yourself ahead of the market.