August 12, 2026
The Hidden Complexity Behind Gulf Oil Supply Metrics
When geopolitical disruption intersects with global energy infrastructure, the numbers that reach headlines rarely tell the complete story. Nowhere is this more apparent than in the relationship between crude oil production volumes and the export flows that actually move physical barrels into international markets. During periods of heightened conflict or maritime disruption, the gap between these two metrics can widen dramatically, creating market signals that are deeply misleading if read in isolation. July 2026 presents exactly this kind of analytical challenge, and understanding it requires moving well beyond the headline figures.
When big ASX news breaks, our subscribers know first
Saudi Crude Production Rebounds in July: The Numbers Behind the Recovery
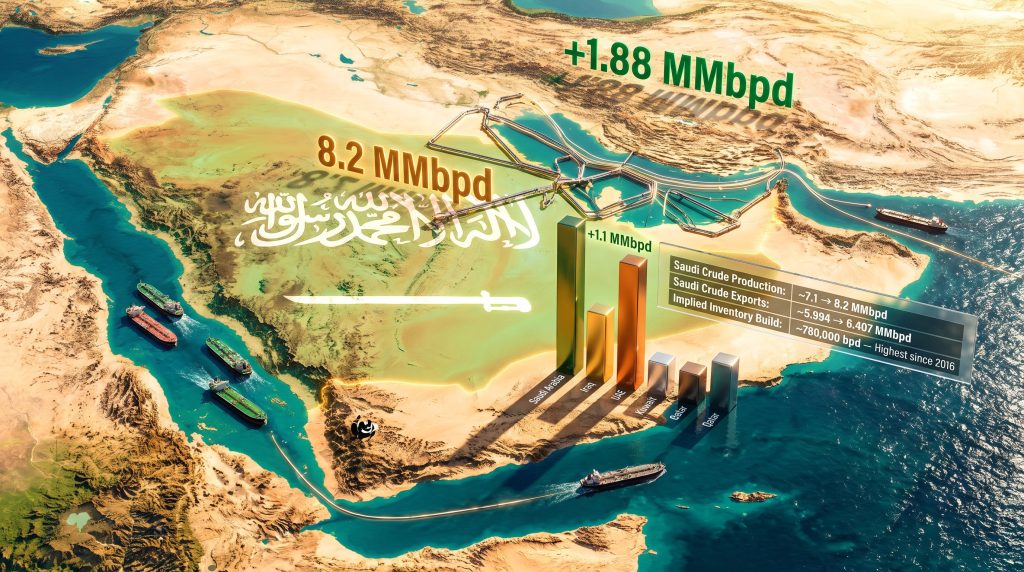
Saudi crude production rebounds in July represent one of the more significant supply-side developments in the global oil market's recent history. According to OPEC's own secretariat report, Saudi Arabia's self-declared output rose from approximately 7.1 million barrels per day (MMbpd) in June to 8.2 MMbpd in July, a month-on-month increase of just over 1 MMbpd. This recovery coincided with a brief ceasefire in the broader Iran conflict, which created a temporary operational window for Persian Gulf producers to restore upstream activity.
However, that production figure does not exist in isolation. Saudi Arabia simultaneously reported having supplied approximately 7.42 MMbpd to the market in July, meaning the gap between what was produced and what was sold into the global market was roughly 780,000 bpd. That differential has flowed directly into domestic crude inventories, which the International Energy Agency estimated had reached their highest level since at least 2016 by early August 2026.
Why the Production-to-Export Gap Matters
The distinction between production and export is one of the most important and frequently misunderstood concepts in oil market analysis. Production measures how much crude is physically extracted from subsurface reservoirs, while export volumes reflect how much of that crude is shipped to overseas buyers. These figures can diverge for several reasons:
- Refinery throughput increases absorb domestic crude before it reaches export terminals
- Maritime route disruptions prevent tankers from loading or transiting key corridors
- Strategic inventory decisions by national oil companies decouple production from market supply
- Infrastructure damage or maintenance reduces terminal loading capacity
In July 2026, all of these dynamics were potentially in play simultaneously. The Strait of Hormuz and the Bab el-Mandeb Strait, two of the world's most strategically critical maritime chokepoints, remained under pressure throughout the month. These corridors represent the primary routes through which Saudi crude reaches Asian and European buyers respectively, and their disruption forces exporters to either hold barrels onshore or seek longer, costlier alternative routing. Furthermore, the broader oil geopolitics and supply environment in 2025 and 2026 had already primed markets to expect exactly these kinds of disruptions.
The Dual Chokepoint Problem: Hormuz and Bab el-Mandeb
Understanding the severity of Saudi Arabia's export constraints requires appreciating the geographic concentration of its maritime infrastructure. The kingdom's crude export system is effectively anchored by two terminal clusters: those facing the Persian Gulf and those positioned on the Red Sea coast.
Yanbu and the Red Sea Dependency
Reuters-cited shipping intelligence indicated that Saudi Arabia's Red Sea export terminal at Yanbu carried approximately 75% of the kingdom's combined crude and condensate export volumes during the first half of July, handling roughly 5.29 MMbpd in total flows. That level of concentration at a single terminal is operationally significant. Under normal conditions, export flows are distributed more evenly across both coasts, providing redundancy. When one corridor is disrupted, the surviving route absorbs disproportionate throughput, increasing logistical risk and congestion.
The Yanbu terminal's central role during this period also reflects Saudi Aramco's East-West Pipeline system, commonly known as the Petroline, which moves crude overland from eastern fields to Red Sea loading points, bypassing Hormuz entirely. This 1,200-kilometre pipeline has a nameplate capacity of approximately 5 MMbpd, making it one of the world's largest crude transport arteries and a critical strategic asset during any Persian Gulf disruption.
The operational importance of bypass infrastructure like the Petroline becomes dramatically clearer during conflict periods. Its capacity ceiling represents a hard physical constraint on how much Saudi crude can reach western markets without transiting Hormuz.
Conflicting Data Sources: Why Saudi July Figures Vary Across Agencies
A particularly underappreciated dimension of this story is the fact that different authoritative data sources report materially different production figures for Saudi Arabia in July 2026. This divergence is not evidence of error; it reflects genuine structural differences in how each agency collects and defines crude output data.
| Data Source | Reported Saudi Output | Directional Trend |
|---|---|---|
| OPEC Secretariat (self-reported) | ~8.2 MMbpd | Up from 7.1 MMbpd in June |
| JODI-linked reporting | ~9.201 MMbpd | Down from 9.752 MMbpd in June |
| Bloomberg survey estimate | Consistent with OPEC group increase of ~1.16 MMbpd | Upward |
The JODI figures, which are derived from national statistical submissions and may incorporate condensate volumes or slightly different measurement boundaries, show a higher absolute output level but a month-on-month decline. This apparent contradiction resolves when one recognises that the OPEC secretariat data reflects crude-only self-reporting, while JODI-adjacent figures may blend crude with condensate, natural gas liquids, or other hydrocarbon streams depending on how each country defines and reports production domestically.
For market analysts, the practical implication is that no single dataset should be treated as definitive. A rigorous analysis triangulates across OPEC self-reports, JODI submissions, IEA secondary estimates, and Bloomberg tanker-tracking surveys to form a probabilistic view of actual supply conditions. In addition, understanding OPEC's market influence on pricing and quota compliance adds essential context to any reading of these divergent figures.
Export Data Tells a Different Story
Even on the export side, the picture is more nuanced than a simple production rebound narrative suggests:
| Metric | June 2026 | July 2026 | Change |
|---|---|---|---|
| Saudi Crude Production (OPEC data) | ~7.1 MMbpd | ~8.2 MMbpd | +1.1 MMbpd |
| Saudi Crude Exports (JODI-linked) | ~5.994 MMbpd | ~6.407 MMbpd | +0.413 MMbpd |
| Implied Inventory Build | — | ~780,000 bpd | Highest since 2016 |
The export recovery of roughly 413,000 bpd month-on-month is meaningful but modest relative to the production rebound. The gap confirms that a significant portion of the additional crude lifted in July was retained onshore, either by logistical necessity or strategic calculation. Consequently, the geopolitical and logistical factors shaping Saudi export flows in this period are arguably just as consequential as the production figures themselves.
OPEC's Collective July Recovery: Iraq and Saudi Arabia Lead
Saudi Arabia's output increase did not occur in isolation within the OPEC framework. Among the seven member states that submitted direct production data to OPEC's secretariat for July, collective output rose by approximately 1.88 MMbpd. Saudi Arabia and Iraq jointly contributed the dominant share of this increase, effectively making the Gulf's partial ceasefire-driven recovery a two-country phenomenon within the broader cartel.
This concentration of supply recovery within two member states raises important questions about OPEC's production management architecture under wartime conditions. Traditional compliance analysis, which benchmarks member output against agreed quota targets, becomes analytically strained when production is being suppressed by active conflict rather than voluntary restraint. A country resuming output to pre-disruption levels during a ceasefire window is not necessarily exceeding its quota; it may simply be returning to baseline operational capacity.
Inventory Build: Strategic Pre-Positioning or Forced Retention?
The ~780,000 bpd gap between Saudi production and market supply, sustained through July, raises a question that carries significant price implications: is the kingdom deliberately accumulating crude to pre-position for a post-conflict export surge, or is the inventory build an involuntary consequence of route disruption?
Two competing frameworks exist for interpreting this development:
Strategic accumulation thesis: Saudi Arabia is capitalising on the ceasefire window to maximise upstream output while simultaneously stockpiling crude for rapid market release once Hormuz and Bab el-Mandeb fully normalise. Under this scenario, the kingdom gains pricing leverage by controlling a large latent supply overhang that it can deploy to meet demand surges or suppress competitors' pricing power.
Forced retention thesis: Physical export constraints are preventing the kingdom from clearing production into global markets. The inventory build is a consequence of maritime disruption, not a deliberate commercial strategy. Under this scenario, Saudi Arabia's ability to monetise its production gains is being actively constrained by geopolitical conditions outside its control.
The distinction between these two interpretations is not merely academic. If the build reflects deliberate accumulation, a coordinated export release could exert sharp downward pressure on Brent prices once maritime routes normalise. If it reflects forced retention, the unwinding will be more gradual, constrained by logistics restoration timelines.
The next major ASX story will hit our subscribers first
Price Implications: Three Scenarios for the Second Half of 2026
Oil prices had already begun responding to Gulf supply recovery signals before export volumes fully reflected the production rebound. This reflects a well-documented pattern in commodity markets where forward-looking price formation incorporates supply signals well ahead of physical delivery confirmation. The broader oil market dynamics at play during this period further complicate any straightforward bullish or bearish price thesis.
| Scenario | Trigger Conditions | Estimated Price Impact |
|---|---|---|
| Full Route Normalization | Ceasefire holds; both Hormuz and Bab el-Mandeb reopen | Significant downward pressure; inventory release accelerates |
| Partial Recovery | One corridor reopens; exports recover to ~80% of pre-conflict levels | Moderate price softening; market caution persists |
| Renewed Escalation | Hostilities intensify; both export routes fully disrupted | Sharp upward price spike; production gains become irrelevant to markets |
Disclaimer: The above scenarios represent analytical frameworks for market assessment purposes and should not be construed as investment advice. Commodity price trajectories involve significant uncertainty and are subject to geopolitical, logistical, and demand-side variables that cannot be predicted with precision.
What Analysts Often Miss: The Condensate Factor and Measurement Complexity
One element of Saudi production reporting that receives insufficient attention in mainstream coverage is the role of condensate in headline output figures. Saudi Arabia's major fields, particularly those in the Ghawar and Khurais complexes, produce associated condensate alongside crude oil. Depending on which reporting framework is used, condensate volumes may or may not be included in published production totals.
This matters because condensate is a lighter hydrocarbon stream that commands different pricing dynamics and serves different refinery configurations than conventional crude. When JODI-linked figures report a higher absolute output level than OPEC secretariat data, part of that discrepancy likely reflects the inclusion of condensate and potentially natural gas liquids in the national statistical submission that feeds JODI, versus the crude-only scope of OPEC's direct reporting framework.
For traders and analysts modelling Saudi supply, failing to account for this definitional difference can produce materially incorrect assessments of how much crude is actually available for international crude oil markets as distinct from condensate-splitting or petrochemical feedstock markets. Furthermore, the broader issue of sanctions and oil trading in the current environment serves as a useful parallel, illustrating how political constraints can distort reported versus actual supply figures across multiple producer nations. According to Trading Economics, Saudi crude oil production data has historically exhibited notable variation between self-reported and independently verified figures, underscoring the importance of cross-referencing multiple data sources.
Key Takeaways
- Saudi crude production rebounds in July to 8.2 MMbpd, up from 7.1 MMbpd in June, driven by a temporary ceasefire that restored Persian Gulf upstream activity
- The ~780,000 bpd gap between production and market supply has pushed Saudi domestic crude inventories to their highest level since at least 2016
- Export data shows a more modest recovery, with JODI-linked figures suggesting Saudi crude exports reached approximately 6.407 MMbpd in July, the highest level since February 2025
- Yanbu terminal absorbed approximately 75% of Saudi crude and condensate shipments in early July, concentrating logistical risk on a single Red Sea facility
- Within OPEC's seven self-reporting members, collective July output rose by 1.88 MMbpd, with Saudi Arabia and Iraq driving the majority of the increase
- Multiple data sources report divergent Saudi production figures, reflecting differences in condensate inclusion, reporting lag times, and collection methodology
- Price sensitivity to Gulf supply signals remains elevated, with oil benchmarks responding to production data even before export volumes confirm a full recovery
For ongoing upstream industry analysis and OPEC production tracking, World Oil provides detailed coverage of Middle East supply dynamics at worldoil.com.
Want to Stay Ahead of the Next Major Resource Discovery?
While geopolitical disruption reshapes global oil supply chains, significant mineral discoveries on the ASX can emerge just as rapidly — and just as unexpectedly. Discovery Alert's proprietary Discovery IQ model delivers real-time alerts the moment significant ASX mineral discoveries are announced, transforming complex data across more than 30 commodities into clear, actionable insights — begin your 14-day free trial today, or explore Discovery Alert's dedicated discoveries page to understand why major mineral discoveries have historically generated substantial market returns.