August 19, 2026
When Water Becomes the Variable That Breaks Energy Markets
Every major energy transition narrative of the past decade has been built around technology curves, capital flows, and geopolitical realignment. Rarely does the conversation begin with rainfall. Yet across the summer of 2026, it is precipitation deficits, reservoir drawdowns, and freshwater scarcity that are quietly dismantling assumptions baked into energy pricing models from London to Mumbai to Santiago.
The El Niño impact on global energy markets is no longer a seasonal footnote. It has become a structural stress test, arriving at precisely the moment when existing energy systems have the least capacity to absorb it.
When big ASX news breaks, our subscribers know first
The Physics of a Record-Breaking Event
El Niño describes the periodic warming of sea surface temperatures across the central and eastern equatorial Pacific Ocean. The mechanism is deceptively simple: warmer ocean surfaces weaken the trade winds that normally push warm water westward, which in turn disrupts the Walker Circulation, the atmospheric conveyor responsible for distributing rainfall across the tropics. The result is drought in regions that depend on that rainfall and flooding in areas unaccustomed to it.
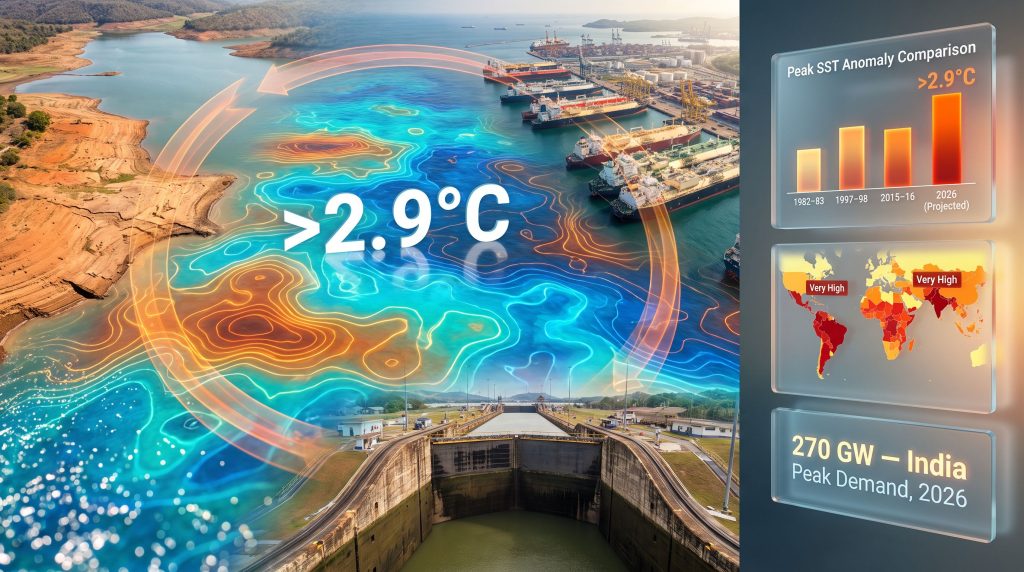
What makes the 2026 event categorically different from its predecessors is the magnitude of the sea surface temperature departure. The World Meteorological Organization confirmed in late July 2026 that Pacific sea surface anomalies are expected to exceed 2.9 degrees Celsius in the central and eastern equatorial Pacific, with intensity expected to peak in November.
Historical El Niño Peak SST Anomaly Comparison:
| Event Year | Peak SST Anomaly (°C) | Classification |
|---|---|---|
| 1982–83 | ~2.1°C | Major |
| 1997–98 | ~2.4°C | Major |
| 2015–16 | ~2.6°C | Major |
| 2026 (Projected) | >2.9°C | Record-Setting |
Source: WMO Global Seasonal Climate Update, August 2026
A co-developing positive Indian Ocean Dipole is amplifying the event's reach well beyond the Pacific basin, sharpening drought and fire risk across South Asia and the broader Indian Ocean rim. These two climate phenomena operating simultaneously represent a compounding hazard that energy risk frameworks have not historically been built to handle. For a broader perspective on how El Niño harms the global economy, the consequences extend well beyond energy markets alone.
It is worth noting that the WMO does not use the term "super El Niño" as an operational classification. The phrase circulates widely in media coverage but carries no formal meteorological definition, a distinction that matters when interpreting agency forecasts versus market commentary.
How El Niño Transmits Into Energy Systems
The transmission channels connecting Pacific Ocean temperature anomalies to commodity prices are more numerous than most market participants recognise. They include:
- Hydropower generation losses driven by reduced precipitation across hydro-dependent catchment areas
- Cooling demand escalation as elevated temperatures in tropical and subtropical regions drive air conditioning load
- Renewable output degradation through altered cloud cover, solar irradiance reduction, and weakened wind resources
- Shipping infrastructure constraints particularly through freshwater-dependent waterways like the Panama Canal
- Thermal substitution demand as coal and natural gas fill the generation gap left by underperforming clean energy sources
The critical insight that separates 2026 from prior cycles is that each of these channels is operating against a backdrop already stripped of slack by geopolitical disruption, primarily the conflict affecting Strait of Hormuz transit volumes. Furthermore, commodity market volatility has been significantly amplified by the interplay between commodity market volatility and climate-driven supply disruptions. El Niño is not landing on a balanced market — it is compounding an existing supply constraint.
Hydropower: The First and Largest Casualty
Latin America is the world's most hydro-dependent major electricity region. Approximately 50 percent of total generation capacity across the continent relies on hydroelectric sources, creating a structural vulnerability that no other major region replicates at scale.
Regional Hydro Dependency and El Niño Exposure:
| Country | Hydro Share of Generation | El Niño Impact Profile |
|---|---|---|
| Colombia | ~70% | Severe, reservoir levels fell 60–70% during 2015–16 |
| Ecuador | ~60%+ | High, power rationing in recent drought cycles |
| Brazil | ~55–60% | High, regional drought amplifies thermal substitution |
| Peru | ~55% | High, Andean snowpack and rainfall correlation |
During the 2015–16 El Niño, Colombian reservoir levels experienced drawdowns of 60 to 70 percent, a scale of depletion that required emergency thermal generation and cross-border power imports. With reservoirs already tracking behind seasonal targets heading into the 2026 peak, the buffer available to absorb a repeat scenario is materially narrower than it was a decade ago.
Scenario Alert: Should the 2026 event reach its projected November peak intensity, Latin American hydro operators could face a generation deficit at least comparable to the 2015–16 crisis, with less reserve capacity available to cushion the shortfall.
The Cooling Water Problem in Nuclear and Thermal Infrastructure
Hydropower is not the only water-dependent electricity source facing strain. Thermal and nuclear facilities that rely on river systems or reservoir water for reactor and turbine cooling become operationally constrained when water levels fall or temperatures rise.
Romania's Cernavoda nuclear plant illustrates this failure mode in stark terms. In August 2026, Nuclearelectrica initiated a controlled shutdown of the plant's second reactor after Danube water levels dropped to the point where cooling capacity was compromised. This was the first drought-induced full offline event for Cernavoda since 2003, and it removed approximately 20 percent of Romania's electricity supply from the national grid overnight. The industrial response was immediate: Dacia and Ford idled their Romanian manufacturing operations to redistribute available power.
While Romania's Danube crisis has distinct domestic drivers separate from Pacific El Niño dynamics, the operational failure mode it demonstrates is identical to what hydro-constrained regions face when water becomes the binding constraint on electricity infrastructure. It is a failure mode that conventional energy risk models rarely price correctly.
Solar and Wind: The Renewable Output Penalty
A common assumption in energy market analysis holds that El Niño primarily affects fossil fuel demand through heating and cooling dynamics, leaving renewable generation broadly unaffected. Research published in Communications Earth and Environment in March 2026 challenges this framing directly.
The study quantified El Niño's effect on surface solar radiation across key renewable growth markets:
Estimated Solar Irradiance Losses During Strong El Niño Events:
| Region | Estimated Output Loss |
|---|---|
| California | ~5% |
| Southeastern China | Up to 10% |
| Southeast Asia | 5–12% in worst-affected zones |
| Northern India | Moderate, compounded by monsoon disruption |
These losses are occurring precisely where solar capacity additions have been most aggressive over the past five years. The absolute megawatt-hour shortfall in 2026 is therefore larger in real terms than it would have been during any previous comparable event, even if the percentage losses appear moderate.
Wind generation faces a parallel challenge. El Niño alters large-scale atmospheric circulation in ways that weaken trade winds and shift jet stream positioning, reducing wind resource availability across parts of Asia, Latin America, and the western United States. The combined effect on renewable output creates a generation gap that thermal fuels must fill. The IEA's analysis of cooling demand and rising electricity consumption further underscores the scale of pressure building on global generation systems.
India: A Convergence of Pressures
No single country captures the complexity of El Niño's energy market impact more completely than India. The country simultaneously presents as:
- A rapidly expanding renewable energy market
- A hydro-dependent electricity system across key states
- A major coal consumer facing structural supply constraints
- A tropical economy highly sensitive to cooling demand escalation
Analysis of the La Niña-to-El Niño transition from July 2026 through June 2027 projects weakened wind and hydro output colliding with approximately 10 terawatt-hours of additional cooling demand, producing a generation gap estimated near 18 TWh.
India's El Niño Energy Gap, Scenario Analysis:
| Scenario | Additional Coal Generation Required | Context |
|---|---|---|
| Moderate El Niño | ~12–15 TWh | Manageable with existing thermal capacity |
| Strong El Niño | ~24 TWh | ~50% of India's total coal burn increase in prior year |
| Record-Intensity Event | >24 TWh | Potential for spot LNG imports and rationing |
India's peak electricity demand already reached a record 270 gigawatts during summer 2026, establishing a new consumption baseline from which El Niño-driven demand escalation will compound further during the event's peak phase.
The next major ASX story will hit our subscribers first
LNG Markets: Why the Bearish Winter Narrative Falls Short
The dominant interpretation in gas markets holds that El Niño is broadly bearish for European LNG demand: warmer winters reduce heating requirements, ease storage drawdowns, and give buyers room to breathe. This framing captures a real dynamic but overstates its magnitude significantly. In addition, the LNG supply outlook for 2025 and beyond was already under strain before El Niño entered the equation.
Rystad Energy's modelling identifies a critical threshold that the market appears to be overlooking:
European winter temperatures would need to average at least 2 degrees Celsius above seasonal norms before LNG demand falls back to the prior year's level. That magnitude of warming anomaly has occurred only twice in the past 25 years.
Rystad's base case projects European gas storage reaching 76 percent capacity on November 1, below the level required for comfortable winter passage, with a year-on-year LNG deficit of approximately 15 million tonnes through June 2027. Qatari supply volumes remain constrained by regional conflict dynamics.
European LNG Balance, El Niño Scenario Sensitivity:
| Scenario | LNG Gap vs. Prior Year (Mt) | Storage Nov. 1 |
|---|---|---|
| No El Niño | ~15 Mt deficit | ~72–74% |
| Moderate El Niño | ~7 Mt deficit | ~76% |
| Strong El Niño | ~3–4 Mt deficit | ~78–80% |
| Record-Intensity Event | Near balance | ~82%+ |
Even the most bullish scenario — a record-intensity event producing maximum demand destruction in European heating markets — only closes the LNG gap rather than generating surplus. The probability-weighted expectation across scenarios still points toward structural undersupply through the winter of 2026–27. Traders monitoring natural gas price trends will recognise how these dynamics are feeding into already-elevated price volatility.
The Panama Canal: Infrastructure at Its Limits
The Panama Canal's operational capacity is directly tied to the water level of Gatun Lake, which feeds both the Neopanamax lock system and the Gatun Dam hydroelectric facility. El Niño-driven rainfall deficits in the Panamanian highlands drain Gatun Lake, forcing the Panama Canal Authority to reduce maximum vessel draft limits and cut daily transit slots.
By early August 2026, the Canal had implemented its fourth and fifth draft reductions of the year, with Gatun Lake sitting just above 84 feet and projected to fall toward 83 feet by September. The Panama Canal Authority is simultaneously throttling hydroelectric generation at Gatun Dam to conserve water, meaning the infrastructure crisis is producing an electricity supply constraint within Panama itself.
2026 Panama Canal Draft Reduction Timeline:
| Period | Cumulative Reductions | Gatun Lake Level |
|---|---|---|
| Early 2026 | 1st and 2nd reductions | Above 85 feet |
| Mid-2026 | 3rd reduction | ~85 feet |
| August 2026 | 4th and 5th reductions | ~84 feet |
| September 2026 (Projected) | Further decline possible | ~83 feet |
What makes this particularly consequential is the context into which it lands. Canal transits ran 5.2 percent higher through the first nine months of fiscal 2026, driven partly by LPG carriers rerouted away from Hormuz. The waterway is absorbing overflow from one energy crisis precisely when El Niño is reducing its operational capacity to handle it. Draft restrictions constrain cargo loads on LNG, LPG, and bulk commodity vessels, effectively functioning as a supply chain tax on Pacific-to-Atlantic energy flows.
The One Asymmetric Upside: Atlantic Hurricane Suppression
Strong El Niño events historically suppress Atlantic hurricane activity through enhanced upper-level wind shear, which disrupts storm formation and intensification before tropical systems can develop into major hurricanes.
NOAA's August 2026 outlook assigned a 75 percent probability of a below-normal Atlantic hurricane season, up from 55 percent in prior assessments, projecting seven to thirteen named storms with no more than two major hurricanes. Every strong El Niño event since 1950 has produced a below-normal Atlantic season without exception.
For Gulf of Mexico production infrastructure and Gulf Coast LNG export terminals, which now carry a disproportionately large share of global LNG supply, reduced hurricane risk translates into measurable production continuity and export reliability through the peak demand period.
The caveat is embedded in NOAA's own modelling: El Niño years tend to concentrate whatever storm activity does form toward the Gulf Coast and subtropical Atlantic rather than eliminating it entirely. Both named storms in the 2026 season formed in the Gulf of Mexico, confirming the geographic concentration pattern even as aggregate storm counts remain suppressed.
The Macro Feedback: Inflation Persistence and Central Bank Sensitivity
The aggregate El Niño impact on global energy markets is not occurring in isolation. It is landing on a system already under pressure from geopolitical supply disruption, with energy prices elevated across oil, LNG, and shipping freight benchmarks. Consequently, the global trade war impacts on supply chains are intersecting with climate-driven stress in ways that compound inflationary pressure across multiple fronts.
JPMorgan's analysis of the combined impact of El Niño dynamics and war-related energy price inflation estimates a potential 0.3 percentage point drag on global disinflation in 2027. While modest in absolute terms, this represents a non-trivial contribution to inflation persistence at a moment when major central banks remain highly sensitive to any factor that delays the return of consumer price indices to target.
The macro transmission pathways run as follows:
- Hydro shortfall forces coal and gas substitution, lifting thermal commodity demand and prices
- Cooling demand surges across tropical markets, tightening electricity balances and lifting wholesale power prices
- Panama Canal draft restrictions push LNG and LPG shipping costs higher
- Solar and wind output losses increase renewable balancing costs
- All of the above compounds against a Hormuz-constrained LNG supply base
Furthermore, the oil market disruption stemming from geopolitical tensions is creating an additional layer of price instability that El Niño's demand effects are amplifying in real time.
Regional Vulnerability Summary:
| Region | Primary Channel | Commodity Most Affected | Vulnerability Level |
|---|---|---|---|
| Latin America | Hydro generation loss | Electricity, coal, LNG | Very High |
| South Asia (India) | Cooling demand plus hydro/wind loss | Coal, power | Very High |
| Southeast Asia | Drought and cooling demand | Coal, LNG | High |
| Europe | Mild winter offset (partial) | LNG, gas | Moderate-High |
| North America Gulf | Hurricane suppression upside | Oil, LNG exports | Low-Moderate (net positive) |
| East Asia (China) | Solar output loss, demand shifts | Coal, LNG, solar balancing | Moderate |
Frequently Asked Questions: El Niño and Energy Markets
Does El Niño Always Push Energy Prices Higher?
Not uniformly. The effect is asymmetric and commodity-specific. El Niño tends to be bullish for coal, LNG, and wholesale electricity prices in hydro-dependent and cooling-sensitive markets, while potentially bearish for heating gas demand in regions experiencing warmer winters. In 2026, the dominant near-term risk is supply-side, making the overall price pressure across thermal commodities broadly positive.
Which Energy Commodities Are Most Sensitive?
Ranked by historical sensitivity to strong El Niño events:
- LNG and natural gas affected by both demand shifts and shipping constraints
- Coal the primary substitution fuel when hydro and renewables underperform
- Electricity (wholesale) directly impacted by generation mix changes
- LPG sensitive to Panama Canal draft restrictions and rerouting economics
- Oil exposed through indirect demand effects and hurricane season dynamics
How Long Do the Energy Market Effects Last?
The direct energy market effects of a major El Niño event typically persist for 12 to 24 months from peak intensity. Reservoir recovery, renewable generation normalisation, and demand rebalancing all occur on extended timescales. With the 2026 event projected to peak in November, primary market effects are likely to extend through at least mid-2027.
Why Is the Panama Canal More Exposed Now Than in Previous Events?
Two structural changes have elevated the Canal's importance since the last major El Niño. First, LNG and LPG transit volumes through the waterway are significantly higher than in prior cycles, reflecting the expansion of U.S. Gulf Coast export capacity. Second, the rerouting of Hormuz-displaced cargo onto Canal routes has elevated baseline transit demand precisely when El Niño is reducing the Canal's operational capacity. The waterway is simultaneously managing overflow from a geopolitical energy crisis while being physically drained by a climate one.
Disclaimer: This article is for informational and educational purposes only and does not constitute financial, investment, or commodity trading advice. Forecasts and scenario analyses referenced herein are drawn from third-party institutions and are subject to significant uncertainty. Readers should conduct independent research before making any investment decisions related to energy markets or commodity exposures.
Want to Track the Commodity Opportunities Emerging From This Climate-Driven Market Disruption?
As El Niño reshapes thermal coal, LNG, and energy commodity dynamics across global markets, Discovery Alert's proprietary Discovery IQ model delivers real-time alerts on significant ASX mineral discoveries — ensuring subscribers can identify actionable opportunities ahead of the broader market. Explore historic mineral discoveries and the returns they generated, then begin your 14-day free trial to position yourself at the forefront of the next major find.