July 22, 2026
Three Shocks, One Storm: Why 2026 Could Deliver the Most Disruptive Food Inflation in a Generation
Agricultural commodity markets have experienced inflationary episodes before. The 2007–2008 food price crisis, driven by biofuel mandates and a drought-hit wheat harvest, pushed global food prices to levels that triggered political instability across dozens of countries. The 2010–2011 episode, amplified by Russian export bans and La Niña-driven flooding in Australia, sent wheat futures soaring by more than 70% within months. Yet each of those crises shared a common characteristic: a dominant, identifiable trigger.
What distinguishes the 2026 risk environment is categorically different. Rather than a single dominant shock, global agricultural markets are now contending with three structurally reinforcing disruptions converging at precisely the same moment. El Niño food inflation and fertilizer costs, combined with pre-existing supply chain fragility, create a compound inflationary architecture that no single policy lever can fully address. Understanding how these forces interact, and where they will land hardest, is essential for anyone tracking food security, emerging market economics, or agricultural commodity exposure.
When big ASX news breaks, our subscribers know first
The Three-Shock Framework: How Compound Inflation Actually Works
Economists often model inflation shocks as discrete events. In practice, the most dangerous episodes occur when multiple shocks are not merely additive but multiplicative, each amplifying the others through shared transmission pathways.
The current environment features exactly that dynamic across three dimensions:
-
Climatic disruption: A super El Niño, formally declared by the Japanese Meteorological Agency, is expected to extend adverse weather patterns across multiple growing seasons, with potential duration exceeding two years.
-
Geopolitical supply fractures: Disruptions to Strait of Hormuz shipping have concentrated supply chain disruption risk in one of the world's most strategically sensitive waterways, affecting the flow of oil, gas, and Gulf-region fertilizer exports simultaneously.
-
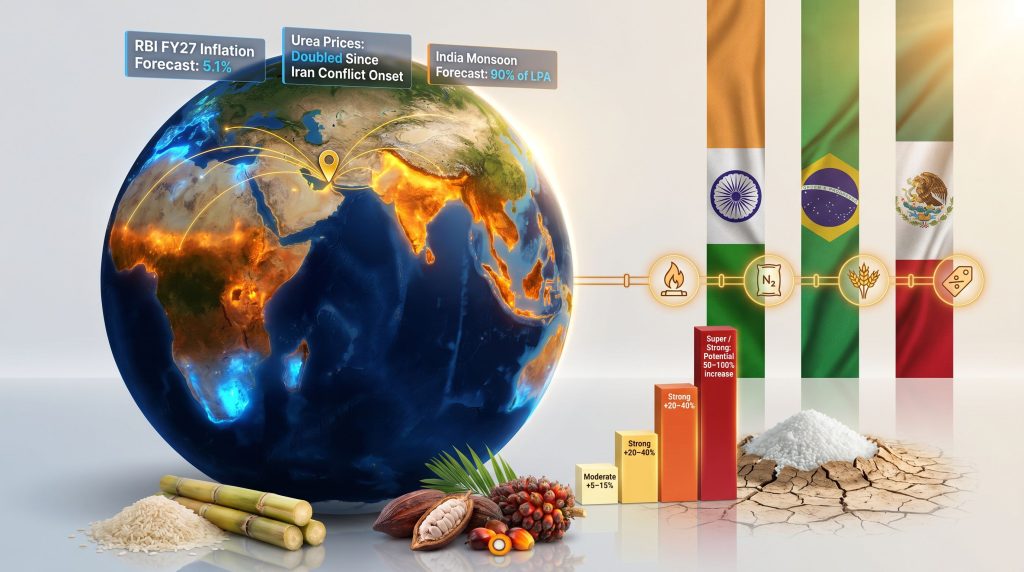
Structural fertilizer cost escalation: With natural gas representing the dominant input in urea and ammonia production, energy price volatility transmits directly into farm input costs. Urea prices have roughly doubled since the escalation of conflict affecting regional shipping routes.
What makes the 2026 configuration uniquely dangerous is timing. These shocks are not arriving sequentially, allowing markets to absorb and adjust. They are landing in overlapping waves, compressing the adjustment horizon for farmers, governments, and central banks alike. Commodity price impacts have already reached their highest levels since November 2023, driven by this convergence of reinforcing pressures.
A single shock capable of lifting food prices by 15% to 20% is disruptive. Three mutually reinforcing shocks, each capable of independently driving significant price moves, arriving together during an already-stressed inflationary baseline, creates a scenario where double-digit global food inflation within 12 months cannot be dismissed as a tail risk.
What Is a Super El Niño and Why Does Scale Matter?
El Niño is classified by the degree of sea surface temperature anomaly in the central and eastern equatorial Pacific Ocean. A moderate event, defined by anomalies of roughly 1 to 1.5 degrees Celsius above baseline, typically produces localised crop disruption with a 12 to 18 month duration. A strong or super event, characterised by anomalies exceeding 2 degrees Celsius, extends the disruption window to 24 months or more, compounding multiple consecutive growing seasons and fundamentally challenging annual agricultural planning cycles.
The asymmetric regional geography of El Niño's effects is critically important for commodity market positioning:
-
Drought and heat stress zones: South and Southeast Asia, Central America, sub-Saharan Africa including northwestern Ethiopia, South Sudan, and Sudan face significantly reduced rainfall.
-
Excessive rainfall and flood zones: Southern South America, parts of the United States, and Central Asia experience elevated precipitation, storm frequency, and flood risk.
This asymmetry means El Niño does not simply reduce global agricultural output uniformly. It reallocates which regions face surplus and which face deficit, disrupting established trade flows and creating localised price spikes in regions where domestic production is most impaired.
Historical Precedent: What Strong El Niño Events Actually Do to Prices
Historical analysis across El Niño cycles since 1951 provides a sobering statistical baseline. In 12 of 17 El Niño years since that year, India recorded deficient monsoon rainfall. The 2015 event remains the most instructive modern precedent: India's Meteorological Department initially forecast rainfall at 93% of the long-period average, but actual rainfall came in at 86%, triggering drought-like conditions across a significant portion of the country.
That gap between forecast and reality underscores how even conservative official projections can understate realised agricultural stress. According to research on El Niño and food price pressures, geopolitical dynamics compound climate shocks in ways that standard commodity models consistently fail to capture.
| El Niño Intensity | Typical Food Price Impact | Disruption Duration | Primary Risk Regions |
|---|---|---|---|
| Moderate | +5 to 15% on select commodities | 12 to 18 months | Localised agricultural zones |
| Strong | +20 to 40% on vulnerable baskets | 18 to 24 months | Emerging market breadbaskets |
| Super / Very Strong | Potential 50 to 100% increase | 24+ months | Global commodity supply chains |
Scenario modelling of a very strong El Niño, consistent with historical correlations, suggests the possibility of 50 to 100% food price increases at the global commodity level over a 12-month period. Consumer retail price impacts are typically dampened by processing and distribution buffers, but in high-inflation environments these buffers compress as supply chain participants pass costs through more aggressively.
The Energy-Fertilizer-Food Transmission Chain
One of the least widely understood dynamics in food price inflation is the mechanistic link between natural gas prices and the cost of putting crops in the ground. Fertilizer production, particularly urea and ammonia synthesis, is extraordinarily energy-intensive. Natural gas is not merely a fuel used in the manufacturing process but the primary feedstock from which nitrogen fertilizer is chemically derived.
This creates a direct, near-lockstep relationship: when natural gas price trends shift upward due to geopolitical disruption, fertilizer manufacturing costs follow within weeks. When Strait of Hormuz shipping becomes constrained, the consequences are not limited to crude oil markets. Approximately one-third of global urea supply originates from Gulf region producers whose export logistics depend on unimpeded Hormuz access.
Furthermore, the timing of the current cost shock could hardly be worse. Fertilizer price escalations are coinciding with Northern Hemisphere planting seasons, compressing the window within which farmers can substitute inputs or adjust crop mix. The lagged transmission effect means the full consequences will unfold progressively:
-
Months 1 to 3: Fertilizer spot prices surge; forward contracts reprice upward.
-
Months 3 to 6: Farm-gate production cost increases are locked in for the current planting season.
-
Months 6 to 12: Reduced application rates or crop mix adjustments begin affecting harvest yields.
-
Months 12 to 24: Consumer food prices at retail reflect the compounded effect of higher input costs and lower yields.
Critically, even a partial re-opening of Hormuz shipping lanes does not immediately restore fertilizer price normalcy. Inventory depletion across importing regions and contract repricing by producers means the cost shock is already embedded in multi-season production planning for farmers in Brazil, India, the United States, and across Southeast Asia.
How Does Fertilizer Import Reliance Worsen Exposure?
The degree of fertilizer import reliance across major agricultural economies is a critical determinant of how severely El Niño food inflation and fertilizer costs will transmit into domestic food prices. Nations with high import dependency and limited domestic production capacity face the sharpest pass-through from global fertilizer market disruptions, with relatively few policy tools available to insulate farmers in the short term.
Commodity Vulnerability: Which Agricultural Markets Face the Greatest Exposure?
Not all agricultural commodities face equivalent risk from the current convergence of pressures. Understanding the differentiated exposure across the commodity spectrum is essential for accurate assessment.
Highest near-term price sensitivity:
-
Rice: Deeply dependent on monsoon-fed irrigation across South and Southeast Asia; supply disruptions centred on India and Thailand carry outsized global price implications.
-
Sugar: Brazil's centre-south cane regions face drier-than-normal conditions during key growing periods; El Niño historically compresses sugarcane yields with direct consequences for global refined sugar pricing.
-
Cocoa: West African production zones, responsible for roughly two-thirds of global cocoa supply, face heat and drought stress threatening both bean quality and volume.
-
Palm and Soy Oils: Indonesian and Malaysian palm oil output is vulnerable to irregular rainfall distribution; Brazilian soy expansion plans face compounding pressure from unfavourable global prices and elevated input costs.
Medium sensitivity with a 3 to 12 month lag:
-
Maize and Wheat: Brazil's winter corn crop faces compounding risks from weather and fertilizer cost headwinds simultaneously.
-
Livestock and Soy-Fed Meats: The lag between grain price increases and meat price inflation typically runs 4 to 6 months as higher feed costs work through animal production cycles.
-
Coffee and Bananas: Centre-south growing regions of Brazil and highland zones across Southeast Asia face temperature and rainfall stress affecting quality and yield.
Lower structural sensitivity:
-
Developed market economies with diversified import sourcing, deep strategic reserves, and processed food supply chains that smooth spot commodity volatility.
-
China, South Korea, and Taiwan, which analysts identify as relatively well-insulated owing to import diversification and domestic buffer stock policies.
India: The Most Exposed Major Economy
No major economy faces a more concentrated set of El Niño vulnerabilities than India. The structural dependency is stark: approximately 75% of India's annual rainfall arrives during the June to September monsoon window. The India Meteorological Department has forecast monsoon rainfall for the current season at 90% of the long-period average, a level that, if realised, would represent the weakest monsoon performance since 2015.
Early-season data reinforces concern. Rainfall in the first two weeks of June ran significantly below normal, and the monsoon's progression across the subcontinent stalled at a pace inconsistent with historical seasonal patterns. Agriculture Minister Shivraj Singh Chouhan has classified approximately 200 districts, representing roughly a quarter of India's total, as highly vulnerable to El Niño weather impacts.
The macroeconomic consequences are already visible in the data:
-
Headline CPI accelerated to 3.9% year-on-year in May, up from 3.5% in April.
-
Food price inflation within that headline figure was running faster at 4.8% year-on-year.
-
The Reserve Bank of India revised its FY27 inflation forecast upward to 5.1% from a prior estimate of 4.6%, whilst simultaneously cutting its GDP growth forecast to 6.6% from 6.9%.
The RBI faces a structurally uncomfortable policy position. Analysts project that headline CPI could breach the upper bound of the central bank's 2 to 6% flexible inflation target by the third quarter of FY27 if monsoon conditions deteriorate toward the 2015 precedent.
If India's monsoon delivers actual rainfall at 86% of the long-period average, consistent with the 2015 outcome rather than the IMD's current 90% forecast, the combination of drought-damaged summer crops, elevated food prices, and energy import costs could push headline inflation materially above the RBI's ceiling, constraining policy flexibility for multiple quarters.
The next major ASX story will hit our subscribers first
Brazil: Hydroelectric Pressure and Agricultural Input Cost Escalation
Brazil's exposure to El Niño is geographically bifurcated in ways that create distinct economic risks across sectors. Southern Brazil faces increased precipitation, heavier storms, and elevated flood risk particularly during spring months. The 2024 record floods in Rio Grande do Sul state provide a visceral recent precedent for the severity of extreme weather events that a strong El Niño could replicate or exceed.
Northern and northeastern regions, including parts of the Amazon basin, face the opposite problem: drier conditions that constrain agricultural output and strain freshwater availability. The electricity sector represents an underappreciated transmission mechanism. Brazil's generation capacity is heavily concentrated in hydroelectric facilities, and when reservoir levels fall due to below-normal rainfall, expensive thermoelectric backup generation activates, passing elevated costs directly to consumers.
For agriculture, the critical risk window is the 2026/27 planting season beginning in late 2026. The combination of unfavourable global commodity prices and elevated fertilizer input costs is already creating doubt about whether Brazilian farmers will maintain fertilizer application rates in the upcoming planting cycle. Reduced application rates would embed higher production cost structures with downstream consequences for meat prices and biofuel costs extending well into 2027.
Mexico: Pre-Existing Vulnerability Meets Renewed Shock Risk
Mexico entered the 2026 El Niño period without the buffer of a clean inflationary baseline. Agricultural inflation reached 14.33% year-on-year during the 2023–24 El Niño episode, roughly three times the headline rate during that period. Fruits and vegetables peaked at 25.69% year-on-year. As of March 2026, that same sub-category was already running at 21.77% year-on-year, easing marginally to 14.38% in May but remaining well above headline CPI.
El Niño's regional effects across Mexico are, however, highly differentiated:
-
Northern Mexico sees higher winter precipitation that benefits export-oriented crops but elevates the risk of unseasonal frosts and floods.
-
Centre-south Mexico faces reduced rainfall, with coffee, sugarcane, maize, beans, and avocados representing the most exposed crop categories.
-
Pacific coastal regions experience warmer sea surface temperatures that intensify hurricane season activity, raising infrastructure and export logistics risk.
Banxico cut its benchmark rate to 6.5% in May and signalled that its easing cycle had likely reached its conclusion. A moderate-to-strong El Niño complicates any reconsideration of further easing by injecting supply-side food inflation that interest rate tools cannot effectively address.
The Counter-Argument: Why the Bearish Case on Food Prices Has Some Merit
Balanced analysis requires acknowledging the arguments against the most severe inflation scenarios. Some commodity market analysts have characterised recent positioning in agricultural futures as an aggressive washout, suggesting that the selloff in soft commodities, particularly corn, may have overshot fundamental supply deterioration.
Furthermore, academic research on historical El Niño episodes has found that climate shocks do not uniformly produce inflation across all commodity categories. In some sample periods, particularly within developed market food baskets, climate shocks have generated marginal disinflationary pressure on certain meat and cereal prices through demand-side channels.
However, these counter-arguments face a critical limitation in the 2026 context. The historical episodes from which these findings are drawn did not feature the simultaneous combination of pre-existing elevated fertilizer costs, active geopolitical trade tensions, and already-stressed food price baskets across major emerging economies. The compound risk architecture of 2026 is structurally different from prior single-shock episodes.
Consumer Impact: Translating Commodity Shocks Into Household Economics
The distributional consequences of El Niño food inflation and fertilizer costs are profoundly unequal across income segments and geographies. According to JP Morgan's analysis of food security pressures, lower-income populations bear a disproportionate share of the burden as food represents a far larger share of household expenditure.
| Consumer Segment | Food Share of Household Budget | Impact of 50% Commodity Price Rise | Nutritional Compromise Risk |
|---|---|---|---|
| Low-income emerging market | 40 to 60% | Severe, forces substitution to lower-quality calories | High |
| Middle-income emerging market | 25 to 40% | Significant, compresses discretionary spending | Moderate |
| Low-income developed market | 15 to 25% | Meaningful, amplifies existing cost-of-living pressures | Low to Moderate |
| High-income developed market | 8 to 15% | Noticeable but manageable | Low |
The delayed transmission effect is a key feature of agricultural inflation dynamics that investors and policymakers frequently underestimate. Commodity-level price spikes occurring in mid-2026 are likely to reach grocery shelves in late 2026 and early 2027, meaning the peak consumer pain point may arrive well after commodity futures markets have begun pricing in a resolution.
Policy Responses: What Works, What Doesn't, and What Takes Too Long
Governments and central banks are not without tools, but the available toolkit is poorly matched to supply-side food inflation shocks.
Supply-side interventions offer the most direct impact:
-
Strategic grain reserve accumulation, as India has proactively pursued by increasing state-held stocks of rice and wheat, provides a buffer against near-term domestic price spikes.
-
Export restriction mechanisms can shield domestic consumers but export the inflationary shock to trading partners, often generating retaliatory responses.
-
Targeted fertilizer import subsidies for smallholder farmers can partially offset input cost escalation, though fiscal constraints limit the scale of such programmes in most emerging economies.
Monetary policy responses face structural limitations:
Interest rate tools address demand-driven inflation. They cannot resolve supply-side food price shocks caused by drought, flooding, or fertilizer cost escalation. The RBI, Banxico, and peer central banks in vulnerable emerging markets are consequently caught in a policy trap: growth deceleration argues for rate cuts, whilst food-driven inflation argues for rate restraint.
Medium-term structural responses offer the most durable protection:
-
Investment in drought-resistant crop varieties and precision irrigation infrastructure reduces the transmission coefficient between El Niño weather events and agricultural output losses.
-
Bilateral food supply agreements that diversify import sourcing away from vulnerable corridors reduce concentration risk in supply chains.
-
Domestic fertilizer production capacity expansion reduces the degree to which geopolitically-exposed Gulf region exports can transmit shocks into farm input costs.
These structural investments, however, operate on multi-year implementation timelines. They cannot address the immediate 2026 to 2027 risk window that El Niño food inflation and fertilizer costs are opening right now. Consequently, the burden of near-term adjustment will fall disproportionately on the households and economies least equipped to absorb it.
Disclaimer: This article is intended for informational and educational purposes only and does not constitute financial, investment, or commodity trading advice. Forecasts, scenario projections, and price estimates referenced throughout involve inherent uncertainty and should not be treated as predictions of specific outcomes. Readers should conduct independent research and consult qualified advisers before making any investment or economic planning decisions based on the information presented.
Want to Identify the ASX Mineral Discoveries That Could Benefit From Commodity Price Volatility?
When converging shocks reshape global commodity markets, the window to act on significant mineral discoveries can be razor-thin. Discovery Alert's proprietary Discovery IQ model scans ASX announcements in real time, delivering instant alerts on high-potential mineral discoveries across more than 30 commodities — explore historic discovery returns on the Discovery Alert discoveries page to understand what early positioning can mean, and begin your 14-day free trial at discoveryalert.com.au to gain a market-leading edge before the broader market catches on.