
July 21, 2026
Global energy supply chains operate through a complex web of maritime corridors, pipeline networks, and strategic storage facilities that connect production centres with consuming markets across continents. When these pathways face disruption, particularly at critical chokepoints, the resulting market dynamics reveal the fragile interdependencies underlying modern energy security. Furthermore, understanding how traders, governments, and commercial operators respond to supply route uncertainty provides essential insight into the mechanics of oil price movements and geopolitical risk transmission.
The Strategic Architecture of Maritime Energy Infrastructure
Energy chokepoints represent more than geographical bottlenecks; they function as critical nodes where global supply security converges with geopolitical influence. The concentration of petroleum flows through narrow waterways creates systemic vulnerabilities that extend far beyond regional boundaries. When uncertainty in Strait of Hormuz tanker traffic emerges, as witnessed during March 2026, the effects cascade through interconnected energy markets worldwide.
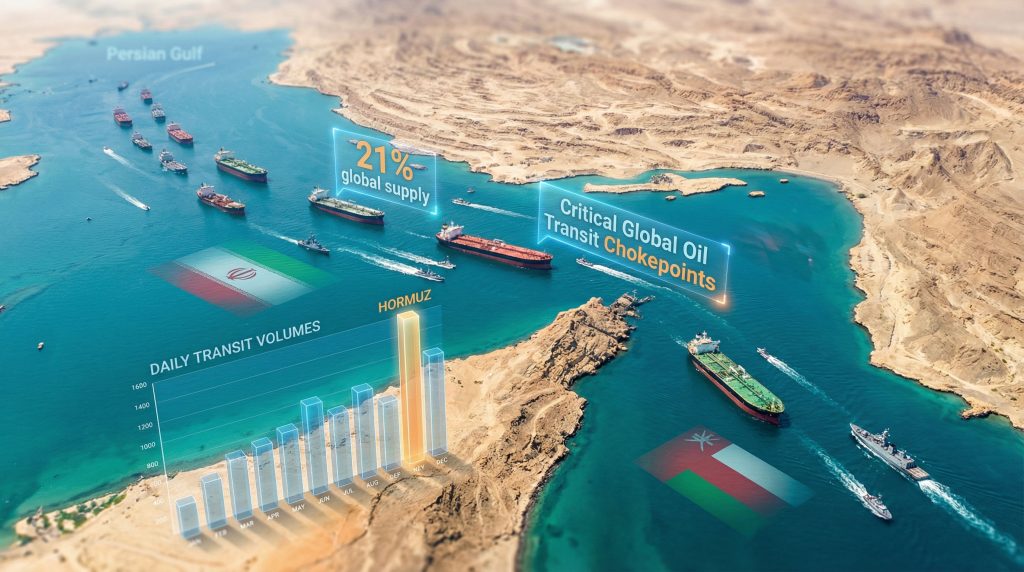
The Strait of Hormuz maintains its position as the world's most strategically significant maritime energy corridor, handling approximately 21 per cent of global crude oil supply during normal operating conditions. This translates to roughly 21 million barrels per day flowing through a waterway barely 21 miles wide at its narrowest point. Consequently, the geographic concentration creates an inherent vulnerability where localised disruptions can immediately affect global energy availability.
Critical Global Energy Transit Analysis
| Chokepoint | Daily Transit Volume | Global Supply Share | Primary Alternative Routes | Bypass Infrastructure |
|---|---|---|---|---|
| Strait of Hormuz | 21 million barrels | 21% | Cape of Good Hope route | Limited pipeline capacity |
| Suez Canal/SUMED | 9.2 million barrels | 12% | Cape of Good Hope route | SUMED pipeline (2.5 million bpd) |
| Strait of Malacca | 16 million barrels | 25% of traded volumes | Lombok/Sunda Straits | None available |
| Turkish Straits | 2.4 million barrels | 3% | Blue Stream/TurkStream | Limited pipeline alternatives |
| Panama Canal | 0.8 million barrels | 1% | Cape Horn route | Cross-Panama pipelines |
Alternative routing capacity remains severely constrained across all major chokepoints. The Cape of Good Hope route around Africa's southern tip can theoretically accommodate diverted traffic from both the Suez Canal and Strait of Hormuz. However, transit times increase by 15-20 days, significantly raising transportation costs and reducing global supply chain flexibility.
Economic dependency ratios reveal how consuming regions face differential exposure to chokepoint disruptions. Asia-Pacific nations import approximately 85 per cent of their crude oil requirements through maritime routes, with over 60 per cent transiting either the Strait of Hormuz or Strait of Malacca. European markets show similar dependencies, importing roughly 75 per cent of petroleum products via maritime transportation, heavily concentrated through Suez Canal routing.
Historical precedent analysis demonstrates that chokepoint disruptions create market responses disproportionate to actual supply reduction. During the 1980-1988 Iran-Iraq War period, the "Tanker War" phase (1984-1987) reduced actual Strait of Hormuz transit volumes by approximately 30 per cent. Nevertheless, crude oil prices increased by over 150 per cent at peak levels, reflecting risk premium expansion beyond fundamental supply-demand imbalances.
When big ASX news breaks, our subscribers know first
Market Psychology Under Supply Route Uncertainty
Energy markets operate through multiple layers of decision-making that extend from physical commodity trading to financial derivatives, shipping logistics, and storage economics. When uncertainty in Strait of Hormuz tanker traffic develops, these interconnected systems respond through mechanisms that amplify volatility beyond what pure supply reduction would suggest.
The March 2026 disruption demonstrated how information uncertainty creates more severe market stress than confirmed supply reductions. West Texas Intermediate crude experienced a 12 per cent single-day decline on March 10, 2026, following conflicting signals about U.S. naval escort operations. This volatility occurred despite no confirmed change in actual oil flows, highlighting how trader psychology dominates price discovery during geopolitical crises.
Risk Premium Calculation Mechanisms
Professional energy traders employ sophisticated models to quantify geopolitical risk premiums, but these frameworks break down under radical uncertainty scenarios. Traditional value-at-risk calculations assume probability distributions for potential outcomes can be estimated from historical data. During unprecedented disruptions, traders face what economists term "Knightian uncertainty" where probability assessments become highly subjective and unstable.
Key factors driving risk premium expansion include:
• Duration uncertainty: Markets cannot predict whether disruptions will last days, months, or years
• Escalation probability: Assessment of whether conflicts will expand geographically or intensify
• Intervention effectiveness: Uncertainty about government or military responses' success likelihood
• Secondary disruption risks: Potential for supply issues to spread to other chokepoints or regions
• Storage constraint timing: Unknown timeframes before producer storage capacity limits force production cuts
The 60-day historical volatility measure in front-month WTI/Brent oil futures reached its highest level since September 2022 during the March 2026 period. This quantifies the magnitude of daily price swings independent of directional bias. This metric serves as a critical indicator of market stress levels, with readings above certain thresholds triggering automated risk management protocols at major trading institutions.
Correlation structures between different energy commodities also shift dramatically during chokepoint disruptions. Normally, crude oil, refined products, and natural gas show varying correlation patterns based on independent supply-demand fundamentals. During Strait of Hormuz uncertainty, correlations between crude grades, shipping rates, and even equity prices of energy companies increase substantially. This occurs as traders reprice multiple assets based on shared exposure to the same geopolitical risk factor.
Infrastructure Vulnerabilities and Operational Dependencies
Maritime energy transportation operates through integrated systems where vessel scheduling, crew management, insurance coverage, and port operations must coordinate seamlessly. Disruptions to any component can cascade through the entire supply chain, creating bottlenecks that persist even after the initial triggering event resolves.
Commercial shipping operators employ sophisticated risk assessment protocols when evaluating transit decisions through disputed waters. These evaluations incorporate multiple variables including crew safety considerations, cargo insurance availability, vessel replacement costs, and charterer contractual obligations. The decision matrix becomes particularly complex when government authorities provide conflicting guidance about security arrangements or safe passage guarantees.
Insurance Market Response Patterns
Marine insurance markets provide critical signals about perceived risk levels through premium adjustments and coverage availability. War risk premiums, which supplement standard hull and cargo insurance, can increase by 500-1000 per cent within hours of geopolitical escalation announcements. These increases reflect not only higher expected loss frequencies but also reduced insurer capacity as underwriters withdraw from high-risk exposures.
"War Risk Premium Indicators: Lloyd's of London war risk rates for Strait of Hormuz transits increased from 0.05 per cent of cargo value to 0.75 per cent within 48 hours of the March 2026 conflict escalation, representing a fifteen-fold increase in insurance costs for a typical 2-million-barrel tanker cargo."
Crew safety protocols create operational constraints that persist beyond immediate military threats. International maritime unions maintain crew refusal rights for transit through designated high-risk zones, potentially preventing vessel movements even when owners and charterers prefer to maintain operations. These labour considerations can extend supply disruptions beyond the duration of actual military activities.
Port operation dependencies add additional complexity layers. Major loading terminals in the Persian Gulf require extensive coordination between offshore platforms, pipeline networks, storage facilities, and vessel berthing systems. Security concerns at any point in this chain can halt operations entirely, creating supply bottlenecks that take weeks to clear even after underlying security issues resolve.
Strategic Response Mechanisms of Major Consuming Nations
Government responses to energy supply disruptions operate through multiple policy channels, each with distinct implementation timelines and effectiveness characteristics. The coordination challenges between different national approaches often create additional market uncertainty, particularly when major consuming nations pursue conflicting strategies.
Strategic Petroleum Reserve deployment represents the most direct government intervention tool, though effectiveness depends heavily on timing, volume, and coordination between participating nations. The International Energy Agency coordinates emergency response mechanisms among member countries, but deployment decisions remain subject to domestic political considerations that can delay or limit response effectiveness.
Emergency Stockpile Release Coordination
Historical strategic reserve releases and market impact:
-
2022 Russian invasion response: 180 million barrels coordinated release over 6 months
-
2011 Libya crisis response: 60 million barrels released over 30 days
-
2005 Hurricane Katrina response: 30 million barrels emergency loan programme
-
1991 Gulf War response: 33.75 million barrels coordinated international release
-
2000 heating oil crisis response: 30 million barrels heating oil reserve release
Market effectiveness varies significantly based on disruption characteristics and release coordination. During supply disruptions affecting 5-10 per cent of global supplies, strategic reserve releases can successfully stabilise markets within 30-60 days. However, disruptions exceeding 15-20 per cent of global supply often overwhelm available strategic stockpiles, requiring alternative policy responses.
Group of Seven coordination mechanisms provide frameworks for multilateral responses, though implementation faces challenges from differing national energy dependencies and political constraints. The March 2026 G7 request for IEA emergency scenario preparation demonstrates proactive policy coordination. Nevertheless, actual deployment requires individual nation approval processes that can introduce delays during rapidly evolving crises.
Naval escort operations represent the most direct military response option, but effectiveness depends on several critical factors. Escort missions require substantial naval resources, create potential for military escalation, and face legal complexities regarding commercial vessel protection in international waters. The conflicting signals from U.S. officials during March 2026 illustrate how communication coordination challenges can amplify market uncertainty even when intervention capabilities exist.
Alternative Supply Chain Adaptation Mechanisms
Energy supply chains demonstrate remarkable adaptability when faced with transportation disruptions, though adjustment processes require substantial time and create significant cost increases. Alternative routing, storage optimisation, and production reallocation all provide supply chain resilience, but each mechanism operates with distinct constraints and implementation timelines.
Floating Storage Economics During Transit Disruptions
Floating storage becomes economically viable when transportation disruptions create sufficient price premiums between different delivery locations or time periods. The decision to employ floating storage involves complex calculations incorporating charter rates, storage costs, insurance premiums, and price spread expectations across multiple time horizons.
Key profitability factors for floating storage deployment:
• Contango spread magnitude: Difference between prompt and forward month prices
• Charter rate availability: Cost of securing suitable Very Large Crude Carriers (VLCCs)
• Insurance premium increases: Additional costs for offshore storage coverage
• Opportunity cost calculations: Alternative employment for storage vessels
• Operational flexibility: Ability to discharge cargo when favourable conditions emerge
During the March 2026 disruption, floating storage utilisation increased by approximately 40 per cent as traders sought to capitalise on elevated price spreads and supply timing uncertainty. This represented roughly 25 million barrels of additional crude oil stored aboard tankers awaiting favourable market conditions or transit route normalisation.
Regional refinery capacity utilisation patterns shift dramatically during supply disruptions as operators adjust crude slate compositions and product yield optimisation. Refineries with greater operational flexibility can process alternative crude grades delivered through different supply routes. However, efficiency losses and product quality adjustments typically reduce overall throughput by 5-15 per cent.
Forward Market Pricing of Extended Disruption Scenarios
Energy futures markets provide sophisticated mechanisms for pricing disruption duration expectations and uncertainty premiums across different time horizons. Forward curve analysis during geopolitical stress reveals how traders assess probability-weighted outcomes for various resolution scenarios. However, extreme volatility can distort normal price discovery mechanisms.
Is Market Structure Indicating Long-Term Disruption Expectations?
Normal market conditions typically produce either contango structures (where forward prices exceed spot prices) reflecting storage costs and interest rates, or backwardation structures (where spot prices exceed forward prices) reflecting supply tightness or convenience yield premiums. During major supply disruptions, these relationships can invert rapidly as traders reassess supply availability across different delivery periods.
The March 2026 period demonstrated how uncertainty in Strait of Hormuz tanker traffic creates complex forward curve dynamics. Front-month contracts traded at substantial premiums to six-month forward contracts as traders priced immediate supply availability concerns while expecting eventual resolution of transportation disruptions. This backwardation structure reflected market assessment that current supply constraints would resolve within six months. Nevertheless, substantial uncertainty premiums remained embedded across the entire forward curve.
Historical price movements during major chokepoint disruptions:
| Disruption Event | Peak Price Increase | Duration | Recovery Timeline | Market Structure Impact |
|---|---|---|---|---|
| Iran-Iraq War (1980-1988) | +150% | 8 years | 24 months post-conflict | Persistent backwardation |
| Gulf War (1990-1991) | +78% | 7 months | 6 months | Sharp contango reversal |
| 2019 Strait Threats | +15% | 3 months | 2 months | Limited curve impact |
| March 2026 Crisis | +40% YTD | Ongoing | TBD | Steep backwardation |
Options market analysis provides additional insight into trader expectations about volatility persistence and directional bias. Implied volatility surfaces during the March 2026 period showed elevated premiums for both call and put options. This indicates traders expected continued large price movements in either direction rather than gradual stabilisation toward equilibrium levels.
The next major ASX story will hit our subscribers first
Macroeconomic Transmission and Sectoral Impacts
Energy price volatility transmits through economic systems via multiple channels, affecting inflation expectations, currency valuations, corporate cost structures, and consumer spending patterns. The magnitude and persistence of these effects depend on both the scale of energy price changes and broader economic conditions prevailing during disruption periods.
Manufacturing and Transportation Sector Adjustments
Energy-intensive industries face immediate margin pressure during supply disruption periods, though adjustment mechanisms vary significantly across sectors. Chemical manufacturing, aluminium production, and steel fabrication typically operate with energy costs representing 15-30 per cent of total production expenses. This makes these industries highly sensitive to petroleum price volatility.
Transportation fuel availability cascades through supply chains as logistics costs increase and delivery schedules face disruption. Long-haul trucking operations, maritime shipping beyond the immediate disruption zone, and aviation fuel markets all experience secondary effects. This occurs as energy price increases and supply uncertainty affect operational planning.
Economic sectors most vulnerable to energy supply disruptions:
• Petrochemical manufacturing: Direct feedstock dependency and high energy intensity
• Aviation industry: Jet fuel costs and route optimisation challenges
• Agriculture: Fertiliser costs and equipment operation expenses
• Tourism and hospitality: Transportation cost increases affecting travel demand
• Manufacturing exports: Competitiveness impacts from higher energy costs
Central bank policy responses face complex trade-offs between supporting economic growth and managing inflation expectations. Energy price increases create cost-push inflation pressure. However, monetary policy tightening during supply disruptions can exacerbate economic contraction without addressing underlying supply constraints.
Risk Management Strategies Across Market Participants
Different categories of market participants employ distinct approaches to managing energy supply disruption risks, reflecting their underlying business models, regulatory constraints, and risk tolerance levels. Understanding these varied strategies provides insight into how markets aggregate individual responses into overall price discovery and supply allocation mechanisms.
Corporate Hedging Approaches During Supply Uncertainty
Integrated oil companies typically maintain sophisticated hedging programmes that adjust dynamically based on geopolitical risk assessments. These programmes employ combinations of financial derivatives, physical supply agreements, and operational flexibility to manage exposure to price volatility and supply disruptions.
Independent refiners face particularly complex risk management challenges during supply disruptions, as they must simultaneously manage crude oil procurement costs, product pricing, and operational flexibility. This occurs without the upstream production hedges available to integrated companies. Many refiners employ crack spread hedging strategies that lock in processing margins. However, these strategies become less effective when crude supply disruptions create unusual pricing relationships between different petroleum products.
Airlines and other large fuel consumers often maintain emergency fuel procurement agreements and storage capacity to manage short-term supply disruptions. Nevertheless, extended disruptions can overwhelm these contingency measures. The March 2026 period saw several major airlines activate alternative fuel supply agreements and adjust flight routing to minimise exposure to elevated jet fuel costs.
Investment Portfolio Considerations
Energy-focused investment funds employ various strategies to capitalise on supply disruption scenarios while managing downside risks. Long-only energy equity funds typically see performance improvement during disruption periods as elevated commodity prices boost energy company profitability. However, geopolitical risks can create substantial volatility in individual security performance.
Commodity trading advisors and hedge funds specialising in energy markets often employ trend-following and volatility strategies designed to profit from the extreme price movements characteristic of supply disruption periods. Nevertheless, the rapid reversals observed during March 2026 created challenges for momentum-based strategies as directional trends shifted within single trading sessions.
In addition, understanding the broader implications requires analysis of related market factors. The OPEC production impact on global supply stability becomes particularly relevant during regional disruptions. Furthermore, examining US oil production decline patterns helps traders assess alternative supply capacity during chokepoint uncertainties.
Technology Solutions and Infrastructure Development
Long-term adaptation to recurring supply disruption risks drives investment in alternative infrastructure, monitoring technology, and supply chain diversification strategies. These developments operate over multi-year timeframes but create structural changes that reduce future vulnerability to chokepoint disruptions.
Alternative Pipeline Development Economics
Major pipeline projects require 5-15 year development timelines and multi-billion dollar capital investments, making economic justification heavily dependent on long-term supply security assessments. Recent supply disruptions have accelerated planning for several alternative routing projects. However, regulatory approval processes and financing arrangements remain complex.
The proposed India-Middle East-Europe Economic Corridor includes pipeline components designed to reduce dependence on Suez Canal routing for energy supplies between the Middle East and European markets. Similar projects connecting Central Asian production to Asian markets via routes bypassing traditional chokepoints face technical challenges and geopolitical coordination requirements.
Maritime security monitoring technology employs satellite tracking, automated identification systems, and artificial intelligence analysis to provide real-time assessment of shipping route security conditions. These systems enable more precise risk assessment and dynamic route optimisation. However, effectiveness depends on coordination between commercial operators and security agencies.
For instance, comprehensive oil price crash analysis reveals how multiple factors converge during periods of uncertainty in Strait of Hormuz tanker traffic. Consequently, market participants must develop increasingly sophisticated approaches to navigate these complex risk environments while maintaining operational effectiveness across global energy supply chains.
Disclaimer: This analysis is provided for informational purposes only and does not constitute investment advice. Energy commodity markets involve substantial risk, and past performance does not guarantee future results. Readers should conduct their own research and consult qualified professionals before making investment decisions. Geopolitical developments and supply disruption scenarios involve significant uncertainty, and actual outcomes may differ materially from projections discussed in this analysis.
Looking to Navigate Energy Supply Chain Volatility?
Discovery Alert's proprietary Discovery IQ model delivers real-time alerts on significant ASX mineral discoveries, empowering investors to identify actionable opportunities in energy and commodity sectors ahead of market volatility. Begin your 14-day free trial today and position yourself strategically as global energy dynamics continue evolving.