May 21, 2026
When Energy Systems Fracture: Understanding How the Energy Crisis Is Changing Demand Patterns
Every few decades, the global energy system encounters a stress test severe enough to expose its deepest structural assumptions. The 1970s oil embargo revealed how vulnerable industrialised economies were to concentrated supply chains. The 2021 European gas crisis demonstrated how quickly renewables-heavy grids could become dangerously dependent on a single fuel source. The current disruption is different in character, broader in scope, and more instructive about the true nature of energy demand than almost any prior event.
What makes the energy crisis is changing demand patterns argument so compelling right now is not simply that prices are high. It is that the disruption is occurring simultaneously across crude oil, liquefied natural gas, and regional power markets, compressing years of gradual transition dynamics into months of forced adaptation. The question analysts are now grappling with is whether what we are witnessing represents genuine structural transformation or a pressure-driven deviation that will snap back the moment geopolitical tension eases.
When big ASX news breaks, our subscribers know first
The Scale of the Disruption in Context
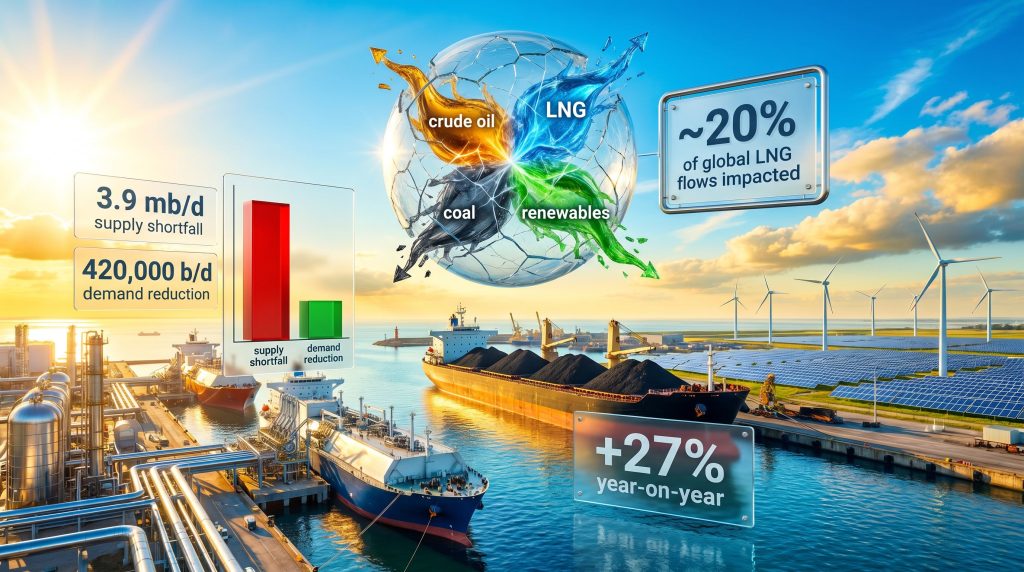
To understand where demand is heading, it helps to first appreciate the scale of what has already been removed from supply. According to the International Energy Agency's May 2026 monthly report, the world's oil supply this year will run approximately 3.9 million barrels per day below 2025 levels, driven primarily by a reduction of more than 10 million barrels per day from Middle Eastern producers following the conflict involving the United States, Israel, and Iran. Cumulative crude supply losses since early March have exceeded 1 billion barrels.
Against this backdrop, the IEA projects that global oil demand will contract by only 420,000 barrels per day, a figure that reveals something fundamental about energy consumption: it resists price signals in the short term far more effectively than most economic models predict. For a broader view of how this fits into the wider LNG supply outlook, the numbers become even more significant.
| Disruption Metric | Reported Magnitude |
|---|---|
| Global LNG flows impacted | ~20% of total global volumes |
| Crude supply losses since March 2026 | Over 1 billion barrels |
| IEA projected annual supply shortfall | 3.9 million barrels per day |
| Middle Eastern production decline | Over 10 million barrels per day |
| Projected global oil demand reduction | ~420,000 barrels per day |
| Coal shipment surge (South Korea, Japan, EU) | +27% year-on-year, March to April 2026 |
The asymmetry between a 3.9 million barrel per day supply loss and a 420,000 barrel per day demand reduction is not a statistical anomaly. It reflects a structural truth: essential energy consumption is deeply inelastic in the short term, regardless of how extreme price signals become.
How Energy Demand Actually Shifts: Four Mechanisms
Understanding the way in which the energy crisis is changing demand patterns requires moving beyond price charts and into the mechanics of how demand actually evolves. There are four distinct pathways:
-
Price-induced conservation occurs when elevated costs push consumers and businesses to voluntarily reduce usage, delaying trips, dimming facilities, or curtailing production runs.
-
Fuel substitution happens when high-cost fuels are replaced with whatever is available at competitive prices, irrespective of environmental preferences. This is currently manifesting most visibly in coal's resurgence across Asia and Europe.
-
Technology acceleration describes how crisis conditions compress the adoption timelines for alternatives like electric vehicles and rooftop solar, as the relative economics shift sharply.
-
Policy intervention introduces mandates, storage obligations, and efficiency standards that can outlast the crisis itself, making policy frameworks potentially more durable in reshaping demand than market prices alone.
These mechanisms operate simultaneously but at different speeds and across different sectors, which is why the current demand picture looks so contradictory from the outside. Furthermore, understanding how energy transition pressures interact with these mechanisms is essential for any complete analysis.
The Coal Paradox: An Inconvenient Resurgence
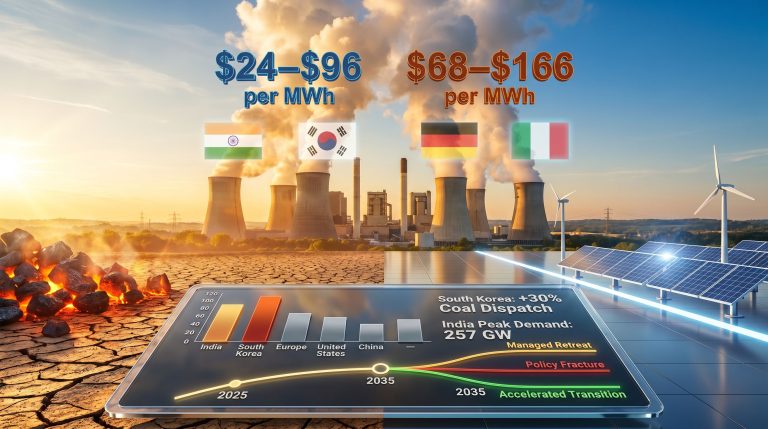
Perhaps the most revealing aspect of the current crisis is the simultaneous rise in both electric vehicle sales and coal consumption. BIMCO, the world's largest shipowners' association, confirmed that coal shipments to South Korea, Japan, and the European Union surged 27% year-on-year across March and April 2026. This occurred primarily because Qatar, one of the three largest LNG exporters globally, suspended the majority of its export capacity, forcing Asian economies that had invested heavily in gas-dependent power infrastructure to reach for the most available dispatchable alternative.
China's situation adds another layer of complexity. Coal output from Chinese mines has slipped while imports have simultaneously declined, yet domestic combustion has increased as wind and nuclear output fell short. This is a critical insight for anyone observing the energy transition: even economies with some of the largest renewable portfolios in the world have not engineered their grids to function without a coal backstop when weather patterns or geopolitical factors reduce output from preferred sources.
Coal is not resurging because energy planners want it to. It is resurging because grid infrastructure, storage technology, and fuel flexibility have not yet advanced to the point where it can be safely removed from the system. This is the gap that transition advocates consistently underestimate.
Electric Vehicles and Solar: Genuine Momentum or a Price Mirage?
European EV sales have risen substantially since February 2026, and demand for rooftop solar installations has increased across multiple markets, particularly in Europe where elevated electricity costs are making the investment case more immediate. The IEA confirmed in May 2026 that the oil price shock has contributed to a measurable surge in EV consideration and sales activity across the continent. In addition, the broader shift toward renewable energy solutions is accelerating in certain regions as a direct consequence of these pressures.
Yet the durability of this trend is far from assured. Bob McNally, founder of Rapidan Energy Group and a former White House energy adviser, argued in a May 2026 interview with Fortune magazine that the optimism surrounding this shift may be overstated. His analysis drew on the historical relationship between oil price cycles and EV adoption rates, noting that demand for electrified transport consistently weakens when fuel prices normalise, suggesting the current surge reflects price-driven behaviour rather than a permanent reorientation of consumer preference.
India's solar sector adds a structural warning to this picture. The country's solar industry association called in May 2026 for the government to raise its electricity price cap, arguing that regulated pricing is suppressing investment returns to a degree that is actively slowing deployment. European wind and solar lobby groups have made parallel arguments, pointing to a widening gap between the clean energy cost narrative and the commercial reality of operating in markets where price controls limit profitability.
| Indicator | Current Trend | Key Caveat |
|---|---|---|
| European EV sales | Substantially higher since February 2026 | Historically reverses when oil prices fall |
| Rooftop solar demand | Elevated across multiple markets | Constrained by price caps in key markets |
| Utility-scale solar investment | Rising in selected regions | Lobby groups seeking higher price floors |
| Coal consumption | Surging across Asia and Europe | Directly contradicts the clean energy narrative |
| EV subsidy dependency | Persistently high | Government budgets under fiscal pressure |
The Policy Hierarchy: What Crises Reveal About Government Priorities
One of the most analytically significant developments of the current crisis has been the European Union's decision to suspend its methane directive in order to preserve affordable access to LNG imports from the United States. The directive, which was designed to impose methane emission limits across the LNG supply chain, was subordinated to energy security and affordability the moment those priorities came under genuine pressure. Consequently, this reflects a pattern that the LSE Grantham Institute's analysis of energy crisis impacts has documented across multiple historical cycles.
This is not an isolated occurrence. Across every major energy crisis of the past half century, the hierarchy of government priorities has followed a consistent pattern: affordability and supply security emerge first, decarbonisation commitments follow when conditions allow. Recognising this hierarchy is essential to assessing how durable any crisis-era demand shift is likely to be.
The Woodside CEO's public assessment, reported across multiple outlets in May 2026, that markets are significantly underestimating the depth of the LNG supply shock, adds a forward dimension to this analysis. If current price signals do not fully reflect forward supply risk, the eventual price discovery event could be sharper and more disruptive than consensus forecasts currently suggest.
The next major ASX story will hit our subscribers first
What Happens When the Crisis Ends: Three Scenarios
The IEA's demand projections implicitly assume that Middle Eastern production resumes before year-end. If that assumption holds, the post-crisis trajectory for demand patterns becomes considerably more predictable. Ellen Wald, Senior Fellow at the Atlantic Council's Global Energy Centre, has warned that inventory drawdowns are creating a deferred collision point: once stockpiles are exhausted, the price spike will be acute and rapid rather than gradual. This introduces timing risk that is not fully captured in current forward curves.
Three distinct post-crisis scenarios emerge from the analytical framework:
| Scenario | Primary Trigger | Likely Demand Outcome |
|---|---|---|
| Full reversal | Rapid price normalisation, subsidy exhaustion | Oil and gas demand rebounds; EV and solar growth stalls |
| Partial persistence | Policy frameworks retained despite lower prices | Efficiency gains locked in; fossil demand partially recovers |
| Structural acceleration | Crisis triggers sustained capital reallocation | Permanent shift toward diversified energy mix |
Historical evidence most strongly supports the partial persistence scenario. Energy crises reliably produce lasting efficiency improvements in buildings, industrial processes, and transport infrastructure because the investment decisions are made at the point of maximum cost pressure and the physical improvements retain their value regardless of subsequent price moves.
Distributed energy assets like rooftop solar also tend to persist because the economic case rests on long-term bill reduction rather than day-to-day price comparisons. What does not tend to persist is the pace of large-scale technology adoption. EV purchase decisions in price-sensitive markets correlate strongly with the relative cost of operating a petrol-powered vehicle, and that calculation changes materially when crude prices decline by 30 to 40 percent from crisis peaks.
Regional Divergence: Why Geography Matters in Demand Analysis
Europe
Europe has implemented conservation mandates and reinforced gas storage obligations, producing measurable demand reduction. Simultaneously, it has suspended methane regulations to preserve import viability. EV adoption is rising on the back of both policy support and elevated pump prices. The tension between these two impulses reveals a continent navigating genuine competing priorities rather than executing a coherent transition strategy.
Asia
Asia presents an entirely different picture. LNG-dependent economies including South Korea and Japan have deepened bilateral energy cooperation in response to Qatari export disruptions, while simultaneously pivoting toward coal rather than renewable alternatives. Japan and South Korea's deepening oil and energy ties, widely reported in late May 2026, reflect the practical reality that grid infrastructure in the region is not yet flexible enough to absorb sudden fuel switching toward intermittent sources.
India's situation is particularly instructive. The country curtailed approximately 300 gigawatt-hours of clean energy in the first quarter of 2026 because grid infrastructure could not accommodate the output from rapidly expanding solar capacity. This dynamic illustrates a systemic barrier that the crisis has exposed rather than resolved: the limiting factor for renewables in key growth markets is not always capital or policy, but physical grid infrastructure. In this context, the growth of critical minerals demand is becoming ever more central to the speed of any genuine transition.
The United States
The United States faces a different set of pressures. Crude inventories have fallen sharply in recent weeks but remain above year-earlier levels, providing a partial buffer against acute demand destruction. Tracking crude oil price trends over recent months reveals just how volatile the environment has become for domestic producers and policymakers alike.
Domestic LNG exporters are simultaneously navigating European demand pull and methane regulation compliance costs, with the EU's temporary suspension of the methane directive offering a partial reprieve. The Federal Reserve is contending with an inflation environment in which elevated energy prices are contributing to broader price pressures, complicating monetary policy at a moment of significant macro uncertainty.
The Long View: Why Energy Systems Resist Rapid Transformation
There is a structural reason why the energy crisis is changing demand patterns in ways that appear more dramatic in real time than they ultimately prove to be in retrospect. The global energy system is built around infrastructure with capital cycles measured in decades: pipelines, refineries, port terminals, power grids, and vehicle fleets are not replaced in response to a twelve-month price shock. The turnover rate of the capital stock embedded in fossil fuel consumption is simply too slow to reflect price signals that might last one to three years.
This creates an important distinction between apparent demand shifts, which are driven by price and are temporary, and structural demand shifts, which require changes in the underlying physical and institutional infrastructure that governs how energy is produced, transmitted, and consumed. Research published in Energy Policy reinforces this distinction, highlighting how deeply embedded infrastructure continues to shape consumption patterns long after crisis conditions subside.
The most durable legacy of any energy crisis is typically found in three areas:
-
Energy efficiency standards embedded in building codes, appliance regulations, and industrial process requirements that persist long after prices fall.
-
Distributed generation assets including rooftop solar and behind-the-meter storage, where investment decisions are made at the household or business level and are not easily reversed.
-
Grid infrastructure investment that is accelerated by crisis conditions and creates lasting changes in how power systems are designed and operated.
What does not typically persist is the headline rate of technology adoption or the political consensus around aggressive decarbonisation mandates, both of which tend to soften when affordability returns to the foreground of public discourse.
Disclaimer: This article is for informational and educational purposes only and does not constitute investment, financial, or energy policy advice. Projections, forecasts, and scenario analyses contained herein are speculative in nature and subject to material uncertainty. Readers should conduct their own due diligence before making any investment or operational decisions.
Want To Identify ASX Mineral Discoveries Before the Broader Market Does?
Discovery Alert's proprietary Discovery IQ model delivers real-time alerts on significant ASX mineral discoveries, turning complex mineral data into actionable insights for both short-term traders and long-term investors — explore the historic returns major discoveries have generated and begin a 14-day free trial at Discovery Alert to position yourself ahead of the market.