July 12, 2026

Understanding the Macroeconomic Framework of Energy-Driven Inflation
Modern economies face unprecedented vulnerabilities as geopolitical tensions reshape global energy markets. The iran war impacts on energy markets demonstrate how contemporary conflicts create cascading effects that penetrate every layer of economic activity. Unlike traditional economic shocks that emerge from financial institutions or technological disruptions, energy-driven inflation creates unique challenges that distinguish it from historical precedents, fundamentally altering how policymakers and investors must approach risk assessment.
What Makes This Energy Crisis Different From Previous Oil Shocks?
The structural differences between current energy market dynamics and historical oil crises reveal critical vulnerabilities in global economic resilience. During the 1970s oil embargo, OPEC reduced global oil supply by approximately 7%, causing prices to surge from $3 to $12 per barrel, representing a 300% increase. This shock triggered global inflation averaging 8-12% across OECD nations in 1974, according to OECD Economic Outlook historical data.
The 2011 Arab Spring period offers a more recent comparison point. Brent crude averaged approximately $110 per barrel over 2011-2014, which translates to roughly $145 per barrel in inflation-adjusted 2024 dollars based on U.S. Bureau of Labor Statistics CPI adjustments. Despite these elevated prices, U.S. GDP growth averaged 2.1% during this period, demonstrating remarkable economic resilience.
Key Economic Resilience Factors from 2011-2014:
• Shale production elasticity: U.S. mining sector accounted for 14% of industrial production initially, expanding to generate over 50% of total industrial production growth by 2012-2013
• Investment responsiveness: Higher oil prices triggered substantial increases in drilling activity, production growth, and energy-sector investment
• Manufacturing offset mechanism: Domestic energy boom provided tailwinds that partially offset consumer fuel cost impacts
• Employment generation: Energy sector expansion created jobs and economic activity in oil-producing regions
However, analysis from UBS Economics Research reveals a fundamental structural change. The oil sector demonstrates significantly reduced price elasticity compared to the previous decade. Post-2015 oil price movements failed to restore shale investment intensity to pre-2014 levels, despite subsequent price recoveries. Current production responds to prices through well completions and utilisation gains rather than major investment programs.
This transformation means energy price increases flow directly to consumer purchasing power without the offsetting benefits of domestic energy investment booms. The absence of supply-side economic stimulus during energy price spikes represents a critical vulnerability for consumer-dependent economies.
How Energy Price Volatility Cascades Through Global Supply Chains
Transportation networks serve as the primary transmission mechanism for energy cost increases throughout the global economy. Maritime shipping demonstrates immediate sensitivity, with bunker fuel representing 40-50% of container ship operating costs for long-haul routes, according to World Bank Shipping Data from 2023.
Transportation Cost Multiplication Effects:
| Transportation Mode | Fuel Cost Percentage | Price Pass-Through Timeline | Cost Absorption Capacity |
|---|---|---|---|
| Maritime Shipping | 40-50% | 8 weeks | Minimal |
| Air Freight | 30-35% | 2-4 weeks | None |
| Rail Networks | 5-8% | 3-6 months | Moderate |
| Trucking (For-hire) | 30-40% | 1-2 weeks | Limited |
A $10 per barrel oil price increase typically correlates with 3-5% increases in containerised shipping rates within eight weeks. For major trade routes, this translates to substantial cost variations. Asia-Europe routes using 20,000-TEU vessels consuming approximately 50,000 gallons of bunker fuel daily experience cost swings from $8,400 per day at $50 per barrel to $21,000 daily at $125 per barrel.
Air freight networks demonstrate even more immediate transmission. Airlines pass 80-100% of fuel surcharges to customers within 2-4 weeks, as jet fuel represents 30-35% of operating costs for cargo airlines according to IATA data. This rapid pass-through occurs because aviation lacks fuel substitution alternatives.
Rail transportation offers more resilience due to lower fuel cost percentages. North American Class I railroads allocate only 5-8% of operating expenses to fuel costs, enabling temporary cost absorption for 3-6 months before rate adjustments. However, this advantage diminishes during extended energy price elevation.
The trucking sector experiences immediate pressure, particularly among independent owner-operators who lack organisational capacity to absorb costs. Less-than-truckload carriers typically implement fuel surcharge adjustments within 1-2 weeks through established fuel surcharge indices.
Manufacturing Input Cost Pressures Affecting Petrochemical-Dependent Industries
Manufacturing sectors exhibit inverse relationships between production scale and energy cost vulnerability. Large-volume commodity producers demonstrate near-immediate price pass-through due to international commodity pricing mechanisms, while specialised manufacturers can sustain short-term margin compression.
Petrochemical Dependency Analysis by Industry:
Fertiliser Production represents the most energy-intensive manufacturing sector. Ammonia production via the Haber-Bosch process consumes 1.5-2.0 MWh of natural gas per ton, with natural gas representing 70-90% of production costs. During the 2011 energy spike, ammonia prices increased 180-220% year-on-year according to USDA data. Global ammonia production of approximately 180 million metric tons annually demonstrates 70% energy cost-driven pricing sensitivity.
Plastics Manufacturing shows 90-95% correlation between virgin polyethylene and polypropylene feedstock costs and crude oil prices. During 2011-2012, crude oil prices of $110-125 per barrel triggered 35-45% increases in virgin plastic feedstock costs. Since conversion costs remain relatively fixed, feedstock increases flow directly to end-product pricing.
Synthetic Textiles depend on petroleum-derived monomers for polyester, nylon, and acrylic production. The 2011 energy shock increased synthetic textile production costs by 25-35%, though retail pass-through reached only 12-18% due to competition from natural fibres. Consumer demand temporarily shifted toward cotton, demonstrating substitution behaviour despite 25-40% higher costs.
Pharmaceutical Manufacturing remains relatively insulated from crude oil spikes, as petroleum represents only 20-30% of input costs. However, petroleum-derived solvents including ethanol, acetone, and methylene chloride typically experience 15-20% price increases during energy shocks. Manufacturing delays often prove more damaging than cost increases in pharmaceutical supply chains.
Cost Propagation Timeline Analysis:
-
Immediate Response (0-2 weeks): Commodity chemical prices for ammonia, ethylene, and propylene adjust daily based on energy inputs
-
Short-term Adjustment (2-8 weeks): Intermediate products including fertilisers and plastic pellets undergo repricing
-
Medium-term Impact (8-16 weeks): End products such as packaged fertilisers, plastic goods, and textiles implement price adjustments
-
Extended Effects (16-32 weeks): Consumer goods incorporating plastic and textile inputs, including food packaging, apparel, and automotive components, reflect energy cost increases
When big ASX news breaks, our subscribers know first
Regional Economic Vulnerability Assessment
Global economic exposure to Middle Eastern energy disruption varies significantly by region, creating asymmetric impacts during supply shocks. Energy import dependency serves as the primary determinant of economic vulnerability, though domestic production capacity and strategic reserve availability provide important mitigating factors.
Economic Vulnerability Assessment by Region:
European Union faces critical vulnerability with 65% oil import dependency and 83% gas import dependency from external sources. Limited domestic production capacity and high industrial energy consumption create immediate economic exposure during supply disruptions. Furthermore, strategic petroleum reserves provide temporary buffer capacity but insufficient coverage for extended disruptions. The middle east conflicts affecting energy markets highlight these vulnerabilities particularly starkly.
East Asia demonstrates the highest vulnerability profile, with 85% oil import dependency and 75% gas import dependency. Major economies including Japan, South Korea, and Taiwan lack significant domestic energy production, creating critical supply chain dependencies. However, these economies maintain substantial strategic reserves and diversified supplier relationships.
North America shows the lowest vulnerability with only 15% oil import dependency and net exporter status for natural gas. Substantial shale production capacity provides domestic supply security, though reduced investment elasticity compared to previous decades limits rapid production scaling during price spikes.
South Asia faces critical exposure with 90% oil import dependency and 65% gas import dependency. Rapid economic growth increases energy demand while limited strategic reserve capacity creates vulnerability to supply disruptions. Consequently, currency depreciation during energy price spikes amplifies domestic economic impacts. The iran war impacts on energy markets are particularly pronounced in this region due to geographic proximity and trade relationships.
How Different Economic Sectors Respond to Energy Price Shocks
Energy-intensive manufacturing experiences immediate margin compression due to direct fuel and feedstock costs. Aluminium smelting, steel production, and cement manufacturing demonstrate high energy cost sensitivity, typically passing 60-80% of energy cost increases to customers within 12-16 weeks.
Consumer discretionary spending shows delayed but significant contraction as household energy costs increase. Historical analysis indicates 3-6 month lag periods before discretionary spending adjustments, with 15-25% reduction in non-essential purchases during sustained energy price elevation.
Transportation and logistics sectors face immediate operational cost increases with limited absorption capacity. Maritime shipping, aviation, and trucking demonstrate rapid cost pass-through to customers, creating inflationary pressures throughout supply chains.
Monetary Policy Implications and Central Bank Responses
Central banks confront complex challenges when addressing supply-side inflation driven by energy price shocks. Traditional monetary tools designed for demand-side inflation prove inadequate and potentially counterproductive when applied to supply-driven price increases.
Why Traditional Monetary Tools May Prove Inadequate During Energy-Driven Inflation
Interest Rate Limitations: Increasing interest rates cannot directly address supply constraints or geopolitical energy disruptions. Rate increases risk triggering demand destruction across broader economic sectors while failing to moderate energy prices determined by global supply-demand fundamentals.
Inflation Targeting Challenges: Central bank inflation targets typically exclude energy and food prices due to volatility. However, sustained energy price elevation eventually transmits to core inflation through transportation costs, manufacturing inputs, and wage pressures. In addition, the tariff and inflation challenges compound these difficulties for monetary authorities.
Economic Growth Trade-offs: Aggressive monetary tightening to combat energy-driven inflation risks precipitating economic recession while energy prices remain elevated. This creates stagflationary conditions particularly challenging for monetary policy implementation.
Strategic Reserve Deployment and Government Intervention Mechanisms
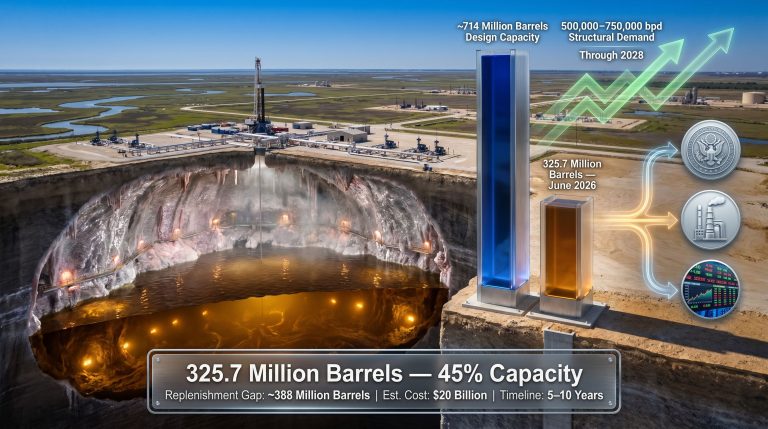
Coordinated Reserve Releases from International Energy Agency member nations provide temporary supply augmentation. The United States Strategic Petroleum Reserve contains approximately 350-400 million barrels, offering 35-40 days of total oil import replacement. However, reserve deployments address symptoms rather than underlying supply constraints.
Fuel Subsidy Programs protect consumer purchasing power through government expenditure. European nations implemented emergency fuel subsidies during previous energy crises, though these programs create fiscal pressures and potential market distortions. Subsidy effectiveness depends on government fiscal capacity and program duration.
Emergency Shipping Insurance backed by government guarantees maintains maritime trade flows during geopolitical tensions. When commercial insurers withdraw coverage for high-risk shipping routes, government-backed insurance programs prevent complete trade disruption.
Financial Market Stress Indicators and Credit Market Implications
Energy price volatility creates cascading effects throughout financial markets, with credit markets serving as primary transmission mechanisms for broader economic stress. Corporate credit markets demonstrate particular sensitivity to energy-dependent sector vulnerabilities.
How Energy Price Volatility Affects Corporate Credit Markets
Airlines and Transportation Companies face immediate cash flow pressures due to high fuel cost exposure. Historical analysis shows airline industry credit spreads widening 200-400 basis points during sustained energy price spikes. Fuel hedging programs provide temporary protection, though hedging costs increase substantially during volatile periods.
Energy-intensive Manufacturers experience working capital constraints as input costs rise faster than customer payment cycles. Chemical companies, aluminium producers, and steel manufacturers demonstrate credit rating pressure during extended energy price elevation. Bank lending standards typically tighten for these sectors within 8-12 weeks of energy shock onset.
Emerging Market Economies with high energy import dependencies face currency devaluation and sovereign credit pressure. Energy price increases create current account deficits while currency weakness amplifies domestic energy costs, creating feedback loops that stress government finances and corporate borrowers.
What Credit Market Signals Indicate Broader Economic Stress
High-yield Bond Spreads serve as leading indicators of broader credit stress. Energy-dependent sectors typically experience spread widening before broader high-yield market deterioration. Spreads exceeding 600-800 basis points historically precede broader economic stress periods.
Bank Lending Standard Surveys reveal tightening credit availability before economic downturns. Energy-exposed sectors experience initial tightening, followed by broader lending standard increases if energy price shocks persist beyond 6-8 months.
Corporate Refinancing Costs increase across multiple industries as energy uncertainty affects investor risk assessment. Investment-grade corporate bond spreads typically widen 50-100 basis points during sustained energy market volatility.
Supply Chain Resilience and Alternative Energy Infrastructure
Modern supply networks demonstrate both greater efficiency and increased vulnerability compared to previous decades. Just-in-time inventory management and global sourcing strategies amplify energy disruption impacts while reducing system-wide resilience.
How Global Supply Networks Adapt to Persistent Energy Disruption
Route Diversification becomes critical as traditional shipping lanes face disruption. Alternative routing through longer but more secure pathways increases transportation costs by 15-30% while extending delivery timelines. Supply chain managers implement contingency routing plans, though limited alternative capacity constrains flexibility.
Inventory Strategy Modifications shift from just-in-time to strategic stockpiling models. Companies increase inventory levels for critical components, requiring additional working capital and warehouse capacity. Inventory carrying costs rise, but supply security improves during disruption periods.
Regional Supplier Development reduces dependence on distant suppliers vulnerable to energy-dependent transportation. However, regional sourcing often involves higher unit costs and limited production capacity, creating trade-offs between supply security and cost efficiency.
Why Renewable Energy Transition Gains Economic Urgency
Energy Security Considerations drive accelerated clean energy investment as geopolitical risks highlight fossil fuel vulnerabilities. Grid-scale renewable energy reduces import dependency while providing price stability over longer time horizons. However, the renewable energy transition requires substantial upfront investment and grid modernisation.
Industrial Competitiveness increasingly depends on energy cost predictability rather than absolute costs. Industries with access to stable, renewable energy sources gain competitive advantages over those dependent on volatile fossil fuel markets. This creates economic incentives for renewable energy adoption beyond environmental considerations.
Grid Stability Requirements necessitate diverse energy portfolio development including storage systems and demand management technologies. Investment in grid resilience becomes critical for economic stability during energy market disruption periods.
Long-Term Economic Structural Changes
Prolonged energy market disruption typically catalyses permanent shifts in economic structure and international trade relationships. These changes often persist long after initial energy shocks resolve, reshaping global economic patterns.
What Permanent Shifts May Result From Prolonged Energy Market Disruption
Accelerated Manufacturing Reshoring reduces supply chain vulnerability through domestic production expansion. Companies relocate production closer to end markets, accepting higher labour costs in exchange for supply security. This trend particularly affects electronics, pharmaceuticals, and automotive industries.
Strategic Commodity Stockpiling becomes standard business practice rather than exceptional crisis response. Governments and corporations maintain larger strategic reserves for critical materials, requiring substantial capital allocation and storage infrastructure investment.
Enhanced Alternative Energy Infrastructure receives accelerated investment as energy security becomes paramount. Solar, wind, nuclear, and energy storage systems gain priority in capital allocation decisions, potentially reshaping global energy markets permanently.
How Energy Security Becomes Central to Economic Policy Planning
National Energy Independence strategies influence trade policy, investment decisions, and international relationships. Countries prioritise domestic energy production and processing capabilities, even at higher costs, to reduce geopolitical vulnerability.
Infrastructure Investment Programs focus on energy security rather than purely economic returns. Strategic pipelines, alternative transportation routes, and domestic processing facilities receive government support as national security priorities.
International Partnership Rebalancing shifts toward energy-secure suppliers and strategic allies. Trade relationships incorporate energy security considerations alongside traditional economic factors, potentially fragmenting global trade networks. The US‑China trade war effects demonstrate how such considerations reshape international commerce.
The next major ASX story will hit our subscribers first
Investment Strategy Implications During Energy Market Volatility
Energy market disruption creates both risks and opportunities across asset classes, requiring strategic portfolio adjustments to navigate volatile conditions while capturing potential returns from structural changes.
Which Asset Classes Benefit From Energy-Driven Economic Uncertainty
Energy Sector Equities experience mixed performance based on operational geography and supply chain exposure. Domestic energy producers in politically stable regions typically outperform, while companies with Middle Eastern operations or high transportation costs face pressure. Refining companies often benefit from higher crack spreads during supply disruptions.
Commodity-Linked Investments provide inflation hedging characteristics during energy price spikes. Broad commodity indices typically outperform during energy-driven inflation periods, though storage costs and contango effects can erode returns in futures-based products.
Infrastructure Assets with energy storage, alternative energy generation, or strategic transportation capacity gain value during supply disruptions. Pipeline companies, renewable energy projects, and strategic storage facilities often trade at premiums during energy security concerns.
Real Assets including precious metals, real estate, and farmland historically provide inflation protection during energy-driven price increases. However, energy-intensive real assets may underperform due to operating cost pressures.
How Portfolio Diversification Strategies Adapt to Geopolitical Energy Risk
Geographic Diversification beyond traditional market-based approaches incorporates energy security considerations. Investors favour assets in energy-secure regions while reducing exposure to energy-import-dependent economies.
Sector Rotation Strategies emphasise energy-efficient industries while reducing exposure to energy-intensive sectors. Technology companies with low energy consumption often outperform traditional manufacturing during energy price spikes.
Currency Hedging becomes critical for investors with international exposure, as energy-importing countries typically experience currency weakness during supply shocks. Energy-exporting currencies often strengthen, creating opportunities and risks for international portfolios.
Economic Recovery Scenarios and Timeline Projections
Recovery timelines from energy-driven economic disruption depend on multiple interconnected factors, ranging from geopolitical resolution to infrastructure development and policy coordination effectiveness.
What Factors Determine Economic Impact Duration
Conflict Resolution Timeline serves as the primary variable determining recovery speed. Diplomatic breakthrough enabling supply restoration typically allows 3-6 month recovery periods. However, prolonged conflicts requiring alternative supply development extend recovery to 12-24 months.
Infrastructure Damage Assessment affects recovery duration significantly. Temporary supply disruptions resolve quickly once transportation routes reopen. However, damage to production facilities, pipelines, or processing capacity requires 6-18 months for full restoration.
Alternative Supply Development provides medium-term relief but requires substantial time for implementation. New supply agreements, transportation infrastructure, and processing capacity typically require 12-36 months for full deployment.
Policy Coordination Effectiveness determines how efficiently governments and international organisations respond to supply disruptions. Coordinated reserve releases, emergency transportation arrangements, and diplomatic interventions can substantially reduce economic impact duration.
How Different Resolution Scenarios Affect Global Growth Projections
Rapid Resolution Scenario (3-6 months): Quick diplomatic settlement enabling supply restoration typically results in temporary economic disruption with limited lasting effects. Energy prices normalise within 6-12 months, allowing economic growth to resume previous trajectories.
Extended Conflict Scenario (12-18 months): Prolonged supply disruption forces permanent supply chain adjustments and alternative energy development. Economic growth typically slows 1-2 percentage points during adjustment periods, with recovery requiring 18-24 months.
Structural Change Scenario (24+ months): Fundamental shifts in energy supply patterns create permanent economic adjustments. New trade relationships, alternative energy infrastructure, and supply chain configurations emerge, potentially improving long-term economic resilience while requiring substantial adjustment periods.
Moreover, comprehensive oil price rally analysis suggests that resolution timelines depend heavily on broader geopolitical factors and international cooperation frameworks. The global energy market vulnerabilities revealed by current tensions emphasise the importance of strategic planning for various recovery scenarios.
The iran war impacts on energy markets demonstrate how geopolitical tensions translate into broad economic vulnerability through interconnected supply chains, financial markets, and policy responses. Understanding these transmission mechanisms enables better preparation for energy-driven economic disruption while identifying opportunities within structural changes reshaping global energy markets.
Disclaimer: This analysis is for educational purposes only and should not be considered investment advice. Energy market volatility involves substantial risks, and past performance does not guarantee future results. Readers should consult qualified financial advisors before making investment decisions based on energy market analysis.
Ready to Capitalise on Energy Market Volatility?
Energy-driven market disruptions create significant opportunities for investors who can identify companies positioned to benefit from structural economic shifts. Discovery Alert's proprietary Discovery IQ model delivers real-time alerts on significant ASX mineral discoveries, including energy and critical materials sectors, instantly empowering subscribers to identify actionable investment opportunities ahead of broader market recognition during volatile periods.