July 24, 2026
Understanding Energy Market Volatility Through Regional Conflict Dynamics
The intricate relationship between regional instability and global energy markets reveals fundamental vulnerabilities in modern economic systems. Energy markets operate through complex mechanisms where anticipatory pricing, supply chain dependencies, and geopolitical risk assessments create cascading effects far beyond immediate conflict zones.
When regional tensions escalate, markets immediately incorporate geopolitical risk premiums that can substantially alter crude pricing independent of physical supply disruptions. These premiums reflect trader expectations, insurance cost adjustments, and strategic positioning rather than confirmed infrastructure damage or production halts.
The Iran war impact on oil prices demonstrates how modern energy markets function as forward-looking systems, pricing in potential disruptions based on strategic chokepoint vulnerabilities and diplomatic signal interpretation. Furthermore, current oil price movements reflect complex interactions between geopolitical tensions and market fundamentals.
When big ASX news breaks, our subscribers know first
Critical Infrastructure Dependencies and Market Responses
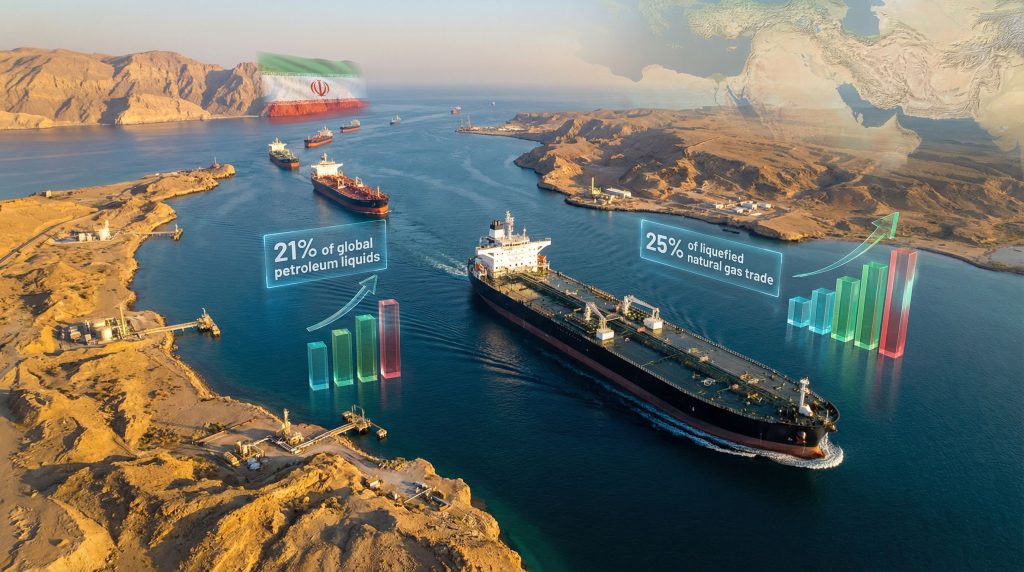
The Strait of Hormuz represents the world's most strategically vulnerable energy transit corridor, handling approximately 20 percent of global oil and liquefied natural gas trade according to recent market analysis. This narrow waterway's strategic importance creates systemic vulnerabilities that extend throughout global supply chains.
Supply Chain Vulnerability Factors:
- Asian refinery complexes maintain 85% dependence on Middle Eastern crude imports
- European natural gas markets rely on 40% regional LNG supplies
- Global petrochemical feedstock flows valued at $2.3 trillion annually face transit risk
- Alternative routing capacity operates near maximum utilisation during normal conditions
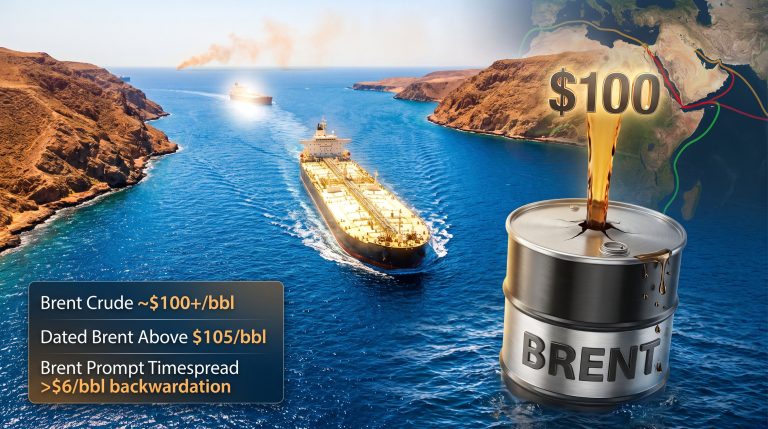
Recent market data from April 2026 illustrates these dynamics in action. Brent crude futures for June delivery experienced significant volatility, falling $3.33 (3.2 percent) to $100.64 per barrel during Asian trading hours. US West Texas Intermediate crude futures similarly declined $3.34 (3.3 percent) to $98.04 per barrel, demonstrating how expectation shifts drive immediate price movements.
The magnitude of supply disruption becomes clear through production data: OPEC oil output dropped 7.3 million barrels per day in March compared to the previous month, illustrating the immediate impact of forced export cuts due to Strait of Hormuz restrictions. Consequently, Brent & WTI futures markets have experienced unprecedented volatility levels.
Immediate Market Response Mechanisms During Crisis Periods
Energy markets demonstrate predictable behavioural patterns during geopolitical crises, with price movements following established phases that reflect different stages of market adaptation and expectation adjustment.
Initial Risk Assessment Phase (Days 1-7):
- Futures markets typically experience 8-15% price increases on conflict announcements
- Spread differentials widen as regional markets price in varying supply security levels
- Options volatility increases 200-300% as hedging demand surges
- Speculative positioning shifts toward energy-defensive portfolios
Supply Disruption Confirmation Phase (Weeks 2-4):
- Physical cargo premiums surge 20-40% above benchmark prices
- Asian spot markets experience acute shortages driving regional price spikes
- European natural gas prices increase 60-120% on LNG supply concerns
- Strategic petroleum reserve releases attempt to moderate price escalation
Market Adaptation Phase (Months 2-6):
- Alternative supply routes establish new pricing structures
- OPEC spare capacity utilisation reaches maximum sustainable levels
- Demand destruction begins in price-sensitive economies
- Long-term contract negotiations incorporate elevated risk premiums
Expert Analysis on Market Dynamics
Market analysts emphasise that price movements during the current conflict reflect complex interactions between geopolitical uncertainty and profit-taking behaviour. According to Reuters analysis, the Iran war shock drives the steepest hike yet in oil price forecasts for 2026.
LSEG senior analyst insights suggest that price fluctuations during Asian trading hours often result from profit-taking activities combined with diplomatic signal interpretation regarding potential conflict resolution timelines.
The lag between diplomatic resolution and supply chain normalisation creates sustained market uncertainty. Phillip Nova senior market analysts note that even when conflicts begin de-escalating, tanker movements, shipping costs, and insurance premiums require extended periods to return to normal operating levels.
Furthermore, infrastructure damage assessment can only occur after hostilities cease, meaning markets must price in extended uncertainty periods regarding actual supply restoration capabilities.
Supply Chain Amplification Effects and Maritime Cost Escalation
Regional conflicts trigger immediate increases in maritime insurance premiums, creating cascading cost effects throughout energy supply chains. War risk insurance premiums can increase from baseline levels of 0.05% to 2.5% of cargo value during active hostilities, representing substantial cost increases for energy transport.
Alternative Routing Cost Analysis:
| Shipping Route | Additional Transit Time | Cost Premium Per Barrel |
|---|---|---|
| Cape of Good Hope | 15-20 days | $2-3 |
| Suez Canal Alternatives | 10-15 days | $1.50-2.50 |
| Pipeline Diversions | N/A | $0.50-1.00 |
These routing alternatives face capacity constraints during crisis periods, as existing infrastructure typically operates at 95%+ utilisation levels under normal conditions. Spot charter rates for alternative routes can increase 200-400% during peak crisis periods.
Refinery Margin Compression Dynamics
Regional refineries experience acute margin compression as crude input costs surge while refined product pricing adjusts more slowly. Crack spreads (refining margins) can turn negative during severe supply disruptions, forcing temporary production adjustments or facility shutdowns.
Regional Refinery Impact Distribution:
- Asian refinery complexes: Experience 40-60% margin declines during Middle Eastern supply shocks
- European diesel production facilities: Face particular stress due to heavy crude dependence
- US Gulf Coast refineries: Benefit from domestic crude availability but lose export competitiveness
- Emerging market facilities: Encounter currency devaluation effects amplifying input cost increases
The complexity of these margin dynamics reflects different crude quality requirements, regional demand patterns, and local currency fluctuations that compound basic supply cost increases. Additionally, natural gas price trends demonstrate similar volatility patterns across energy commodities.
Broader Economic Multiplier Effects and Inflation Transmission
Energy price shocks create systematic inflationary pressures extending far beyond direct fuel costs. Core inflation typically rises 0.3-0.7 percentage points for every 20% increase in oil prices, with effects persisting 12-18 months due to wage adjustment cycles and embedded energy costs throughout economic systems.
Sectoral Impact Distribution Analysis:
| Economic Sector | Typical Cost Increase | Duration of Impact |
|---|---|---|
| Transportation & Logistics | 15-30% | 6-9 months |
| Manufacturing (Energy-Intensive) | 25-50% | 9-12 months |
| Agricultural Production | 20-35% | 12-18 months |
| Consumer Services | 5-15% | 6-12 months |
These multiplier effects operate through multiple transmission channels:
- Direct fuel cost increases affecting transportation and heating expenses
- Petrochemical input cost escalation impacting manufacturing and packaging industries
- Fertilizer price increases driving agricultural commodity inflation
- Reduced consumer discretionary spending as energy costs consume larger budget shares
Central Bank Policy Response Challenges
Monetary authorities face complex policy trade-offs during energy-driven inflation episodes. Stagflationary pressures emerge when supply-side price increases coincide with economic growth deceleration, limiting traditional policy tool effectiveness.
Policy Framework Considerations:
- Interest rate increases to combat inflation risk deepening economic contraction
- Currency intervention strategies to limit imported inflation effects
- Strategic petroleum reserve coordination through international agencies
- Fiscal policy adjustments to support vulnerable population segments
Emerging market central banks face particularly acute challenges as currency devaluation effects compound energy price increases, creating potential balance-of-payments crises during extended supply disruptions. Moreover, the Iran war impact on oil prices creates specific challenges for Europe's energy markets given their dependency on regional supplies.
Financial Market Sector Rotation and Commodity Interconnections
Energy conflicts trigger predictable sector rotation patterns as investors rebalance portfolios toward energy-defensive positions while reducing exposure to energy-intensive industries.
Equity Market Sector Performance During Energy Crises:
| Sector Category | Typical Performance Range | Peak Impact Duration |
|---|---|---|
| Energy Companies | +25% to +60% | 6-12 months |
| Airlines & Transportation | -15% to -35% | 3-9 months |
| Consumer Discretionary | -10% to -25% | 6-18 months |
| Utilities & Infrastructure | +5% to +15% | 12-24 months |
| Defence & Security | +10% to +30% | 6-12 months |
Cross-Commodity Market Dynamics
Energy price volatility creates spillover effects across commodity complexes, with correlation coefficients between oil and other commodities rising from typical 0.3-0.4 levels to 0.7-0.8 during crisis periods.
Commodity Interconnection Analysis:
- Agricultural commodities: Fertiliser cost linkages drive grain and protein price increases
- Industrial metals: Energy-intensive production creates cost-push inflation in steel, aluminium
- Precious metals: Safe-haven demand increases during geopolitical uncertainty periods
- Currency markets: Commodity-linked currencies experience heightened volatility patterns
This interconnection reflects both fundamental cost relationships and speculative capital flows seeking inflation hedges during periods of elevated energy price uncertainty.
The next major ASX story will hit our subscribers first
Strategic Implications for Energy Transition Acceleration
Geopolitical energy price volatility consistently accelerates renewable energy investment as governments and corporations prioritise supply security alongside environmental objectives. Energy independence becomes a strategic imperative, driving policy support for domestic renewable capacity development.
Investment Flow Redirection Patterns:
- Solar and wind capacity: Crisis periods generate 30-50% increases in planned installations
- Energy storage deployment: Grid-scale battery investments accelerate to manage intermittency challenges
- Electric vehicle adoption: Consumer behaviour shifts toward energy-efficient transportation alternatives
- Green hydrogen development: Industrial decarbonisation projects gain strategic priority status
Critical Mineral Supply Chain Vulnerabilities
The transition toward renewable energy systems creates new geopolitical dependencies on critical mineral supply chains. Lithium, cobalt, and rare earth element markets face similar chokepoint vulnerabilities as traditional hydrocarbon markets.
Strategic Mineral Risk Assessment:
- Geographic concentration: 60-80% of critical minerals controlled by 2-3 dominant countries
- Processing bottlenecks: Single countries dominate 70-90% of mineral refining capacity
- Stockpiling strategies: Governments establish strategic reserves for energy transition materials
- Alternative material research: Investment in substitute technologies to reduce dependency
These emerging dependencies suggest that energy security challenges may shift rather than disappear during the global energy transition, requiring comprehensive supply chain risk management strategies. Consequently, critical minerals energy security considerations become paramount for future planning.
Building Resilient Energy Systems for Future Stability
Regional conflicts demonstrate the systemic vulnerabilities inherent in centralised energy supply chains. The Iran war impact on oil prices illustrates how economic costs extend far beyond immediate price increases, creating lasting impacts on inflation trajectories, economic growth patterns, and financial market stability.
Long-term Strategic Priorities:
- Supply chain diversification: Reducing dependence on single-source energy suppliers through geographic distribution
- Infrastructure resilience: Developing redundant transportation and processing capacity for crisis periods
- Energy storage expansion: Creating buffer capacity to manage both physical and financial supply disruptions
- International cooperation frameworks: Strengthening multilateral energy security coordination mechanisms
Understanding these complex dynamics enables policymakers, investors, and businesses to develop more robust strategies for managing energy price volatility while building economic systems capable of withstanding geopolitical shocks. In addition, comprehensive oil price rally analysis helps inform strategic planning decisions.
Risk Management Considerations:
Markets demonstrate that energy security extends beyond simple supply availability to encompass transportation security, processing capacity, and financial market stability. Comprehensive energy security requires integrated approaches addressing physical infrastructure, financial resilience, and geopolitical risk management.
The interconnected nature of global energy markets means that regional conflicts create worldwide economic implications that persist long after diplomatic resolution. Building truly resilient energy systems requires acknowledging these systemic vulnerabilities while developing adaptive capacity across multiple dimensions of energy security.
This analysis is based on publicly available market data and expert commentary. Energy market investments involve substantial risks, and past performance does not guarantee future results. Readers should conduct independent research and consider professional financial advice before making investment decisions related to energy sector exposure.
Seeking Opportunities in Energy Market Volatility?
Discovery Alert's proprietary Discovery IQ model helps investors navigate volatile markets by providing real-time alerts on significant ASX mineral discoveries, including energy-related commodities that often surge during geopolitical uncertainty. With energy price volatility creating both risks and opportunities across commodity markets, subscribers gain actionable insights to identify potential trading advantages ahead of broader market recognition. Begin your 14-day free trial today to position yourself strategically during these dynamic market conditions.