
June 19, 2026
The Physical Economy Is Repricing Faster Than Wall Street Expects
Commodity cycles have a habit of humbling the consensus. Investors who spent the 2010s rewarded for ignoring hard assets and doubling down on capital-light technology are now confronting a market environment that is structurally different from anything the past decade produced. The 30-year U.S. Treasury yield trading near 5.18% is not a blip. It is a reclassification of risk across every long-duration asset class, and it is quietly rewriting the investment case for energy stocks in a commodity cycle that most institutional portfolios are dangerously underexposed to.
When big ASX news breaks, our subscribers know first
Why This Commodity Cycle Is Structurally Different From Previous Ones
Supply Constraint, Not Demand Boom: A Critical Distinction
The commodity cycles most investors instinctively reference were demand-led. Chinese industrial expansion from the early 2000s through the mid-2010s pulled commodity prices higher by consuming steel, copper, and energy at a pace that supply chains struggled to match. The current cycle operates through an entirely different mechanism.
What defines this cycle is chronic underinvestment on the supply side, combined with energy security policy pivots that have fragmented previously integrated global supply chains. The capital expenditure drought in exploration and production that began around 2015 has left the global energy system structurally short. Research from BNY identifies the current cycle as having commenced in 2020, now entering its fifth year, with supply-demand imbalance still the dominant pricing force rather than any single demand catalyst.
This distinction matters enormously for investors positioning in energy stocks in a commodity cycle. Supply-constrained cycles tend to last longer than demand-driven ones because supply responses take years to develop. New wells require permitting, financing, drilling, and infrastructure. Refineries cannot be built overnight. The inertia works in favour of existing producers.
The Divergence Between Metals and Oil: A Framework Worth Understanding
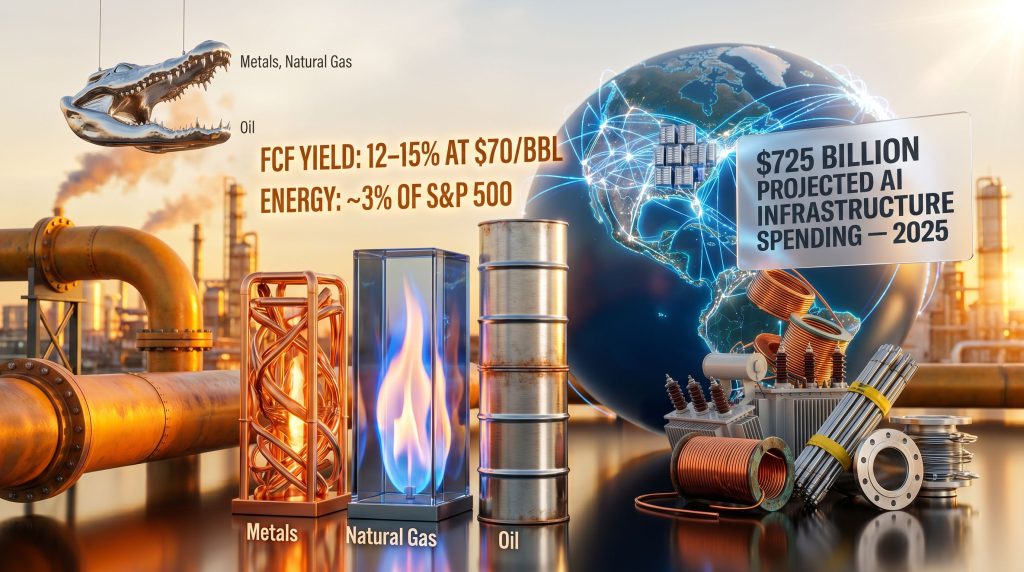
JPMorgan's research introduced what analysts have termed the crocodile cycle framework, which captures an unusual dynamic where industrial metals are rising while traditional crude oil is lagging. Expanded production capacity and technology-driven efficiency have allowed oil supply to grow faster than demand in some periods, while electrification, grid buildout, and AI infrastructure are pulling industrial metals and natural gas in the opposite direction.
Furthermore, a commodity outlook 2025 analysis reinforces how divergent sub-sector dynamics are reshaping portfolio construction decisions across the energy space.
For investors in energy stocks in a commodity cycle, sub-sector selection matters far more than broad energy exposure. The divergence between oil-weighted producers and gas or power infrastructure names represents one of the most consequential positioning decisions of the current decade.
What Is Driving Energy Stock Valuations Right Now?
Free Cash Flow as the Structural Valuation Floor
Oil equities are currently generating free cash flow yields of 12 to 15% at $70 per barrel, according to BNY research. This level of yield creates what functions as an effective valuation floor, a structural support mechanism rarely seen in previous cycles. Companies generating this level of free cash flow at conservative oil price assumptions are not dependent on commodity price appreciation to justify their valuations. The commodity upside, when it arrives, is additive rather than essential.
Recent weakness in oil equities relative to underlying commodity fundamentals is viewed by some analysts as overdone, suggesting a potential mean-reversion opportunity for patient investors. The math at $70 oil is compelling. Whether oil trades at $70 or $80, investors in well-positioned producers are generating returns that most other sectors cannot match at current prices.
The Dividend Yield Advantage Across the Energy Value Chain
Energy infrastructure is delivering dividend yields ranging from 4% to 10% across midstream pipelines, royalty structures, and integrated majors. This cash flow profile solves one of the most persistent problems in commodity investing: the cost of waiting.
Compare this with the technology sector, where major AI-focused firms are projected to spend $725 billion on AI infrastructure in 2025 alone, a figure reported by Bloomberg. These firms are no longer the capital-light growth businesses that justified their premium valuations. They have become capital-intensive infrastructure operators competing for the same physical inputs, including electricity, copper, transformers, and land, that the energy sector supplies.
Institutional Underweight: The Forced-Buying Dynamic Nobody Is Pricing In
Energy currently represents approximately 3% of the S&P 500 by weighting. In the early 1980s, energy commanded 32% of the index while technology held only 11 to 12%. That weighting reversal did not happen because energy fundamentals deteriorated permanently. It happened because technology attracted capital at an extraordinary rate during a prolonged period of low rates and multiple expansion.
The reversal of that trade creates a structural setup. Institutions that are systematically underweight energy face a forced reallocation if the sector continues to outperform. A pattern observed in precious metals during 2024 is instructive: miners and metals names drifted steadily higher through the middle of the year, then exploded 70 to 120% in a compressed timeframe once institutional buyers recognised their underweight and began competing to acquire positions simultaneously. The energy sector may be setting up for an analogous sequence.
Is This a Supercycle or a Tactical Trade? Weighing the Evidence
The Structural Bull Case
| Driver | Mechanism | Estimated Time Horizon |
|---|---|---|
| Chronic underinvestment | Reduced exploration and production capex since 2015 | 5 to 10 years |
| Energy security policy | Reshoring, strategic reserves, supply diversification | 3 to 7 years |
| AI power demand | Data centre electricity consumption growth | 1 to 5 years |
| Grid infrastructure rebuild | Copper, transformers, transmission, permitting bottlenecks | 5 to 15 years |
| Deglobalisation | Fragmented supply chains increasing commodity intensity | 5 to 10 years |
The Bear Case: Boom-Bust Mechanics and Supply Response Risk
Commodity cycles are inherently self-correcting. High prices incentivise new supply, which eventually overwhelms demand. Key risks to monitor include:
- An unexpected OPEC supply surge or breakdown in production discipline
- Resolution of Middle East shipping disruptions releasing suppressed supply volumes
- AI-driven energy demand proving to be a 1 to 3 year tailwind rather than a full secular shift
- A consumer-led demand contraction driven by credit exhaustion
Credit card delinquency rates have reached levels comparable to the 2008 to 2009 financial crisis. Auto loan delinquencies have exceeded prior cycle highs. These data points suggest the U.S. consumer is under meaningful stress, which eventually feeds into reduced energy consumption, particularly in transportation fuels.
Where the Evidence Points: Natural Gas and Power Infrastructure
U.S. Bank research confirms commodities are most attractive during broad supply shortage conditions. The 2021 to 2022 energy surge remains the clearest recent example. Natural gas, electricity generation, and infrastructure-linked energy names occupy the intersection of two powerful tailwinds simultaneously: AI demand growth and physical grid constraints. That combination is rare and may be more durable than either catalyst alone.
How the AI Infrastructure Buildout Changes the Energy Investment Thesis
Tech Giants Are Structurally Short on Physical Energy
Wall Street is pricing the AI buildout primarily as a software and semiconductor story. The physical reality is considerably more demanding. Data centres do not simply require electricity; they require:
- Copper wiring and cabling at industrial scale
- Transformer capacity that is already in short supply globally
- Transmission infrastructure that takes years to permit and build
- Water supply for cooling systems
- Land in proximity to existing grid infrastructure
- Permitting approvals through regulatory processes that do not accelerate to meet technology timelines
Wall Street is pricing AI infrastructure as a software story. The physical reality suggests the commodity inputs required to run the AI economy are significantly undervalued relative to the technology layer sitting on top of them.
The $725 billion in projected AI infrastructure spending by major U.S. technology firms in 2025 raises a fundamental question about the nature of these businesses. Companies that were formerly categorised as asset-light growth operators are now competing for the same physical supply chains as industrial manufacturers. Their capital intensity is rising at precisely the moment that commodity supply is constrained.
The Grid Bottleneck: The Structural Constraint Nobody Has Solved
Beyond oil and gas, the AI buildout requires a real-world reconstruction of the electrical grid. Key bottleneck commodities include copper, uranium, and industrial metals. The critical minerals demand driven by the energy transition is compounding these constraints, as permitting timelines and manufacturing lead times for large power transformers mean this is not a constraint that resolves quickly or predictably.
Investors positioned in commodity producers supplying these inputs may benefit regardless of whether AI delivers on its productivity promises at the application layer. The physical inputs are required whether the AI models perform as expected or not.
Which Energy Sub-Sectors Offer the Best Risk-Reward in This Cycle?
Comparing Sub-Sectors: A Structural Framework
| Sub-Sector | Commodity Cycle Sensitivity | Cash Flow Profile | Geopolitical Risk | AI/Infrastructure Tailwind |
|---|---|---|---|---|
| Upstream Oil Producers | High | Strong FCF at $70+ oil | High | Moderate |
| Natural Gas Producers | High | Strong, improving | Low to Moderate | High |
| Midstream Pipelines | Low to Moderate | Stable, high yield | Low | Moderate |
| Refiners | Moderate | Cyclical | Moderate | Low |
| Offshore Drillers | High | Improving | High | Low |
| Utilities and Power Infrastructure | Low | Stable, regulated | Low | Very High |
Upstream Producers: Oil and Natural Gas
Natural gas producers benefit from both LNG export growth and domestic AI power demand, positioning them at the intersection of two structural demand drivers. Oil producers generating strong free cash flow at current prices offer asymmetric upside if supply tightens further. Key metrics worth evaluating include lifting cost per barrel relative to prevailing price, reserve replacement ratios, and balance sheet leverage.
In addition, the ongoing copper supply crunch is creating secondary demand pressures across the energy value chain, reinforcing the case for owning across the full spectrum from upstream producers through to midstream pipelines and offshore drillers.
Midstream Pipelines: The Toll Road Model
Pipeline operators collect fees based on volume throughput, not commodity price direction. This structural characteristic means their revenues do not require commodity price appreciation to grow. Long-term contracted revenue streams reduce earnings volatility considerably relative to upstream producers.
The compounding power of 6% to 10% dividend yields held over 25-year ownership horizons is a concept that gets lost in short-term market noise. Infrastructure cash flows, reinvested consistently, compound into generational wealth in a way that momentum trading cannot replicate.
Offshore Drillers: The Lagging Recovery Opportunity
Significant well shutdowns and infrastructure disruption during 2020 to 2022 created a substantial redrilling backlog. As production ramps back up globally, drilling activity is expected to accelerate, benefiting contract drillers at a point when their pricing power is increasing. The risk profile is higher due to geopolitical exposure and day-rate volatility, but the potential returns for early-positioned investors are correspondingly larger.
The next major ASX story will hit our subscribers first
How Bond Markets and Interest Rates Affect Energy Stock Valuations
The 5.18% Long Bond Problem and Its Paradoxical Implications
The 30-year U.S. Treasury yield trading near 5.18% fundamentally alters the discount rate applied to long-duration assets. Higher long-term yields increase the hurdle rate for capital projects, which slows new supply development. Counterintuitively, this is bullish for existing producers who do not need to justify new capital expenditure to generate returns at current prices.
Floating rate debt tied to SOFR or prime rate creates balance sheet stress for highly leveraged energy companies. This creates an important screening variable for investors: low-debt energy producers with strong free cash flow are structurally advantaged in the current rate environment, while highly leveraged operators face compounding headwinds from both the rate environment and commodity price volatility.
Inflation, Sticky Rates, and the Hard Asset Relationship
Energy commodities have historically served as natural inflation hedges. Prices tend to rise alongside broader inflationary pressures, increasing producer revenues faster than production costs in many scenarios. If inflation remains persistently above the 2% target through 2025 to 2026, commodity producers benefit from both higher output prices and the relative undervaluation of hard assets versus financial assets.
Energy stocks have historically acted as inflation hedges because commodity prices tend to rise during inflationary periods, increasing producer revenues faster than costs. In a sticky inflation environment with elevated long-term bond yields, energy producers with low debt and strong free cash flow are among the most structurally advantaged asset classes available.
The traditional 60/40 portfolio faces structural headwinds in this environment. Long-duration bonds lose value as yields rise. Equity valuations remain stretched relative to historical averages. The asset class that benefits from both inflation and supply constraints, which is physical commodities and the companies that produce them, is the one most institutional portfolios are systematically underweight. Holding gold as a safe haven alongside energy positions can further reduce portfolio volatility during periods of acute market stress.
Key Risks to Energy Stock Positions in This Cycle
Managing Geopolitical Headline Risk
Energy prices react immediately to geopolitical developments. Supply route disruptions, sanctions changes, and diplomatic negotiations create intraday price swings that can unsettle investors focused on short-term price action. The key risk management insight is that companies with strong free cash flow at conservative oil price assumptions do not need geopolitical tailwinds to justify their valuations. Geopolitical upside is a bonus, not a requirement.
It is also worth noting that significant infrastructure damage and well shutdowns mean normalisation of supply routes does not immediately translate to normalised supply volumes. Rebuilding damaged infrastructure, recommissioning shut-in wells, and restoring supply chain logistics takes time measured in months to years, not days.
The Recession Timing Problem
Energy stocks historically perform well during commodity upcycles but decline sharply during recessions as demand contracts. The strategic challenge is positioning for the current commodity cycle while maintaining the flexibility to rotate out before a demand-driven downturn. Key signals to monitor include the relationship between GDP growth, industrial production, and energy consumption trends, as well as credit market stress indicators that precede consumer spending contractions.
Constructing an Energy-Weighted Portfolio for This Environment
A Portfolio Allocation Framework for a High-Rate, High-Inflation Decade
| Asset Class | Suggested Role | Rationale |
|---|---|---|
| Short-duration Treasuries (under 18 months) | Capital preservation, repricing flexibility | Avoids duration risk at elevated yields |
| Upstream energy producers | Commodity cycle participation | FCF yield, dividend income |
| Midstream pipelines | Stable income, inflation linkage | Volume-based fees, 6 to 10% yield |
| Commodity producers (copper, uranium) | AI and grid infrastructure exposure | Supply constraint, structural demand |
| Gold and precious metals | Currency hedge, tail risk protection | Central bank diversification demand |
| Cash-flowing real estate | Hard asset inflation hedge | Rent escalation, tax efficiency |
The Case for 40 to 45% in Short-Duration Instruments
Maintaining a substantial allocation to short-duration instruments, in the range of 40 to 45%, provides the optionality to deploy capital when valuations become compelling. Instruments with maturities of 3, 6, 9, and 18 months allow investors to reprice their fixed income allocation as rates move, capturing higher yields when rates rise rather than being locked into long-duration paper that loses value.
Tactical cash is not a drag on returns in this environment. At current short-duration Treasury yields, it is generating meaningful income while preserving the capacity to act decisively when high-quality companies trade 30 to 40% below recent highs. A well-considered asset allocation strategy that identifies quality businesses, applies present-value analysis to five-year earnings projections, and purchases at a further discount to intrinsic value is a framework that has compounded wealth through multiple cycles.
The Passive Index Problem in Late-Cycle Markets
Passive S&P 500 exposure increasingly includes companies that do not meet traditional profitability thresholds. Index inclusion criteria have evolved in ways that allow large-capitalisation loss-making companies to enter the index, creating automatic buying pressure for overvalued momentum names and simultaneous selling of undervalued value names during rebalancing events.
Active selection across the energy value chain allows investors to capture commodity cycle returns without the index's technology concentration risk. At 3% of the S&P 500, energy is so underweighted in passive vehicles that investors relying on index exposure are almost entirely absent from the sector that may deliver the strongest risk-adjusted returns of the current decade.
The Generational Wealth Perspective: Hard Assets for a Decade of Inflation
The Decade-Long Rebalancing From Financial to Hard Assets
The 2010s rewarded investors who allocated heavily to financial assets, equities and bonds benefiting from zero interest rates and quantitative easing. The 2020s are increasingly shaping up as a decade of hard asset outperformance, with commodities, real estate, and energy benefiting from inflation, underinvestment, and supply constraints that the prior decade actively suppressed.
Families seeking to preserve and transfer wealth across generations need exposure to assets that hold value in inflationary environments. Energy stocks, real estate with strong cash flows, and commodity producers represent the intersection of inflation protection and genuine earnings power that financial assets cannot replicate when rates are elevated and monetary policy is constrained. Schroders' analysis of commodities supercycles provides further context for understanding why structural tailwinds may persist well beyond the current decade.
Debt Discipline as the Foundation of Wealth Preservation
High-debt energy companies are structurally disadvantaged when the 30-year Treasury yield is trading near 5.18%. The same principle applies to personal and family balance sheets. Debt reduction is among the most reliable forms of wealth preservation in a high-rate, high-inflation decade, and teaching the next generation to distinguish between investment capital and a protected wealth base is a framework that compounds its value over time.
Thinking in Relative Terms: Beyond the Nominal Dollar Price
Evaluating energy assets purely in nominal dollar terms misses the purchasing power dimension entirely. Measuring asset values relative to gold, real estate replacement costs, or commodity baskets provides a more accurate picture of genuine wealth creation versus nominal price appreciation inflated by currency depreciation. Energy companies generating strong cash flows relative to their market capitalisation represent real value in this framework, not just nominal price movement.
Frequently Asked Questions: Energy Stocks in a Commodity Cycle
What makes energy stocks attractive during a commodity upcycle?
Energy producers benefit from rising commodity prices because revenues typically increase faster than production costs, expanding margins and free cash flow. In the current cycle, oil equities are generating free cash flow yields of 12 to 15% at $70 per barrel, while midstream infrastructure operators are delivering dividend yields of 6 to 10%.
How long do commodity cycles typically last?
Commodity cycles vary significantly in duration. The current cycle, which began in approximately 2020, is now in its fifth year. Supply-constrained cycles driven by underinvestment tend to last longer than demand-led cycles because supply responses take years to develop. Historical supercycles have lasted 10 to 20 years.
Are natural gas stocks better than oil stocks in this cycle?
Natural gas stocks may offer a stronger tailwind in the current environment due to AI data centre power demand and LNG export growth. Oil stocks offer strong free cash flow but face more uncertainty from OPEC supply decisions and potential demand softness. A diversified approach across both sub-sectors reduces single-commodity risk.
What is the biggest risk to energy stocks right now?
The primary risks include a consumer-led demand contraction, an unexpected OPEC supply surge, and the eventual arrival of a recession, which historically reduces energy demand and commodity prices. Geopolitical headline risk creates short-term volatility but rarely changes the fundamental investment thesis for well-capitalised producers with low leverage.
How does the AI buildout affect energy demand?
AI data centres require significant and growing amounts of electricity, driving demand for natural gas-fired power generation, nuclear energy, and grid infrastructure. The physical requirements of the AI buildout, including copper, transformers, transmission capacity, and water, create commodity demand that extends well beyond electricity generation alone.
Should investors own the whole energy value chain or focus on one segment?
Owning across the full value chain, from upstream producers and midstream pipelines through to refiners and drillers, provides exposure to different return drivers and reduces single-segment risk. Midstream pipelines provide stable income; upstream producers offer commodity price leverage; drillers provide exposure to the redrilling backlog; refiners capture crack spread dynamics.
Disclaimer: This article is intended for informational and educational purposes only and does not constitute financial advice. All forecasts, projections, and analyst views referenced are subject to change and involve material uncertainty. Past performance of commodity cycles, sector returns, and asset classes is not indicative of future results. Investors should conduct their own due diligence and consult a licensed financial adviser before making investment decisions. References to free cash flow yields, dividend yields, and index weightings are drawn from third-party research and are subject to revision.
Want to Capitalise on the Next Major Mineral Discovery Before the Market Catches On?
Discovery Alert's proprietary Discovery IQ model delivers real-time notifications on significant ASX mineral discoveries, instantly transforming complex mineral data into actionable investment insights — precisely the kind of edge that matters in a supply-constrained commodity cycle. Explore historic examples of major discoveries and their market returns, then begin your 14-day free trial at Discovery Alert to position yourself ahead of the broader market.