
July 5, 2026
The BloombergNEF Energy Storage 100 GW Era: What the Global Milestone Really Means for the Future of Power
Renewable energy technology has always followed a familiar arc: early-stage experimentation, gradual cost reduction, policy-driven deployment, and eventually, market-driven acceleration. Solar and wind both traversed this arc across decades. But energy storage has done something different. It has compressed that entire journey into a timeline that challenges conventional assumptions about how fast infrastructure transitions actually happen, and what it means when they do.
The BloombergNEF energy storage 100 GW era is not simply a headline figure. It is a signal that the electricity system itself is being fundamentally redesigned, from a network built around constant generation to one built around flexible, dispatchable power at scale.
When big ASX news breaks, our subscribers know first
Why 2025 Was the Year Global Energy Storage Changed Forever
The 100 GW Threshold: A Structural Inflection Point, Not Just a Number
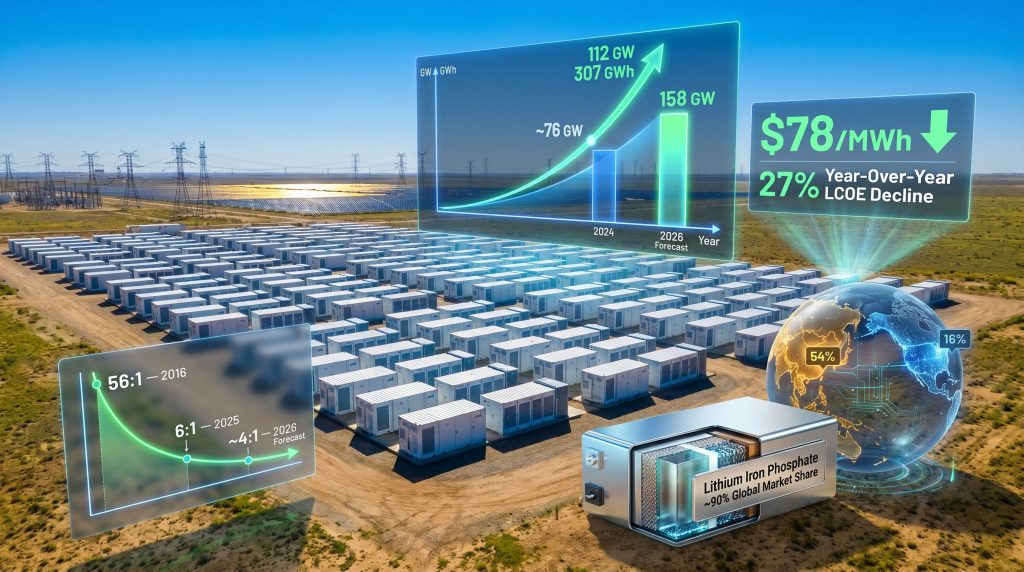
Annual energy storage installations globally reached 112 GW in 2025, with 307 GWh of battery capacity added to grids worldwide, according to BloombergNEF's Energy Storage Market Outlook for the first half of 2026. These figures represent a 48% year-over-year increase from 2024's approximately 76 GW and 208 GWh, confirming that the market has crossed a qualitatively different threshold.
The distinction between 99 GW and 100 GW is, in isolation, arbitrary. However, the crossing of this boundary signals something deeper: storage is no longer a supplementary grid asset deployed selectively in high-value markets. It is now a standard infrastructure component deployed at scale across multiple geographies, financing structures, and grid typologies.
How 112 GW of Annual Installations Redefines Grid Infrastructure Economics
At 112 GW of annual additions, energy storage has entered a volume range that begins to reshape procurement economics for adjacent industries. Grid operators must now plan for storage integration rather than treat it as an optional augmentation. Equipment manufacturers are scaling production lines to meet multi-year forward demand rather than speculative projections.
Furthermore, financing institutions are developing standardised debt and equity frameworks for BESS assets at a pace that mirrors utility-scale solar approximately eight years ago. Cumulative global energy storage capacity has now reached 2.9 terawatts (TW), a figure that excludes pumped hydro storage. This base underpins a rapidly expanding range of grid services, from frequency regulation and voltage support to energy arbitrage and renewable capacity firming.
Benchmarking the Milestone: Energy Storage vs. Solar vs. Wind Adoption Curves
The speed of this growth is perhaps the most analytically significant dimension of the 2025 milestone. According to BloombergNEF Senior Associate Isshu Kikuma, energy storage required only four years to scale from 10 GW to more than 100 GW in annual additions. Solar took approximately eight years to achieve equivalent scaling. Wind took roughly 15 years.
This compressed adoption curve suggests the energy storage market is not following the same gradual maturation pathway as its predecessor clean energy technologies. Instead, it has leveraged the cost infrastructure, supply chains, policy learnings, and financing mechanisms those technologies spent decades building, and accelerated through that learning curve at unprecedented speed.
This has direct implications for forecasters and investors. Pre-2020 BloombergNEF projections anticipated approximately 160 GWh of cumulative annual additions by 2030. The year 2025 alone delivered 307 GWh, almost double that decade-long forecast within a single calendar year. Markets that modelled linear growth trajectories have been repeatedly forced to revise upward.
How Fast Is the Global Energy Storage Market Actually Growing? The Data Behind the Surge
2025 Annual Installations: 112 GW and 307 GWh
The raw data from BloombergNEF's 1H 2026 Outlook presents a consistent picture of accelerating deployment across both capacity and energy metrics. The 48% growth rate from 2024 to 2025 is not an anomaly isolated to a single geography or technology class. It reflects broad-based demand expansion across utility-scale projects, commercial and industrial installations, and distributed storage applications.
Key Statistics Summary:
| Metric | 2024 | 2025 | 2026 Forecast |
|---|---|---|---|
| Annual Additions (GW) | ~76 GW | 112 GW | 158 GW |
| Annual Additions (GWh) | ~208 GWh | 307 GWh | 459 GWh |
| YoY Growth Rate | — | +48% | +41% (forecast) |
| Cumulative Capacity (ex. pumped hydro) | — | 2.9 TW | — |
Year-Over-Year Growth Rates and the 2026 Trajectory
The 2026 forecast of 158 GW and 459 GWh represents a further 41% increase on 2025 figures. What is notable is that the absolute volume being added each year is itself expanding rapidly. The incremental addition from 2025 to 2026 forecast (46 GW) exceeds the total annual installation figures from just a few years prior.
Fluence Corporation's reported $5.6 billion order backlog with a 147 GWh pipeline and doubled order pace in 2026 provides corroborating evidence from the supplier side that demand is not merely projected but actively contracted. When major system integrators are reporting order acceleration at this magnitude, the aggregate deployment figures begin to look conservative rather than optimistic.
Cumulative Capacity and What 2.9 TW Actually Means
The 2.9 TW cumulative figure (excluding pumped hydro) represents the total operational battery storage capacity that has been commissioned globally as of 2025. To contextualise this: the entire installed capacity of the United States electricity generation fleet is approximately 1.2 TW.
Global battery storage capacity now substantially exceeds that reference point, though the comparison requires careful interpretation given that storage systems deliver energy over time rather than continuously, making direct capacity comparisons with generation assets imprecise. The critical minerals demand underpinning this growth continues to accelerate alongside deployment figures.
Where Is Energy Storage Being Deployed? A Regional Power Map
China's Continued Dominance: 54% of 2025 Global Additions
China accounted for 54% of global energy storage additions in 2025, equating to approximately 60.5 GW of new capacity. This dominance reflects structural advantages across the full storage value chain, from cathode material processing and cell manufacturing through to systems integration and grid procurement.
China's market is shaped by co-location requirements that mandate renewable energy projects include storage capacity, state-coordinated procurement programmes that reduce financing risk, and a vertically integrated domestic supply chain capable of absorbing cost volatility that would destabilise import-dependent markets. These are structural, policy-embedded advantages rather than temporary competitive positions.
Markets with deeply integrated domestic supply chains absorb manufacturing and shipping cost volatility far more readily than import-dependent markets. According to BloombergNEF's Isshu Kikuma, impacts from geopolitical and commodity price disruptions will be more regional than equally shared, with import-dependent markets in Europe and Southeast Asia facing amplified exposure compared to China's integrated ecosystem.
In addition, Chinese battery recycling advances are reinforcing China's supply chain advantages, creating a closed-loop ecosystem that further reduces its dependence on raw material imports.
The United States at 16%: Utility-Scale Momentum and Procurement Pipelines
The United States represented approximately 16% of 2025 global additions, equating to roughly 17.9 GW. While a distant second to China, the US market is notable for its forward-looking procurement depth. Analysis published by ESS News in March 2025 reported that active utility requests for proposals, site applications, and procurement processes at the end of 2024 represented a pipeline exceeding 18.5 GW of grid-scale storage capacity. This pipeline positions the US for continued deployment acceleration through 2026 and beyond.
Emerging Markets on the Horizon
The remaining approximately 30% of global additions in 2025 represent a diverse cohort of markets at varying stages of market development:
-
India: According to reporting by ESS News citing Saurabh Kumar of the Global Energy Alliance for People and Planet, India is positioned for transformative expansion in battery energy storage capacity, with the country targeting a global leadership position in storage innovation by 2029.
-
Brazil: Chinese and domestic battery manufacturers have been actively positioning for the Brazilian market, driven by rising electricity costs, grid reliability challenges, and falling battery prices, according to ESS News reporting from mid-2025.
-
Middle East: Saudi Arabia's accelerating clean energy transition, underpinned by its digital economy expansion including data centre growth, is creating increasing demand for storage alongside solar deployment.
What Technology Is Powering the 100 GW Era? A Chemistry-Level Breakdown
Lithium Iron Phosphate (LFP): Why One Chemistry Now Accounts for 90% of Global Additions
The technological story of the BloombergNEF energy storage 100 GW era is, to a remarkable degree, the story of a single battery chemistry. Lithium iron phosphate (LFP) accounts for approximately 90% of annual energy storage additions globally, according to BloombergNEF's 1H 2026 Outlook.
LFP's market dominance reflects the convergence of several structural advantages:
-
Thermal stability: LFP cells operate at significantly lower risk of thermal runaway compared to nickel-manganese-cobalt (NMC) chemistries, a distinction that has become commercially significant following documented fire incidents at NMC-based projects. In May 2026, ESS News reported that a short circuit in NMC batteries caused a fire at one of the United Kingdom's oldest grid-scale BESS projects at Rufford Colliery, occurring just days before a scheduled technology augmentation.
-
Raw material accessibility: LFP cells use iron and phosphate rather than cobalt and nickel, reducing both the cost and supply chain concentration risks associated with NMC and nickel-manganese-aluminium (NMA) chemistries.
-
Manufacturing scale: Chinese manufacturers, led by CATL and BYD, have achieved extraordinary production scale in LFP cell manufacturing, driving cost reductions that no alternative chemistry can currently match at equivalent volume.
Technology Landscape Comparison:
| Technology | 2025 Market Share | Key Characteristics | Growth Trajectory |
|---|---|---|---|
| Lithium Iron Phosphate (LFP) | ~90% of additions | Cost-competitive, thermally stable, scalable | Dominant through mid-decade |
| Long-Duration Storage (≥6 hrs) | <2% but growing | Grid flexibility, renewable firming | Forecast to quadruple to 2 GW in 2026 |
| Sodium-Ion | Early commercial stage | Lower material cost, no cobalt/lithium dependency | Supply agreements emerging; share growing |
| Other Chemistries (NMC, Flow, etc.) | Residual share | Varied use cases | Safety concerns flagging NMC out of favour |
The Rise of Long-Duration Energy Storage (LDES)
BloombergNEF expects annual additions of long-duration energy storage, defined as systems with durations of six hours or longer, to quadruple to 2 GW in 2026. While this remains a small fraction of total annual additions, the quadrupling trajectory reflects growing recognition that renewable energy integration at high penetration levels requires storage systems capable of managing multi-hour or multi-day supply imbalances.
Long-duration storage serves a fundamentally different grid function than 2-hour or 4-hour systems. Where shorter-duration assets excel at peak shaving, frequency regulation, and intraday arbitrage, LDES systems address the deeper challenge of seasonal variability and multi-day renewable generation gaps. As solar and wind penetration increases toward 70-80% of generation in leading markets, LDES transitions from optional to necessary infrastructure.
Sodium-Ion Batteries: Emerging Supply Agreements Signal a Chemistry Transition Ahead
BloombergNEF's 1H 2026 Outlook highlights two significant sodium-ion battery supply agreements as indicators of a nascent but meaningful market shift:
-
CATL and HyperStong: A supply agreement covering 60 GWh of sodium-ion batteries, representing what has been reported as the world's largest sodium-ion battery order. This deal is significant not only for its volume but because it demonstrates that sodium-ion technology has reached a scale of commercial deployment that merits multi-decade supply contracting at the gigawatt-hour level.
-
Peak Energy and Jupiter Power: A supply agreement for 4.75 GWh of sodium-ion batteries for deployment in the United States market, signalling that sodium-ion is beginning to penetrate the world's second-largest storage market beyond pilot and demonstration scale.
Sodium-ion chemistry carries several structural advantages that could support market share gains in the medium term. The technology eliminates dependence on lithium and cobalt entirely, uses abundant sodium as the charge-carrying ion, and can leverage much of the same manufacturing infrastructure developed for LFP production. However, energy density remains lower than LFP at current development stages, which constrains applications where physical footprint is a limiting factor.
How Does the Cost Revolution Underpin the 100 GW Era?
Battery Storage LCOE Falls 27% Year-Over-Year to a Record $78/MWh in 2025
The cost trajectory of energy storage has been one of the defining economic stories of the past decade, and 2025 delivered another landmark reduction. According to BloombergNEF, the levelized cost of electricity (LCOE) for a 4-hour battery storage system reached approximately $78/MWh in 2025, representing a 27% year-over-year decline. For further context on how these record lows compare across clean energy technologies, BloombergNEF's battery storage cost analysis provides a detailed breakdown.
What is the current cost of battery energy storage? As of 2025, the LCOE for a 4-hour battery storage system has reached a record low of approximately $78/MWh, representing a 27% year-over-year decline. When paired with solar generation, the combined system cost averages around $57/MWh, making solar-plus-storage cost-competitive with or cheaper than fossil fuel peaking plants across multiple markets.
The solar-plus-storage combination at $57/MWh is the figure that arguably matters most for displacement economics. Gas peaking plants, which are the marginal generation assets in many electricity markets, typically operate at costs ranging from $80/MWh to well above $150/MWh depending on fuel prices and plant age. At $57/MWh, solar-plus-storage has moved from being theoretically competitive to being the economically rational choice for new capacity procurement in a growing number of markets.
What's Driving Cost Compression: Pack Design, Competition, and Scale
The 27% single-year cost reduction is not primarily attributable to any single technological breakthrough. It reflects the compounding of multiple simultaneous cost pressures:
-
Pack design optimisation: Cell-to-pack and cell-to-rack architectures reduce intermediate components, improving energy density per unit cost and simplifying manufacturing.
-
Manufacturer competition: Overcapacity in Chinese LFP cell manufacturing has intensified price competition, compressing margins across the supply chain and passing cost reductions to system buyers.
-
Scale effects: At 90+ GW of annual deployment, procurement volumes for standardised battery modules are creating purchasing efficiencies and logistics optimisations not achievable at smaller scale.
-
Standardisation: Emergence of standardised container-format BESS products reduces engineering and procurement costs for project developers, compressing the gap between cell-level and system-level costs.
Long-Term Cost Trajectory: 25-30% Additional LCOE Reduction Forecast Through 2035
BloombergNEF projects a further 25-30% reduction in LCOE for battery storage systems through 2035. If this trajectory materialises, the cost of battery storage will approach $55-60/MWh on a standalone basis, placing it below the operating costs of most existing fossil fuel generation assets in many markets, not merely new-build comparison costs. The battery metals investment landscape is evolving rapidly in response to these cost dynamics, reshaping capital allocation across the sector.
The next major ASX story will hit our subscribers first
Energy Storage vs. Solar: How the Deployment Gap Is Rapidly Closing
The Solar-to-Storage Ratio Collapses from 56:1 to 6:1
One of the most striking structural shifts in the global clean energy landscape is the collapse of the ratio between solar and energy storage annual deployment. In 2016, approximately 56 GW of solar was installed globally for every 1 GW of energy storage. By 2025, that ratio had fallen to 6:1. BloombergNEF's 1H 2026 Outlook forecasts a further compression to approximately 4:1 in 2026.
Solar-to-Storage Ratio Trend:
| Year | Solar-to-Storage Ratio |
|---|---|
| 2016 | 56:1 |
| 2025 | 6:1 |
| 2026 (Forecast) | ~4:1 |
This compression is driven by multiple structural forces operating simultaneously:
-
Standalone storage deployment: Battery systems are increasingly being procured independently of solar projects, particularly in wholesale electricity markets where arbitrage and ancillary service revenues justify pure-storage business cases.
-
Co-location mandates: Policy frameworks in China and increasingly in other markets require solar and wind developers to include storage capacity as a condition of grid connection or procurement eligibility.
-
Grid reliability economics: As solar penetration increases midday generation to levels that suppress wholesale prices below zero in some markets, the economic incentive to capture and time-shift that generation strengthens.
The Convergence Thesis: When Could Annual Storage Additions Match Solar?
If the ratio continues to compress at the trajectory implied by the 2016-2026 trend, annual storage additions could approach solar in the early-to-mid 2030s. This convergence thesis is speculative and carries significant uncertainty, including the possibility that solar deployment itself accelerates in response to data centre demand and electrification, pushing the denominator of the ratio higher. However, the directional trend is unambiguous and has proven more durable than most pre-2020 forecasts anticipated.
What Does the Decade Ahead Look Like? The 2026-2036 Forecast Unpacked
158 GW in 2026 and the Path to 2036
BloombergNEF's base case forecast projects 158 GW of annual additions in 2026, rising to 306 GW annually by 2036. Cumulative global capacity is projected to reach 2,867 GW with 10,514 GWh of energy content by end-2036, representing approximately ten times the 2025 installed base within a single decade. The renewable energy transition is a key driver of these projections, as grid operators increasingly require dispatchable clean power at scale.
Scenario Framing: The BloombergNEF 2036 base case assumes continued cost declines, stable policy environments, and no catastrophic supply chain disruption. Under a conservative scenario incorporating protectionist trade escalation, critical mineral constraints, or slower-than-expected grid interconnection approvals, cumulative capacity could fall materially short. Under an accelerated scenario driven by AI data centre power demand and large-scale EV fleet electrification, the 2036 figures could prove conservative.
AI Data Centres and EV Charging Infrastructure: The Demand Vectors That Could Accelerate the Forecast
Two demand vectors not fully captured in traditional energy storage forecasting frameworks have emerged as potential accelerators of the 2036 trajectory:
-
AI data centres: The exponential growth in artificial intelligence compute requirements is driving electricity demand growth in major markets at rates not seen since early industrial electrification. Data centres typically require highly reliable, low-latency power supply with minimal tolerance for grid instability. Collocated or proximate storage assets that provide power quality, backup capacity, and demand flexibility are increasingly part of data centre power architecture rather than optional additions.
-
EV charging infrastructure: As electric vehicle penetration accelerates, grid-integrated charging infrastructure increasingly incorporates bidirectional storage capability. Vehicle-to-grid (V2G) architectures and stationary buffer storage at high-power charging sites represent a demand segment that was negligible in the 2020-2024 base period but could represent meaningful incremental capacity by the early 2030s.
Historical Forecast Accuracy: Pre-2020 Projections vs. 2025 Reality
One discipline that the energy storage sector has repeatedly exercised is humility about long-range forecasting. Pre-2020 BloombergNEF projections anticipated approximately 160 GWh of annual additions by 2030. The year 2025 alone delivered 307 GWh, effectively doubling the decade-long forecast target within a single year, five years ahead of schedule.
This track record of systematic underestimation is not unique to storage. Solar deployment has consistently outpaced International Energy Agency baseline forecasts for nearly two decades. The pattern suggests that technology cost reduction, once it achieves critical mass, generates deployment feedback loops that are structurally difficult to model from a linear base.
What Are the Geopolitical and Supply Chain Risks to the 100 GW Growth Trajectory?
China's Battery Supply Chain Dominance: Strategic Asset or Global Vulnerability?
China's integrated position across cathode material processing, cell manufacturing, and systems integration creates both a structural advantage for global deployment economics and a concentration risk for non-Chinese markets. The practical consequence is that any disruption to Chinese manufacturing capacity, whether from trade policy escalation, industrial accidents, or energy supply constraints, has the potential to reverberate across global deployment pipelines in ways that are difficult to hedge.
Consequently, critical minerals energy transition security has become a central policy concern for governments seeking to reduce exposure to concentrated supply chains in a rapidly scaling storage market.
Geopolitical Impacts: The Iran Conflict and Fossil Fuel Price Volatility
BloombergNEF's Outlook addresses the potential impact of the Iran conflict on energy storage markets, concluding that the direct effect has been limited to date, primarily because of China's dominance in battery supply chains. However, the indirect effects of elevated fossil fuel prices create a more complex dynamic.
Elevated fossil fuel prices simultaneously improve the revenue case for energy storage assets by widening arbitrage spreads between peak and off-peak electricity prices, while also increasing manufacturing input costs, shipping expenses, and project financing risk. The net effect is regionally differentiated, with import-dependent markets in Europe and Southeast Asia bearing a disproportionate share of the cost headwinds compared to China's vertically integrated ecosystem.
EU Supply Chain Policy Shifts and European Manufacturing Challenges
Two developments in Europe highlight the complexity of building a storage market without China's supply chain advantages:
-
EU funding restrictions: The European Investment Bank has implemented funding bans covering high-risk inverters and BESS power conversion systems from certain suppliers, including Chinese manufacturers. This policy applies to billions in EIB funding for renewable projects including standalone and co-located storage, according to ESS News reporting from May 2026.
-
Morrow Batteries bankruptcy: Norwegian battery manufacturer Morrow Batteries announced it would file for bankruptcy in May 2026, citing a deteriorating liquidity position despite recent commercial progress. The collapse is a setback for European ambitions to develop domestic battery cell manufacturing capability independent of Asian supply chains.
These developments collectively illustrate the structural challenge Western markets face in attempting to build competitive domestic storage supply chains. Policy-driven demand creation is more straightforward than policy-driven manufacturing competitiveness, particularly when competing against supply chains with a decade of head start on cost reduction.
How Is Utility-Scale Storage Reshaping the Global Electricity Market?
Utility-Scale Projects Represent 85% of 2025 Capacity Additions
Utility-scale storage projects accounted for 85% of 2025 capacity additions, with energy shifting identified as the primary application. This concentration reflects the economics of large-scale procurement: per-unit costs are lower, financing is more accessible for large standardised assets, and the revenue streams from wholesale energy arbitrage and ancillary service contracts are more predictable at scale.
Energy shifting, the practice of charging a storage system during periods of low wholesale electricity prices and discharging during high-price periods, has become the dominant revenue mechanism for utility-scale BESS in most markets. As the solar-to-storage ratio continues to compress and midday renewable generation regularly exceeds demand in high-penetration markets, the arbitrage spread that drives energy shifting revenue widens, strengthening the standalone business case for new storage procurement.
From Peaker Replacement to Grid Backbone
The evolution of utility-scale storage's grid role over the past five years has been qualitative as well as quantitative. Early BESS deployments were positioned primarily as frequency regulation assets, providing fast-response ancillary services in wholesale markets where those services commanded premium prices. As deployment volumes increased and frequency regulation markets became saturated, storage operators shifted toward longer-duration energy arbitrage applications.
The next transition, already underway in leading markets, is from energy arbitrage to capacity provision. Storage systems are increasingly contracted as firm capacity resources, replacing gas peaking plants in capacity auction frameworks. This transition requires systems with sufficient duration to provide multiple consecutive hours of output at rated power, which explains the forecast growth in long-duration energy storage from its current below-2% market share.
Distributed Storage, Residential, and C&I Applications: The 15% With Potential to Grow
The remaining 15% of 2025 additions spanning residential, commercial, and industrial distributed storage applications represents the market segment with perhaps the greatest untapped growth potential relative to current scale. In markets with high retail electricity prices, favourable time-of-use tariff structures, or limited grid reliability, distributed storage business cases can match or exceed utility-scale economics on a per-unit basis.
The emergence of virtual power plant aggregation platforms is beginning to unlock the collective grid value of distributed storage at scale. By coordinating thousands of behind-the-meter batteries as a single dispatchable resource, aggregators can access wholesale market revenue streams previously available only to utility-scale assets, improving the financial returns that justify distributed storage investment.
Frequently Asked Questions: BloombergNEF Energy Storage 100 GW Era
What Does the "100 GW Era" Mean for Energy Storage?
The 100 GW era refers to the point at which annual global energy storage installations exceeded 100 GW for the first time, crossing this threshold in 2025 with 112 GW of new capacity commissioned. BloombergNEF uses this designation to mark a fundamental transition in the sector's scale, economics, and systemic importance.
How Much Energy Storage Was Installed Globally in 2025?
According to BloombergNEF's Energy Storage Market Outlook for 1H 2026, global energy storage installations reached 112 GW in power capacity terms and 307 GWh in energy content terms during 2025, representing 48% growth over 2024.
Which Country Leads Global Energy Storage Deployment?
China leads global energy storage deployment by a substantial margin, accounting for approximately 54% of 2025 additions. The United States is second at approximately 16%, with the remaining 30% distributed across emerging and developed markets globally.
What Battery Chemistry Dominates the Global Energy Storage Market?
Lithium iron phosphate (LFP) accounts for approximately 90% of global annual energy storage additions, driven by its cost competitiveness, thermal stability, and the manufacturing scale of Chinese LFP producers.
How Does Energy Storage Growth Compare to Solar and Wind Adoption?
Energy storage scaled from 10 GW to over 100 GW in annual additions in approximately four years, roughly half the time solar required (approximately eight years) and less than a third of the time wind required (approximately 15 years) for equivalent scaling.
What Is the BloombergNEF Forecast for Energy Storage by 2036?
BloombergNEF's base case projects cumulative global energy storage capacity of 2,867 GW with 10,514 GWh of energy content by end-2036, with 306 GW of annual additions in that year, approximately ten times 2025 levels.
How Have Battery Storage Costs Changed in Recent Years?
The LCOE for a 4-hour battery storage system fell approximately 27% year-over-year to around $78/MWh in 2025. When combined with solar, the blended system cost reaches approximately $57/MWh, competitive with or below the operating cost of gas peaking plants in many markets. BloombergNEF forecasts a further 25-30% reduction through 2035.
What Risks Could Slow the Global Energy Storage Expansion?
Key risks include China's supply chain concentration, protectionist trade policy escalation, grid interconnection backlogs in Western markets, critical mineral constraints, the demonstrated difficulty of building competitive Western battery manufacturing capacity, and geopolitical events that affect shipping and manufacturing input costs.
Key Takeaways: What the 100 GW Milestone Means for Investors, Policymakers, and Grid Operators
For Investors: Market Maturity Signals Lower Risk, Higher Deployment Certainty
The BloombergNEF energy storage 100 GW era marks a transition in the risk profile of storage investments. Early-stage technology risk has diminished substantially for LFP-based utility-scale BESS. The remaining risk profile is concentrated in market structure (revenue certainty, contract duration, wholesale market design) and supply chain exposure (currency risk, tariff risk, logistics costs).
Investors with established frameworks for utility-scale renewable energy infrastructure can apply largely comparable analytical tools to BESS assets, which was not true five years ago. The forward-looking pipeline exemplified by Fluence's $5.6 billion order backlog and doubled order pace in 2026 indicates that the order-to-delivery cycle is now functioning at scale, reducing execution risk for investors with multi-year deployment horizons.
For Policymakers: The Infrastructure Mandate Is Now Defined by Storage Integration
The 85% utility-scale share of 2025 additions and the accelerating solar-to-storage ratio compression indicate that storage is no longer discretionary in grid infrastructure planning. Policymakers who continue to treat storage as an optional add-on to renewable procurement will face increasing grid instability, higher balancing costs, and constrained renewable penetration as variable generation assets exceed the grid's ability to absorb without dispatchability.
The EU experience, where funding policy restrictions on Chinese storage components intersect with the failure of domestic manufacturing alternatives like Morrow Batteries, illustrates that supply chain policy and deployment policy must be designed in coordination rather than in isolation.
For Grid Operators: The Transition from Supplementary Asset to Core Infrastructure
Grid operators are navigating the practical reality that an asset class representing less than 1% of system capacity five years ago now requires integration at the core of system dispatch, ancillary service procurement, and long-term capacity planning. The operational frameworks, market mechanisms, and regulatory accounting methods that were developed for generation-dominated grids are being stress-tested by storage at scale.
The crossing of the 100 GW annual deployment threshold represents a fundamental restructuring of how electricity systems are designed, financed, and operated. Markets that fail to integrate storage at scale will face increasing grid instability, higher consumer electricity costs, and reduced competitiveness in attracting energy-intensive industries such as data centres and advanced manufacturing.
The decade ahead will determine whether the structural potential of the BloombergNEF energy storage 100 GW era is converted into a redesigned global electricity system, or whether supply chain constraints, policy inconsistency, and manufacturing concentration risks slow the transition below its current trajectory. The data from 2025 suggests the underlying momentum is stronger than any prior period in the sector's history.
This article is based on data from BloombergNEF's Energy Storage Market Outlook for 1H 2026, as reported by ESS News. Forward-looking statements, forecasts, and projections discussed herein are subject to significant uncertainty and should not be interpreted as investment advice. Actual deployment outcomes may differ materially from forecasted figures due to policy changes, supply chain developments, and other factors not captured in base case modelling.
Want to Stay Ahead of the Critical Minerals Driving the Energy Storage Revolution?
The explosive growth in battery energy storage is accelerating demand for the lithium, iron, phosphate, and sodium underpinning this $78/MWh cost revolution — and Discovery Alert's proprietary Discovery IQ model delivers real-time alerts the moment significant ASX mineral discoveries are announced, turning complex geological data into actionable investment insights. Explore how historic mineral discoveries have generated extraordinary returns and begin your 14-day free trial to position yourself ahead of the market as the 100 GW era reshapes global critical minerals demand.