May 11, 2026
When Industrial Indices Mislead: Understanding the Gap Between Data and Reality in Oil-Dependent Economies
Every month, statistical agencies across commodity-exporting nations publish industrial production indices that can send superficially alarming signals to investors and policymakers alike. A double-digit percentage decline in headline output looks catastrophic in isolation. Saudi industrial production falls amid oil sector decline as a recurring theme, yet for economies where a single commodity sector dominates the index composition, that headline figure can mask a far more nuanced and often healthier underlying picture. Saudi Arabia's March 2026 data is a textbook illustration of exactly this dynamic.
Understanding why requires looking beyond the number itself and into the architecture of how industrial output is measured, weighted, and ultimately distorted by the deliberate decisions of global supply management coalitions. For context, crude oil price trends play a significant role in shaping these outcomes.
When big ASX news breaks, our subscribers know first
What the Saudi IPI Actually Measures — and Why Context Is Everything
Saudi Arabia's Industrial Production Index, compiled and published monthly by the General Authority for Statistics (GASTAT), tracks output volumes across three primary sectors: mining and quarrying (which includes crude oil extraction), manufacturing, and utilities encompassing electricity, water, and gas supply. As a composite measure, it functions as a barometer of industrial sector health and serves as a leading indicator of broader GDP performance.
The critical structural distinction between Saudi Arabia's IPI and those of diversified industrial economies lies in sectoral weighting. In a country like Germany or South Korea, manufacturing spans hundreds of product categories across chemicals, automotive, electronics, and machinery, creating natural diversification within the index itself. Saudi Arabia's index, by contrast, carries a disproportionately large exposure to hydrocarbon extraction.
This concentration means that any deliberate adjustment to crude oil output — whether driven by market conditions or coordinated production policy — transmits directly and forcefully into the aggregate headline reading. This is not a flaw in the statistical methodology. It accurately reflects the current composition of the industrial economy. However, it does mean that interpreting the Saudi IPI requires a layer of analytical decomposition that headline figures alone cannot provide.
The Structural Weight of Oil in Saudi Industrial Output
The relationship between crude oil production volumes and Saudi IPI readings is not merely correlational — it is mechanically embedded in the index architecture. When OPEC+ member states agree to adjust production quotas, the downstream effect on Saudi industrial statistics is near-instantaneous. Furthermore, reduced crude extraction compresses the mining and quarrying component, which then reverberates into refined petroleum product manufacturing and petrochemical feedstock availability, cascading through multiple sub-sectors simultaneously.
OPEC's market influence explains why a policy decision made in a meeting room can produce statistical outcomes that, stripped of context, resemble an industrial recession.
Saudi Industrial Production Falls Amid Oil Sector Decline: Dissecting the March 2026 Numbers
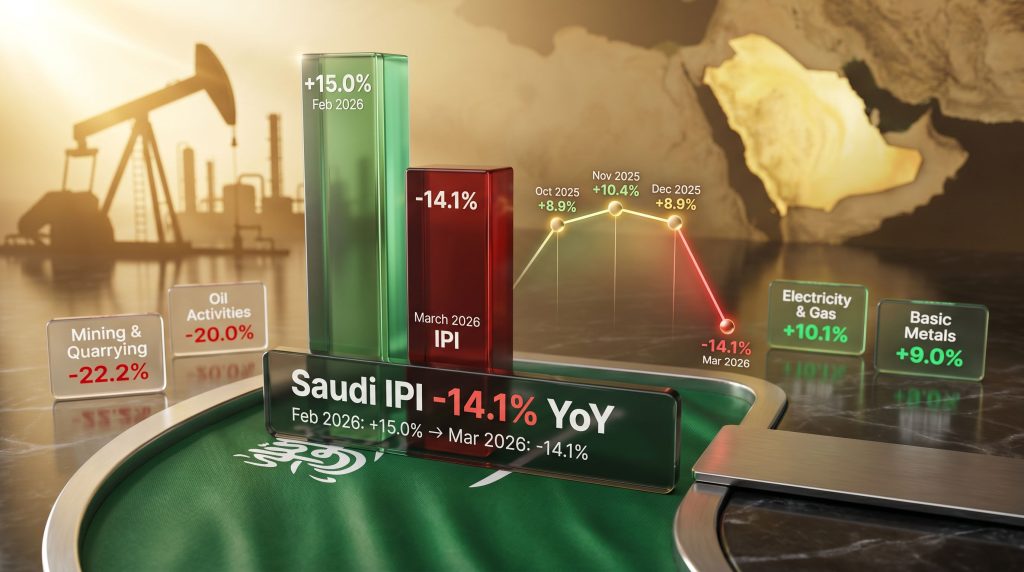
According to data published by GASTAT and reported by the Saudi Gazette on May 11, 2026, Saudi Arabia's IPI declined by 14.1% year-on-year in March 2026. On a monthly basis, the index contracted 22.3% compared to February 2026 — a swing of extraordinary magnitude that requires careful unpacking.
The sector-by-sector breakdown confirms that the decline was neither uniform nor indicative of broad-based industrial weakness. The following table presents the full picture from GASTAT's March 2026 release:
| Sector | Year-on-Year Change | Month-on-Month Change |
|---|---|---|
| Overall IPI | -14.1% | -22.3% |
| Mining & Quarrying | -22.2% | -36.0% |
| Oil Activities | -20.0% | -30.8% |
| Manufacturing (Total) | -4.7% | -0.7% |
| Coke & Refined Petroleum Products | -11.6% | N/A |
| Chemicals & Chemical Products | -4.5% | N/A |
| Electricity, Gas & Steam Supply | +10.1% | N/A |
| Basic Metals Manufacturing | +9.0% | N/A |
| Water Supply & Waste Management | +1.1% | N/A |
| Non-Oil Activities (Aggregate) | Broadly Stable | +1.4% |
Source: General Authority for Statistics (GASTAT), Saudi Gazette, May 11, 2026
Mining and Quarrying: The Epicentre of the Contraction
Mining and quarrying recorded the single steepest sectoral decline within the IPI basket, falling 22.2% year-on-year and collapsing 36% on a monthly basis from February to March 2026. This sub-sector sits closest to the crude extraction process itself, making it the most immediate receptor of OPEC+ production quota adjustments.
The monthly contraction of 36% is a figure that demands particular attention. Swings of this magnitude within a single calendar month do not arise from gradual demand deterioration or structural industrial decline. They reflect the near-instantaneous transmission of a policy-level output decision into measured extraction volumes — a statistical feature unique to resource-concentrated industrial indices.
Manufacturing: A Distorted Aggregate
Total manufacturing contracted 4.7% year-on-year, but this aggregate is misleading without disaggregation. The manufacturing sub-sector most directly exposed to crude supply — coke and refined petroleum products — fell 11.6% year-on-year, pulling the manufacturing headline lower. Chemicals and chemical products, which rely heavily on refinery-derived feedstocks, declined a further 4.5%.
When these petroleum-linked manufacturing categories are conceptually separated from the broader industrial base, the picture shifts considerably. The monthly manufacturing change of just -0.7% further supports the interpretation that non-petroleum manufacturing activity remained largely intact through March 2026.
The OPEC+ Transmission Mechanism: From Policy Decision to Statistical Outcome
Understanding why Saudi industrial production falls amid oil sector decline requires tracing the precise causal chain from production policy through to the statistical record. The mechanism operates across five sequential stages:
-
Quota adjustment: OPEC+ member states agree to reduce extraction commitments, with Saudi Arabia absorbing a substantial share of the collective reduction.
-
Upstream contraction: Saudi Aramco reduces mandated crude extraction volumes in line with the revised quota, directly compressing mining and quarrying activity.
-
Refinery throughput reduction: Lower crude availability constrains the volume of feedstock entering Saudi refineries, reducing throughput and compressing the coke and refined petroleum products manufacturing sub-sector.
-
Petrochemical cascade: Refinery output serves as a primary feedstock for petrochemical manufacturing. As refinery throughput falls, downstream chemicals production contracts in parallel, amplifying the manufacturing sub-sector decline.
-
IPI aggregation: Each of these contractions is captured within their respective IPI components and aggregated into the headline figure, producing a decline that is far larger than any single sector's performance would suggest in isolation.
"The March 2026 IPI contraction is best understood not as evidence of Saudi industrial weakness, but as the statistical footprint of a deliberate, coordinated supply management decision. The index is functioning exactly as designed — it is the interpretation that requires adjustment."
Why the February-to-March Swing Is So Extreme
The monthly collapse from February's elevated levels to March's contraction reflects a base-period phenomenon compounded by the abruptness of production adjustments. February 2026 had recorded a +15.0% year-on-year surge — a period during which extraction volumes were elevated relative to the prior year's comparison period. The subsequent March pullback, driven by quota compliance, produced a swing of approximately 37 percentage points between consecutive monthly year-on-year readings.
This oscillation pattern is not new. Historical IPI data for the period immediately preceding March 2026 shows a consistent pattern of double-digit annual gains through October to December 2025, with oil activities growing strongly across that period. Consequently, the comparison base established during those months of elevated production amplified the apparent severity of March 2026's year-on-year contraction.
Non-Oil Sectors: The Structural Story Beneath the Headline
Perhaps the most analytically significant aspect of the March 2026 IPI data is what did not decline. Several sectors within the index not only avoided contraction but recorded meaningful annual growth:
-
Electricity, gas, steam, and air conditioning supply expanded 10.1% year-on-year, reflecting the sustained growth in domestic energy consumption driven by population expansion, infrastructure development, and increased industrial activity in non-oil sectors.
-
Basic metals manufacturing posted a 9.0% annual increase, a figure consistent with accelerating demand from construction and infrastructure projects linked to Vision 2030 capital programmes. This mirrors patterns seen in industrial commodity demand across major emerging economies.
-
Water supply, sewerage, and waste management rose 1.1% year-on-year, tracking the long-term infrastructure investment trajectory.
-
Non-oil activities in aggregate remained broadly stable year-on-year and recorded a +1.4% month-on-month increase, a meaningful divergence from the headline IPI contraction.
"The widening gap between oil-linked and non-oil industrial performance is not a temporary anomaly. It represents a structural shift in the composition of Saudi industrial output — one that has been deliberately engineered through sustained diversification investment."
What the Electricity Sector Growth Signals
A 10.1% annual expansion in electricity, gas, and steam supply carries layered implications. At the surface level, it reflects rising domestic consumption. However, it also signals the expanding capacity requirements of a non-oil industrial base that is genuinely growing. Power-intensive sectors such as data centres, advanced manufacturing, desalination, and mining of non-hydrocarbon minerals all contribute to electricity demand growth, suggesting that the non-oil industrial economy is drawing meaningfully more energy to support its expansion.
Situating March 2026 Within the Broader Economic Context
Any analysis of Saudi industrial production data must be grounded in the broader macroeconomic context. Saudi Arabia's economy expanded at a strong pace in the quarters preceding March 2026, with crude oil and natural gas activities recording particularly robust growth in Q4 2025. This strong late-2025 performance established a demanding comparison base, mechanically amplifying the apparent severity of March 2026's year-on-year reading.
Non-oil GDP growth has remained consistently positive, underpinned by the progressive expansion of:
- Tourism and hospitality, driven by giga-project development across NEOM, the Red Sea Project, and Diriyah
- Financial services, supported by capital markets deepening and the ongoing growth of Islamic finance infrastructure
- Construction and real estate, reflecting sustained government and private sector capital expenditure
- Technology and digital services, as the Kingdom advances its digital transformation agenda
The divergence between oil-sector IPI performance and non-oil GDP growth is not contradictory — it is the intended outcome of Vision 2030's structural reorientation of the Saudi economy. In addition, the Saudi mining strategy underpins the Kingdom's longer-term ambitions to diversify industrial output beyond hydrocarbons.
The Fiscal Feedback Loop
One dimension of OPEC+ production management that is frequently underappreciated in industrial analysis is the fiscal feedback loop it creates. When coordinated production cuts succeed in supporting global crude prices, the resulting increase in per-barrel revenue can offset the volumetric reduction in output. Higher oil revenues flowing into the Saudi sovereign balance sheet fund the capital expenditure programmes — in infrastructure, manufacturing, tourism, and technology — that are driving non-oil industrial growth.
In this sense, short-term IPI weakness attributable to production cuts may be a calculated trade-off: accepting a depressed headline industrial index reading in exchange for the price-supported fiscal capacity to accelerate the very diversification that will eventually reduce the index's sensitivity to oil production swings. Indeed, Al Jazeera has reported that Saudi Arabia posted a $33.5 billion budget deficit amid the drop in oil sales, further illustrating the fiscal pressures at play.
The next major ASX story will hit our subscribers first
GCC Industrial Strategy: A Region Pulling in Multiple Directions
Saudi Arabia's IPI trajectory sits within a broader regional context of diverging industrial strategies. The UAE has pursued a manufacturing localisation agenda of considerable ambition, with a planned $49 billion industrial procurement drive targeting the localisation of 5,000 products — a programme that directly reduces UAE industrial output's dependence on commodity extraction cycles.
Oman's industrial diversification is advancing through non-oil export growth and improving profitability among listed companies in manufacturing and services sectors. These regional peers illustrate a spectrum of industrial transition speeds and strategies, with each economy managing the tension between hydrocarbon dependency and diversification at its own pace.
The March 2026 Saudi data reinforces a pattern visible across the GCC: nations that have invested earliest and most heavily in non-oil industrial capacity are demonstrably better insulated from OPEC+ output cycle volatility. Saudi Arabia's basic metals and utilities performance in March 2026, even as oil activities collapsed, offers early evidence that its own insulation capacity is growing. Furthermore, the broader transition is supported by global critical minerals demand, which is reshaping investment priorities across the region.
Frequently Asked Questions
What caused Saudi Arabia's industrial production to fall 14.1% in March 2026?
The primary driver was a 20% year-on-year decline in oil activities, directly linked to production quota management within the OPEC+ framework. Mining and quarrying — the sub-sector most directly exposed to crude extraction — fell 22.2% year-on-year. Downstream manufacturing of refined petroleum products and chemicals contracted in parallel, compounding the headline decline. The contraction is policy-driven rather than reflective of structural industrial deterioration.
Did all Saudi industrial sectors contract in March 2026?
No. Multiple non-oil sectors expanded. Electricity, gas, and steam supply rose 10.1% year-on-year, basic metals manufacturing grew 9.0%, water supply and waste management increased 1.1%, and non-oil activities as a whole remained stable annually while rising 1.4% month-on-month.
Does the March 2026 IPI decline signal an economic recession in Saudi Arabia?
Not based on available data. The contraction is primarily a policy-induced outcome reflecting coordinated supply management rather than demand deterioration or structural industrial failure. Saudi non-oil sectors continued to expand, and the Kingdom's broader GDP trajectory remained positive heading into 2026.
How does the OPEC+ framework affect Saudi Arabia's Industrial Production Index?
Production quota adjustments reduce crude extraction volumes, directly compressing the mining and quarrying component of the IPI. This contraction cascades downstream into refinery throughput and petrochemical feedstock availability, affecting multiple manufacturing sub-sectors linked to petroleum processing. Non-oil manufacturing sub-sectors are largely insulated from this transmission pathway.
What is GASTAT and why does its data matter?
GASTAT is the General Authority for Statistics of Saudi Arabia — the official government body responsible for compiling and publishing economic and industrial data, including the monthly Industrial Production Index. Its releases serve as the primary authoritative source for tracking Saudi industrial sector performance and are closely monitored by investors, policymakers, and international economic institutions.
Key Takeaways: Reading the March 2026 IPI Correctly
The March 2026 data presents a deceptively simple headline that rewards deeper examination. Several conclusions emerge from a structured reading of the full sectoral breakdown:
-
The headline decline is policy-driven: Saudi industrial production falls amid oil sector decline as a direct result of OPEC+ output management rather than any deterioration in Saudi Arabia's industrial capacity or competitiveness.
-
Non-oil resilience is measurable and growing: Utilities, basic metals, and stable non-oil manufacturing performance confirm that diversification investment is producing tangible results at the sectoral level.
-
IPI volatility is a structural feature, not a bug: The swing from elevated growth in late 2025 to a significant contraction in March 2026 illustrates the inherent instability of an index still heavily weighted toward oil production volumes. Investors and analysts should price this volatility into their interpretation framework.
-
Base effects will moderate future comparisons: As the high-growth late-2025 period recedes from the year-on-year comparison window, subsequent IPI readings are likely to stabilise, reducing the appearance of dramatic swings.
-
Non-oil manufacturing trajectory is the key signal: The performance of chemicals, basic metals, construction-linked manufacturing, and utilities will serve as the most reliable long-term indicator of genuine industrial diversification progress — far more so than any headline IPI reading dominated by crude extraction volumes.
This article is intended for informational purposes only and does not constitute financial or investment advice. Economic data references are drawn from GASTAT publications as reported by the Saudi Gazette (May 11, 2026). Figures relating to OPEC+ production volumes, historical GDP growth rates, and Vision 2030 project details should be independently verified against official primary sources before being relied upon for investment or policy decisions.
Want To Identify The Next Major Mineral Discovery Before The Market Does?
While commodity-dependent economies navigate the complexities of resource price cycles and industrial output volatility, Discovery Alert's proprietary Discovery IQ model delivers real-time alerts on significant ASX mineral discoveries, transforming complex geological data into actionable investment insights — explore the historic returns major discoveries have generated and begin your 14-day free trial today to position yourself ahead of the broader market.